Abstract
The system under investigation is a deformable photovoltaic–wind hybrid system which utilizes both solar and wind energy by combining PV modules with a vertical-axis wind turbine. This system contains 5 PV modules separated by 72° angles; these modules are attached to the blades of the vertical-axis wind turbine. This leads to each module receiving a different amount of solar irradiation, which affects the generated output power. In this study, the VOC and ISC of the modules were measured against different factors that influence the output power, including factors such as solar insulation, module temperature, module tilt angle θ, and module azimuth angle ϕ. These measurements were entered into the MATLAB curve fitter to produce a model of each parameter. The results showed that as the tilt angle θ decreased from the default, the VOC increased slightly, while ISC increased significantly. And when the module temperature increased, VOC decreased significantly, while the ISC increased slightly. The results of the study showed that by changing the module tilt angle and module azimuth angle, the solar insolation received at the module surface changed, which leads to different VOC and ISC values. Also, this study showed that the VOC and ISC values varied with time.
1. Introduction
Among the various alternative energy sources, solar energy holds a significant position [1]. Solar energy studies still lack information regarding solar radiation and its components at a specific location [2]. Many countries have embraced solar energy due to its beneficial features, which include the fact that it is infinite, eco-friendly, quiet, and requires low-maintenance expenses [3]. Since 2010, more measures have been taken to improve the world’s photovoltaic (PV) capacity than in the previous 40 years [4]. Recently, there has been an enormous increase in the understanding of the operational principle of photovoltaic devices, which has led to a rapid increase in power [5]. Regarding PV modules, higher temperatures can have a negative impact on their efficiency, leading to a reduction in the amount of power generated [6]. Raising the operating temperature of a PV system causes a decline in its open-circuit voltage, fill factor, and power output. This, in turn, results in a decrease in the conversion efficiency and can potentially harm the material of the PV module [7]. The parameters of PV modules are not constant, and they can be affected by the level of irradiation and temperature. The short-circuit current is not linearly proportional to the irradiation, and the same is true for the photocurrent, while the shunt resistance is more sensitive to changes in irradiation compared to the series resistance [8]. Investigating the impact of environmental factors on photovoltaic performance revealed that a high air temperature led to a decrease of 1.85–20.22% in the generated power, while high humidity caused the biggest reduction of 32.23% [9]. The impact of wind speed on the PV module’s surface temperature resulted in the temperature decreasing as the wind speed increased [10]. A study on global radiation in Jeddah, Saudi Arabia, concluded that to receive the maximum amount of energy from the PV module, the module should be tilted by an angle of 15° ± altitude (+ for winter; − for summer) [11]. Any module with optimal tilt angle installation will produce 7–8% extra power for any location [12]. Shading from nearby surroundings make using modules facing the equator to be difficult [13]. The output I-V and P-V characteristics were used to compare the MPP tracking and various parameters, including peak current, peak voltage, open-circuit voltage, and short-circuit current values, after examining various models. The manufacturer’s specifications were then compared to the findings of [14]. Here’s a step-by-step guide for simulating PV cells, modules, and arrays using Tag tools in MATLAB/Simulink. We will be using the DS-100M solar panel as a reference model, which has output characteristic curves that match the DS-100M panel [15].
2. Methodology
The purpose of this document is to create a model for a photovoltaic (PV) module using various parameters. To achieve this goal, an investigation was conducted to determine the impact of temperature, tilt angle, azimuth angle, solar irradiation, and time on the VOC and ISC of a PV module. This document includes two main experiments, one measuring an entire system with five PV modules, and the other involving the creation of a model for each parameter using a single PV module.
2.1. Measuring VOC and ISC for the Whole System
The system under investigation uses 5 PV modules attached to the blades of a vertical-axis wind turbine; the modules are connected in parallel. The study should include readings from different directions to cover the maximum number of possible positions of the modules. The specifications of the PV modules used in this experiment are listed in Table 1.

Table 1.
Specifications of the PV Modules used.
The system set-up is shown in Figure 1, where the 5 PV modules are attached to the blades of the turbine and tilted to a specific tilt angle, and each PV has a different direction; the tilt angle of the module was varied using a simple geared motor controlled by an Arduino microcontroller.
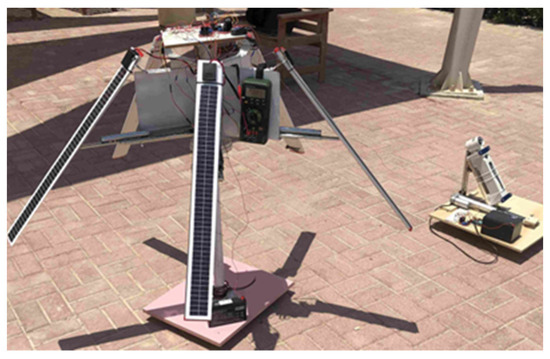
Figure 1.
System set-up.
A temperature sensor was attached to the surface of the PV module to record the PV temperature, and the 5 DC geared motors were needed to push the PV modules to a specific tilt angle. The tilt angle used in this study varied between 75° and 55°, with a decrement of 5°. A multimeter was used to measure the VOC and ISC at each tilt angle. Furthermore, a Solmetric sensor was used to measure the solar irradiation at each tilt angle at different azimuth angles, starting from 0°, which represents the true south, going west with an increment of 45°. The Solmetric sensor was attached to a vertical slider, which was connected to a linear actuator, with a 12 V battery, all fitted on a wooden plate. The linear actuator was used to vary the tilt angle of the sensor, while the azimuth angle was varied using a DC motor located under the wooden plate to rotate the whole system to the required azimuth angle.
2.2. Modeling Using a Single PV Module
The study conducted on a single PV module involved modeling different parameters, such as temperature, irradiation, tilt angle, azimuth angle, and time. Each parameter was recorded independently from the others. The module temperature was modeled by observing the VOC and ISC at fixed tilt and azimuth angles while heating the PV module using a hot air blower. The tilt angle was modeled by fixing the other parameters while changing the module’s tilt angle after stabilization and recording the VOC and ISC at those angles. The azimuth angle was modeled by rotating the PV module at a fixed tilt angle, starting from 0° as a compass south and going west with an increment of 24° while measuring the VOC and ISC at each azimuth angle. Solar irradiation was modeled by recording the solar irradiation at different tilt angles and measuring the VOC and ISC at each point of solar irradiation. Lastly, time was modeled between 10:00 and 15:00, with an increment of 15 min, while the module was facing south at a fixed tilt angle, and new values of VOC and ISC were recorded for each increment.
3. Measurement
3.1. Solar Irradiation Measurement
The measurements were taken at Abu Dhabi University at different times (around noon time) using a Sol Sensor from Solmetric to obtain the irradiation in W/m2. Referring to Figure 2 below, which represents sample data for a given day via a plot of solar irradiation against the cardinal direction, the solar insulation was higher when the module was mounted to the south going west and the tilt angle was 55°; with a tilted module, we can expect that the solar radiation will be normal or close to normal on the module surface.
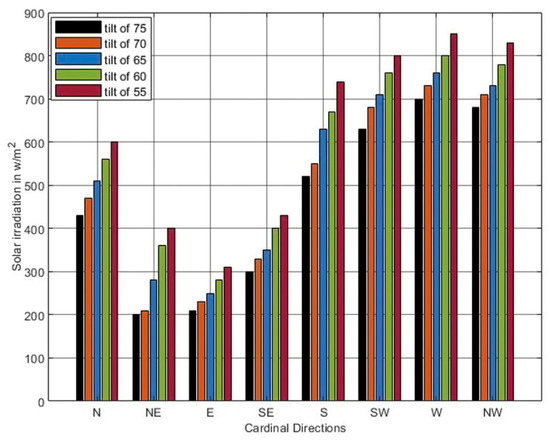
Figure 2.
Measured solar irradiation (16 May 2023, 1:30 p.m.).
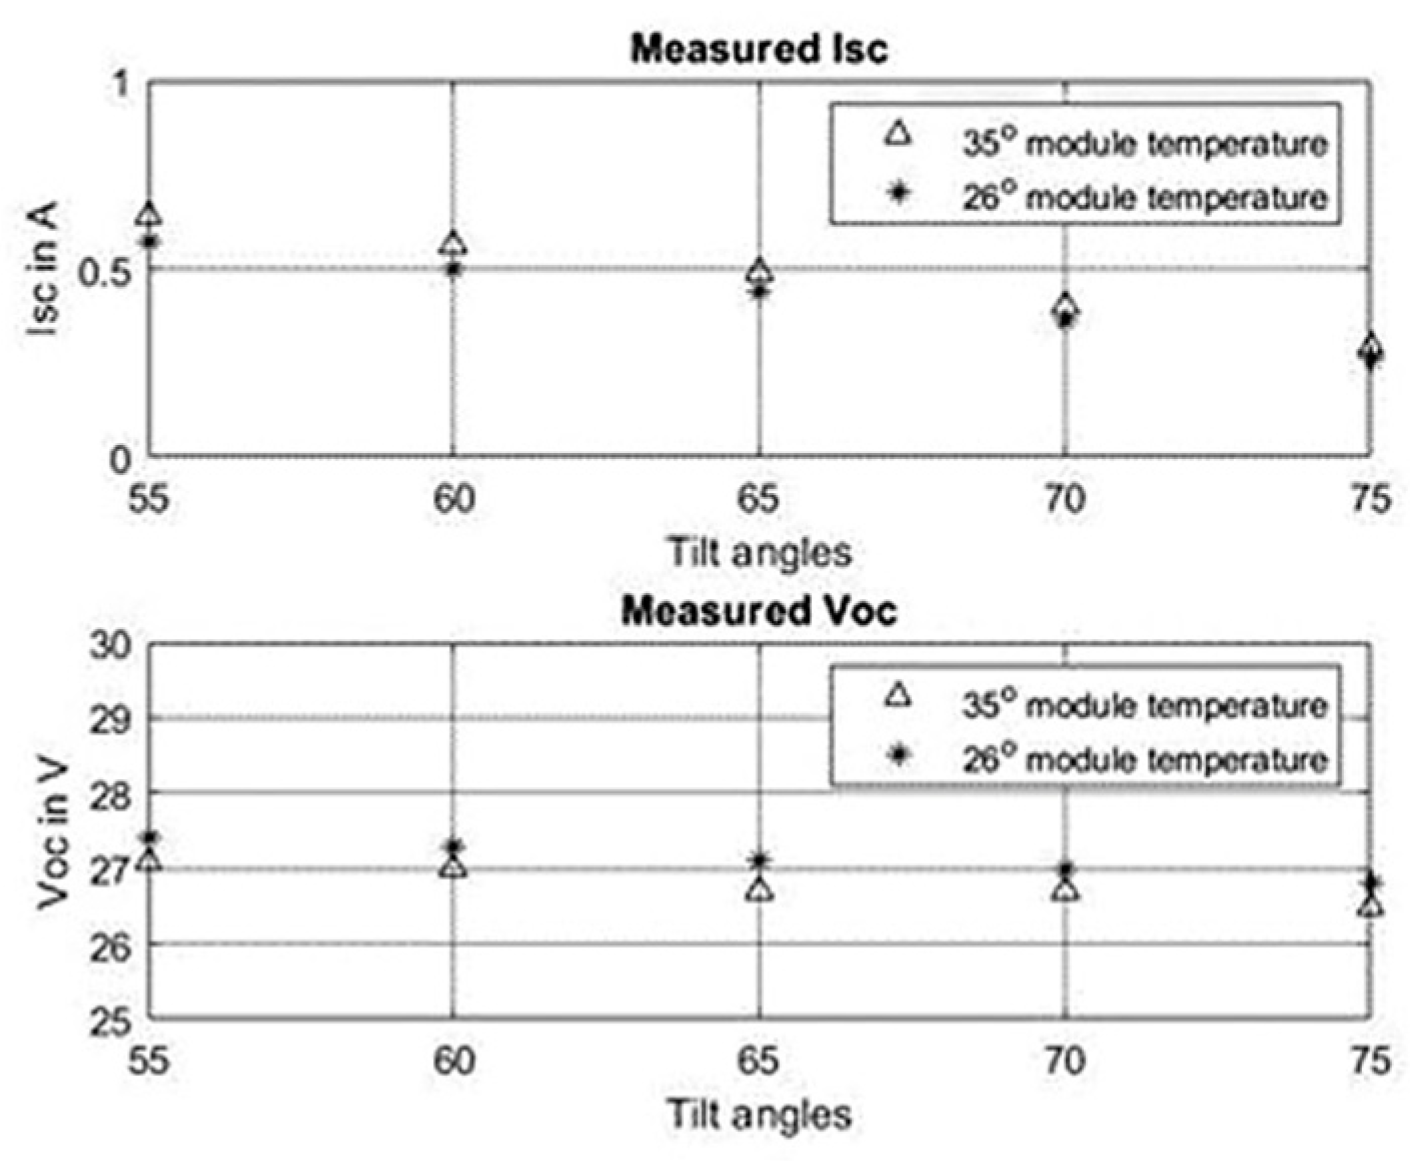
3.2. Measuring the VOC and ISC of the Whole System
The PV modules used in this system were attached to the blades of a wind turbine and connected in parallel. Figure 3 represents the measured ISC and VOC values for each tilt angle at two different module temperatures. We can conclude that as the tilt angle decreased, the ISC of the module increased, while the VOC slightly increased; as a result, the power output increased. These results agree with the information in Figure 1, as when more solar irradiation is received, the higher the generated current is. Also, as the module temperature increased, the VOC decreased, while the ISC increased slightly.

Figure 3.
Measured VOC and ISC at two module temperatures.
4. Results and Discussion
Modeling such a system is challenging as there is more than one factor influencing the output power to consider; therefore, the idea is to take one module of the system and model the output from it with each factor independently, i.e., as each factor is taken, while the others are constants. The models suggested in this document model VOC and ISC with module temperature, solar irradiation, tilt angle, azimuth angle, and the time of day.
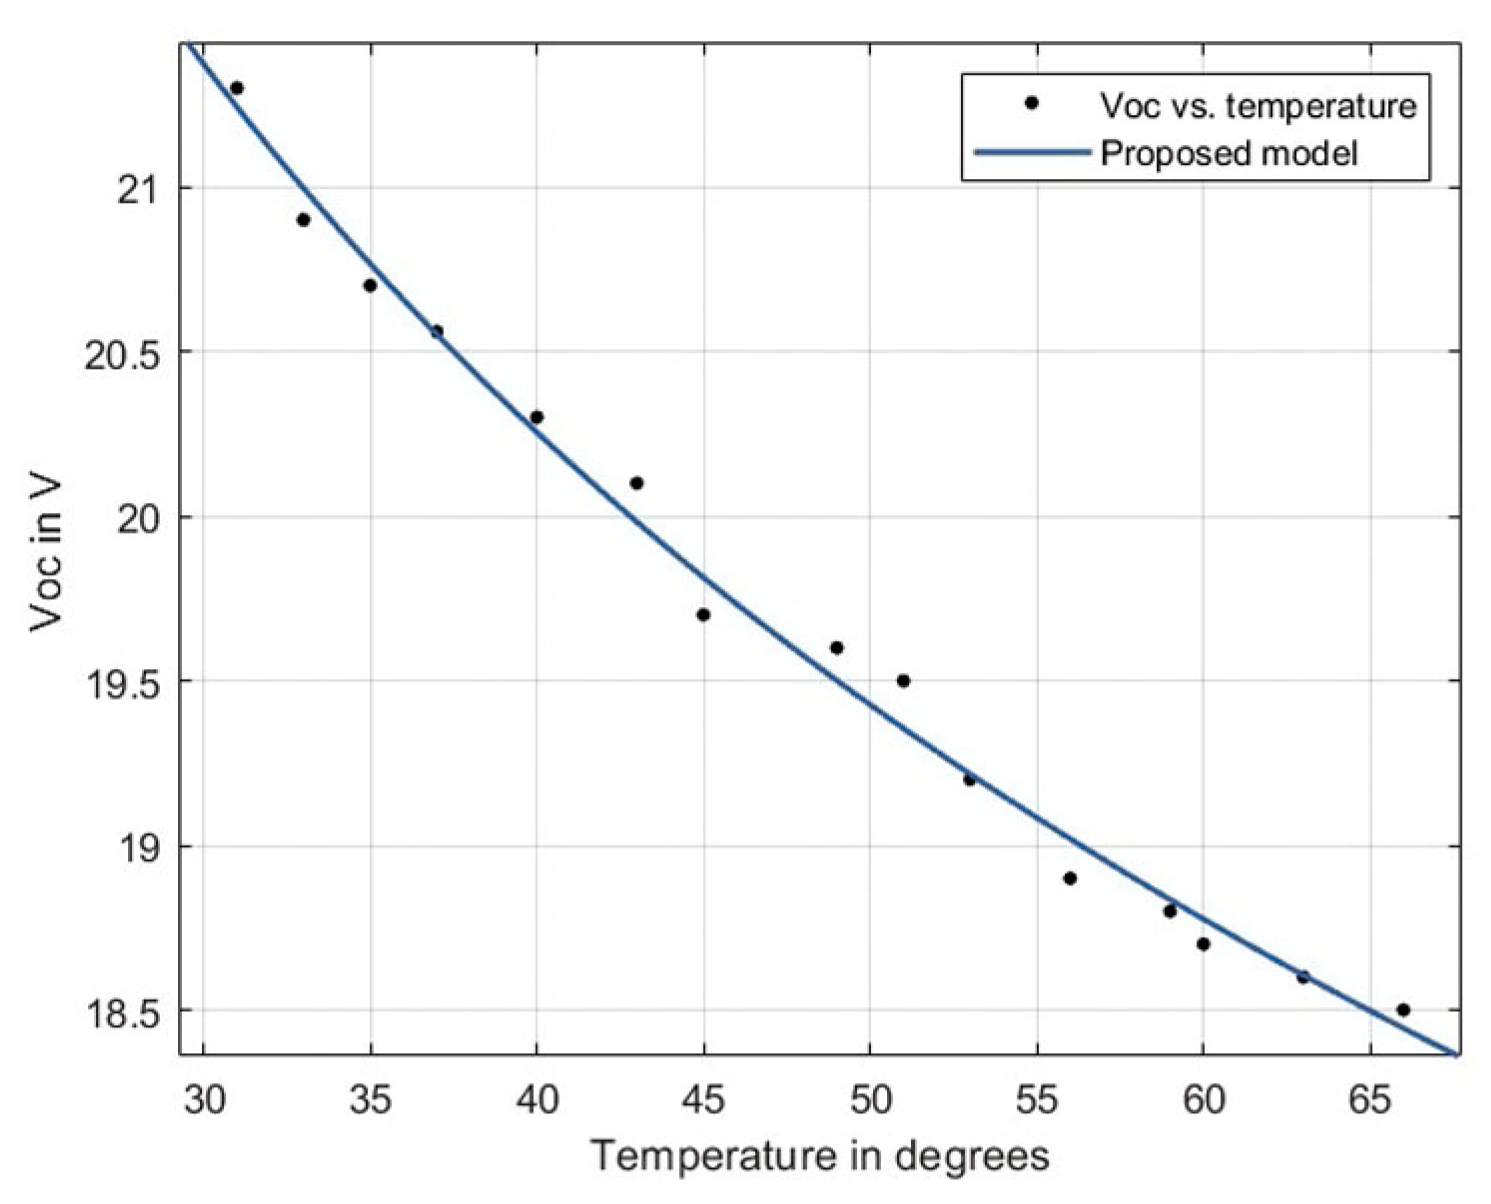
4.1. Modeling VOC and ISC with PV Temperature
The open-circuit voltage (VOC) and short-circuit current () of a photovoltaic (PV) module are influenced by the temperature of the PV module. A PV module’s VOC decreases as the temperature increases. The temperature coefficient of VOC, which is normally provided by the manufacturer of the PV module, can be used to describe this relationship. In this study, the temperature coefficient is not given; the VOC and ISC measured against the module temperature at fixed solar irradiation (750 W/m2) and a tilt angle of 60°, where the PV was facing south, is used to describe the relationship between them, as well as the increase in module temperature measured using a hot air blower, to raise the module temperature to high values. The measurements were taken on Monday 26th of June at 14:00. As shown in Figure 4, the model can be described using Equation (1).
where is module temperature in degrees, and is module temperature under STC conditions.

Figure 4.
VOC against module temperature.
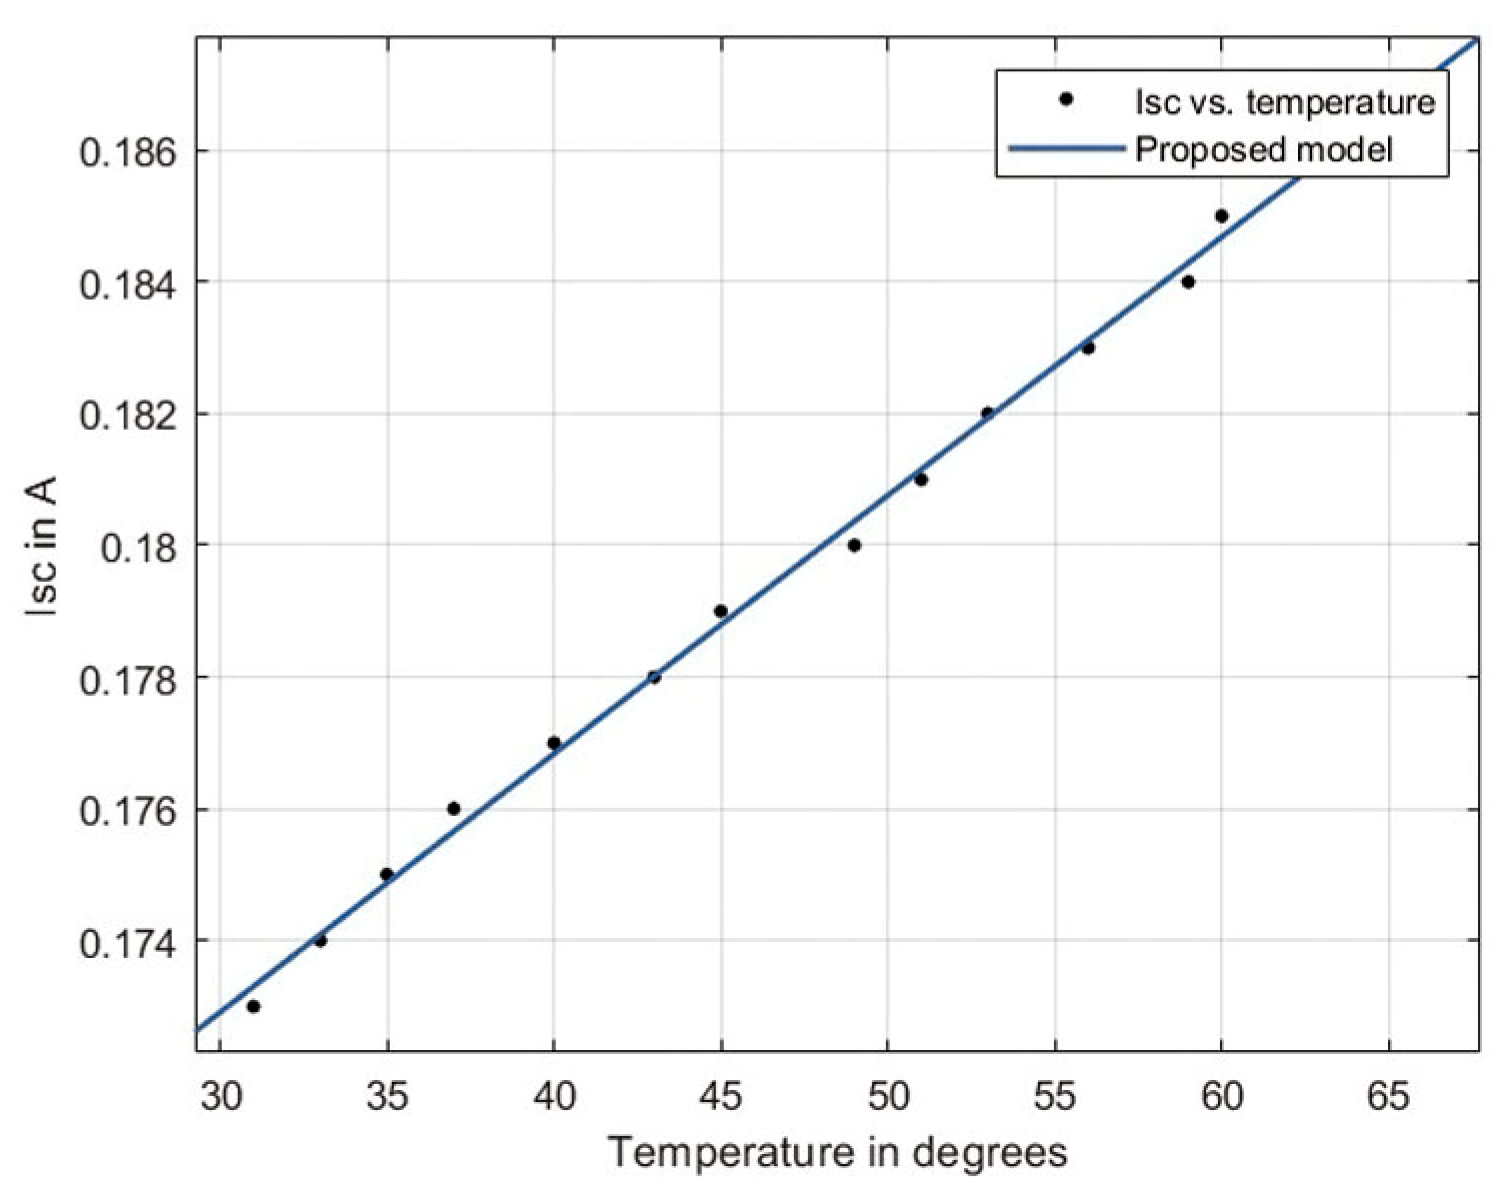
The short-circuit current () of a PV module generally increases with increasing temperature. Figure 5 shows the relationship between and module temperature, and it can be described using Equation (2).
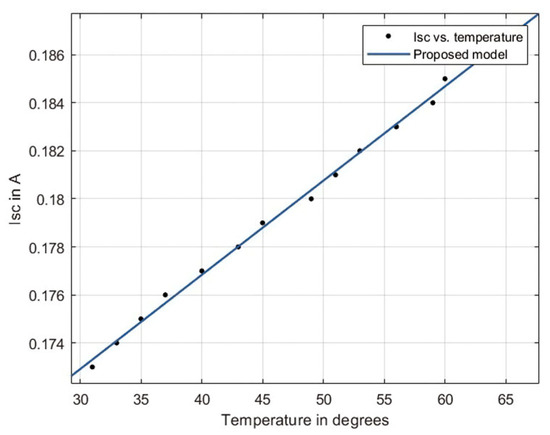
Figure 5.
ISC against module temperature.
In Figure 4 and Figure 5, the data show a logarithmic decrease in the VOC as the PV surface temperature increased; however, this was not the case for the current, as the results showed a linear increase in the current as the PV surface temperature increased. The level of the decrease in the VOC is higher than the level of the increase in the ISC, which results in a total power reduction.
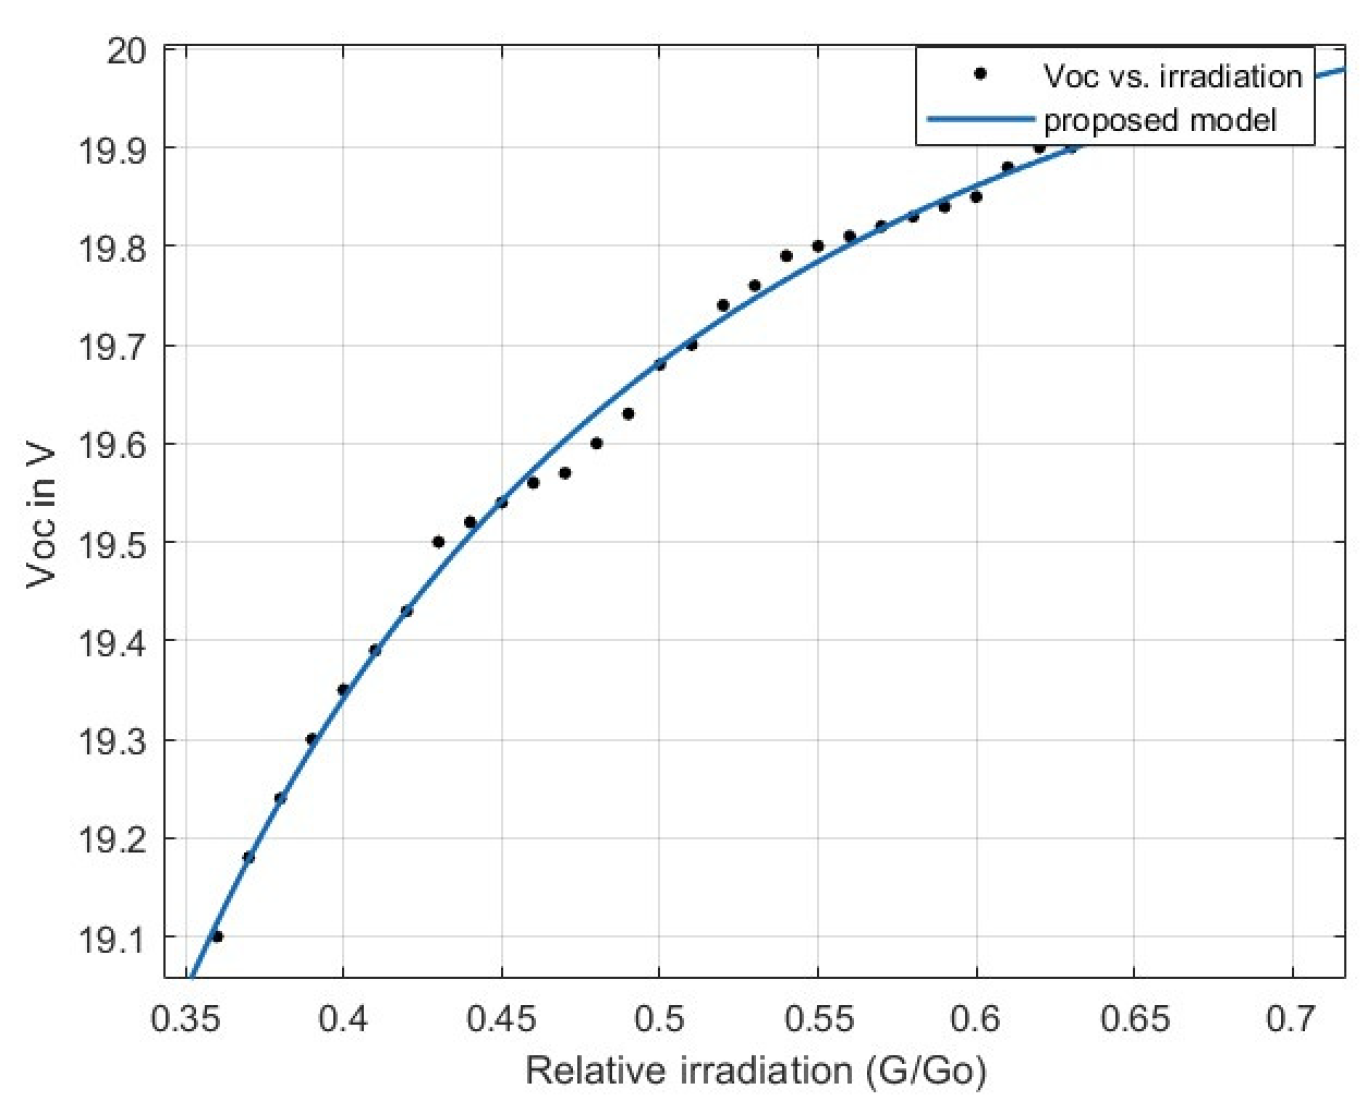
4.2. Modeling VOC and ISC with Solar Irradiation
VOC can vary slightly with changing irradiance levels; this effect is relatively small compared to other factors such as temperature. In most practical situations, changes in solar irradiation have a minimal impact on VOC. Figure 6 illustrates the effect of changing solar irradiation by varying the module tilt angle on the module’s VOC. These measurements were taken on Tuesday 27 June 2023 at noon time; the module was facing south, and the change in tilt angle was used to vary the solar irradiation at an almost fixed temperature.
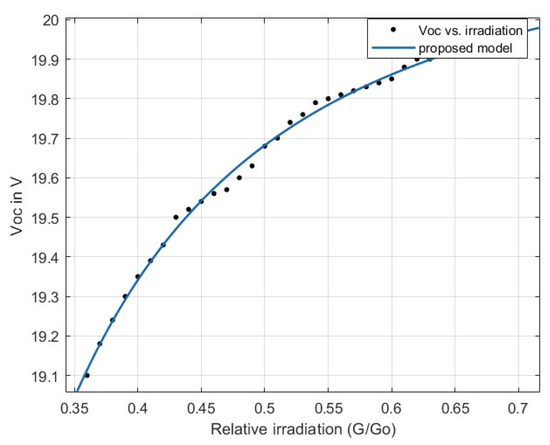
Figure 6.
VOC against solar irradiation.
The model used to describe Figure 6 is shown in Equation (3).
where Go is the solar irradiation under STC conditions of 1000 W/m2.
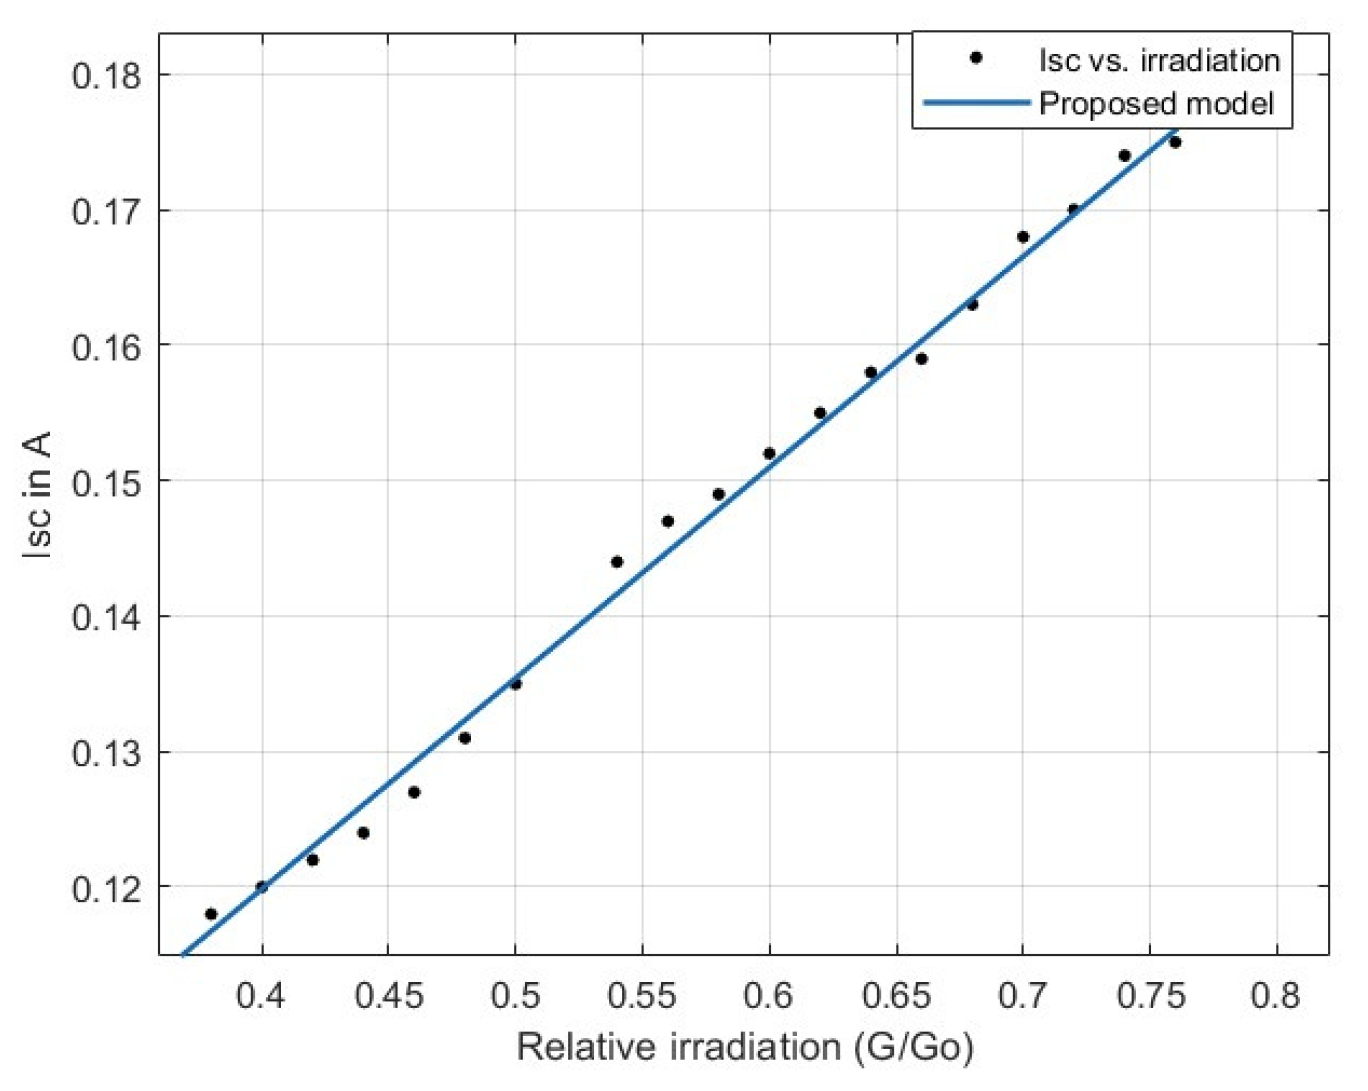
The short-circuit current (ISC) of a PV module is directly proportional to the solar irradiation. As the intensity of sunlight increases, ISC also increases. This linear relationship holds true if the PV module operates within its normal operating range. The ISC is primarily determined by the amount of light absorbed by the PV cells and the generation of electron–hole pairs. Equation (4) describes the relationship between ISC and solar irradiation (also shown in Figure 7).
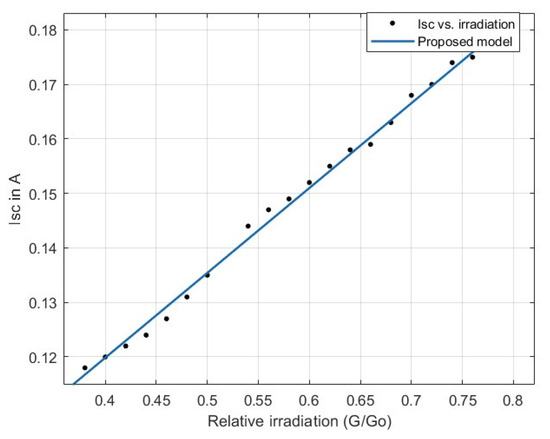
Figure 7.
ISC against solar irradiation.
4.3. Modeling VOC and ISC with the Module Tilt Angle
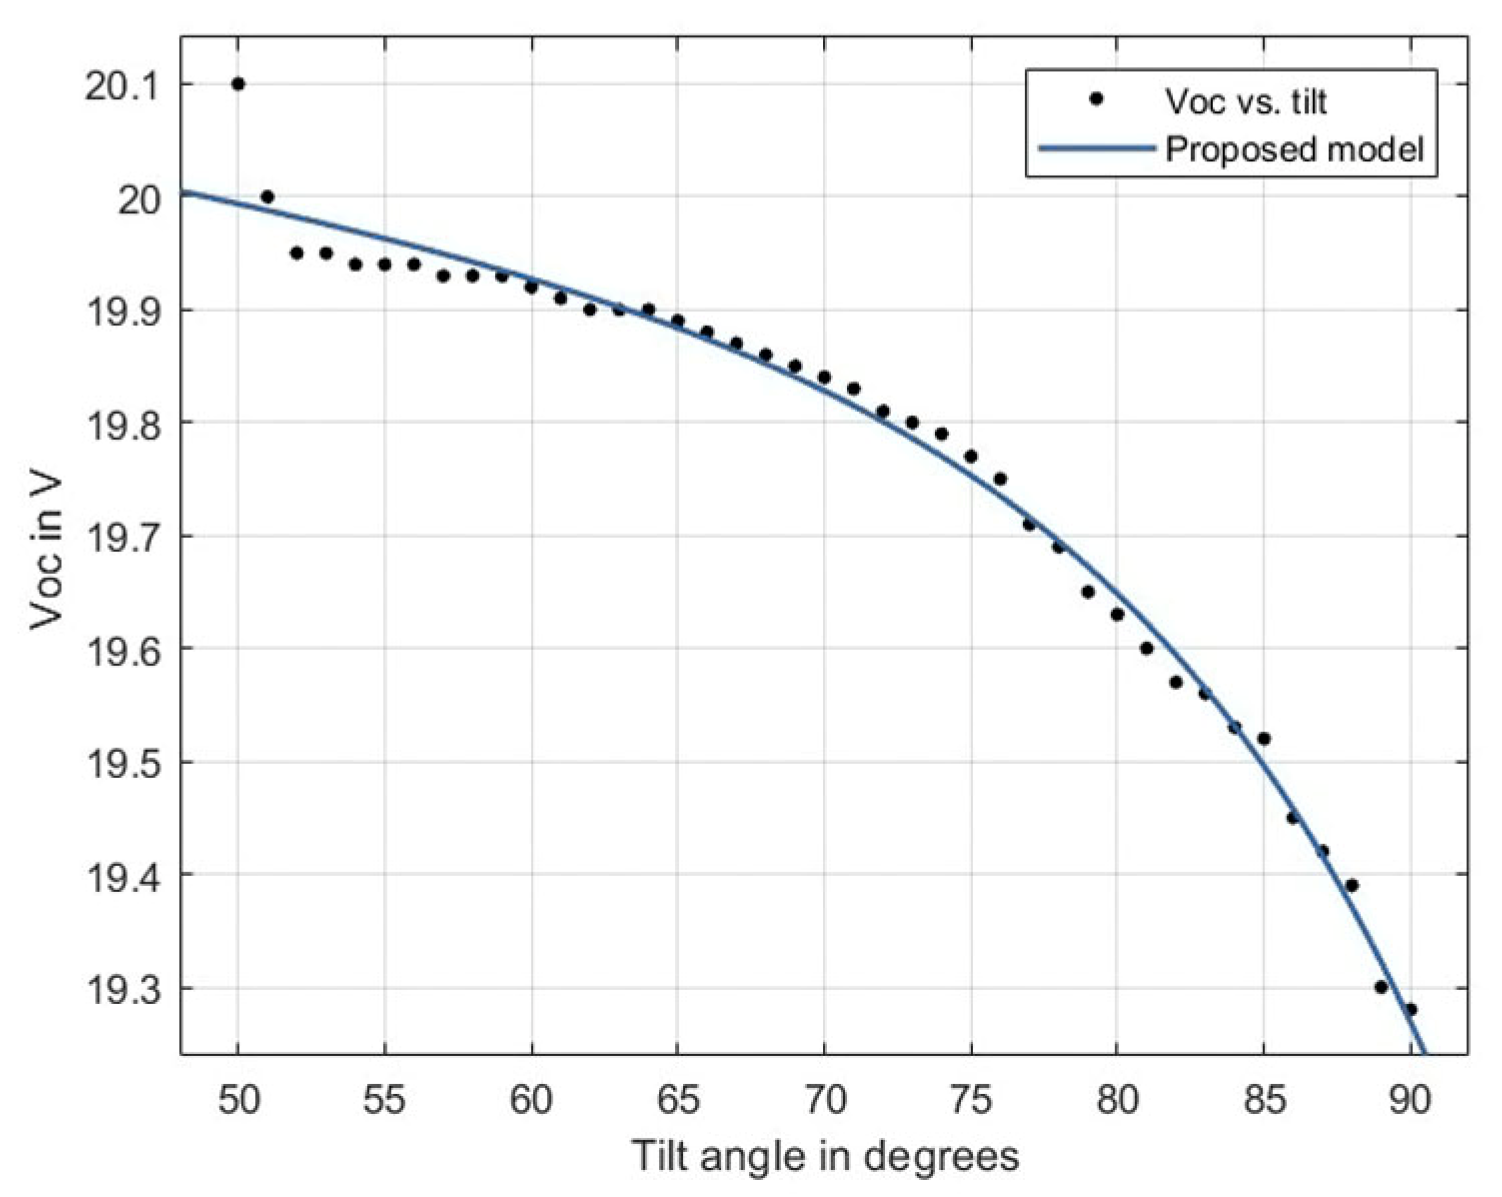
The VOC of a PV module can vary with changes in the module’s tilt angle θ. However, the effect of tilt angle on VOC is relatively small compared to other factors such as temperature, the measurements taken at fixed azimuth angles and almost fixed module temperature Figure 8 shows the relationship between VOC and the module tilt angle. These measurements were taken on Tuesday 27th of June, at noon, when the module was facing south. The model used to predict the values in Figure 8 is shown in Equation (5).
where θ is the module tilt angle in radians.
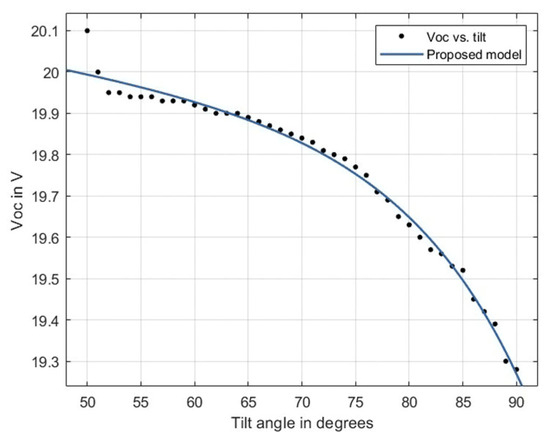
Figure 8.
VOC against module tilt angle.
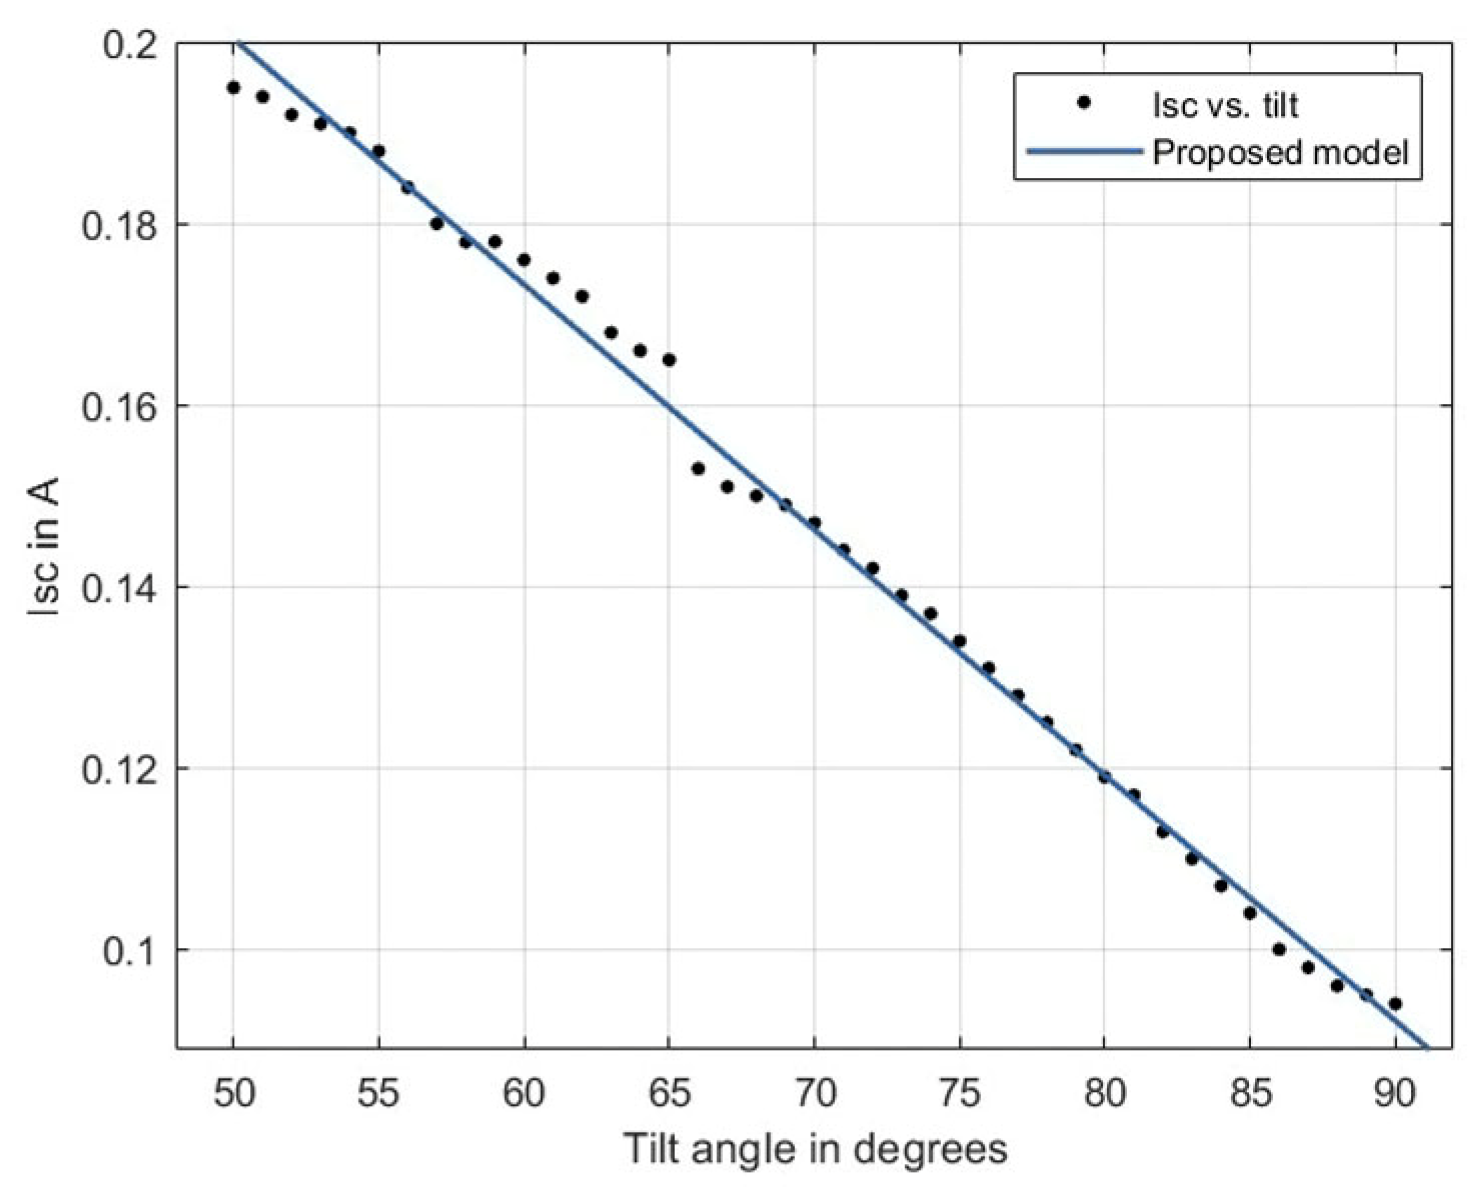
The ISC of a PV module is influenced by the module’s tilt angle. The ISC tends to increase as the module tilt angle decreases from the system default, reaching its maximum value when the incoming sunlight is perpendicular to the module. Figure 9 describes the relationship between the ISC and module tilt angle. The model used to describe Figure 9 is explained in Equation (6).

Figure 9.
ISC against module tilt angle.
The relationship between ISC and the tilt angle is linear for the window of tilt angles between 50° and 90°. However, according to [16] and Figure 7, the ISC increases as solar irradiation increases, which makes Figure 9 correct, while if the tilt angle kept decreasing beyond 50° and reached an angle of 15°, the relationship would not be linear, as the ISC would decrease.
4.4. Modeling VOC and ISC with Azimuth Angle
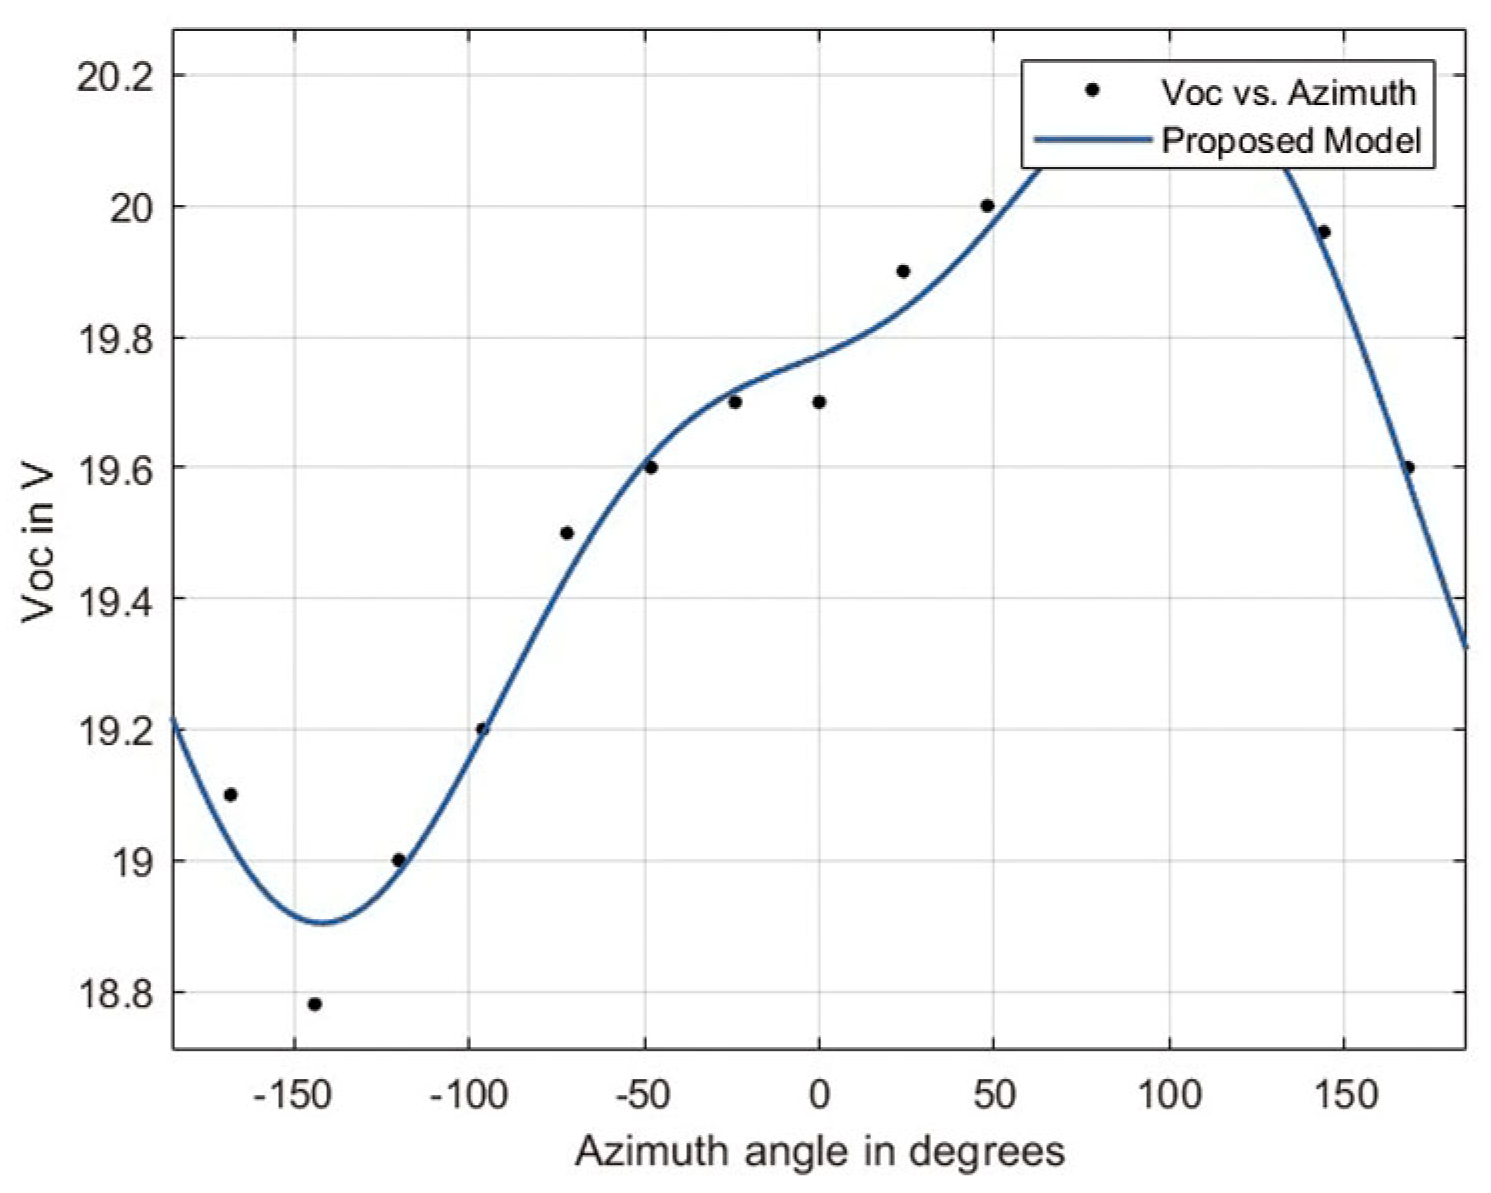
The VOC and ISC of a photovoltaic (PV) module can be influenced by the azimuth angle ϕ, which represents the orientation of the module with respect to the sun’s position. The azimuth angle determines the angle at which sunlight hits the PV module. The measurements used in this study were taken at 14:00 at a fixed tilt angle of 60° and at an almost fixed temperature. Figure 10 and Figure 11 show the variation in VOC and ISC with the module azimuth angle. The models used to describe both relationships are shown in Equations (7) and (8), in which ϕ represents the azimuth angle in radians.
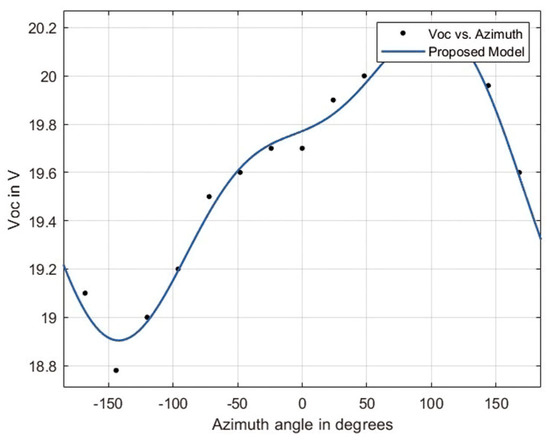
Figure 10.
VOC against module azimuth angle.
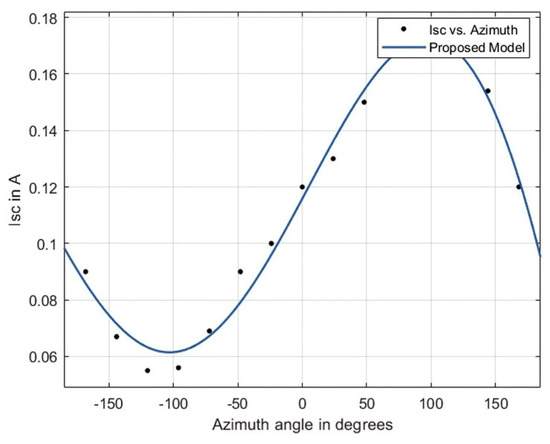
Figure 11.
Variation in the ISC against the module azimuth angle.
4.5. Modeling VOC and ISC with Time
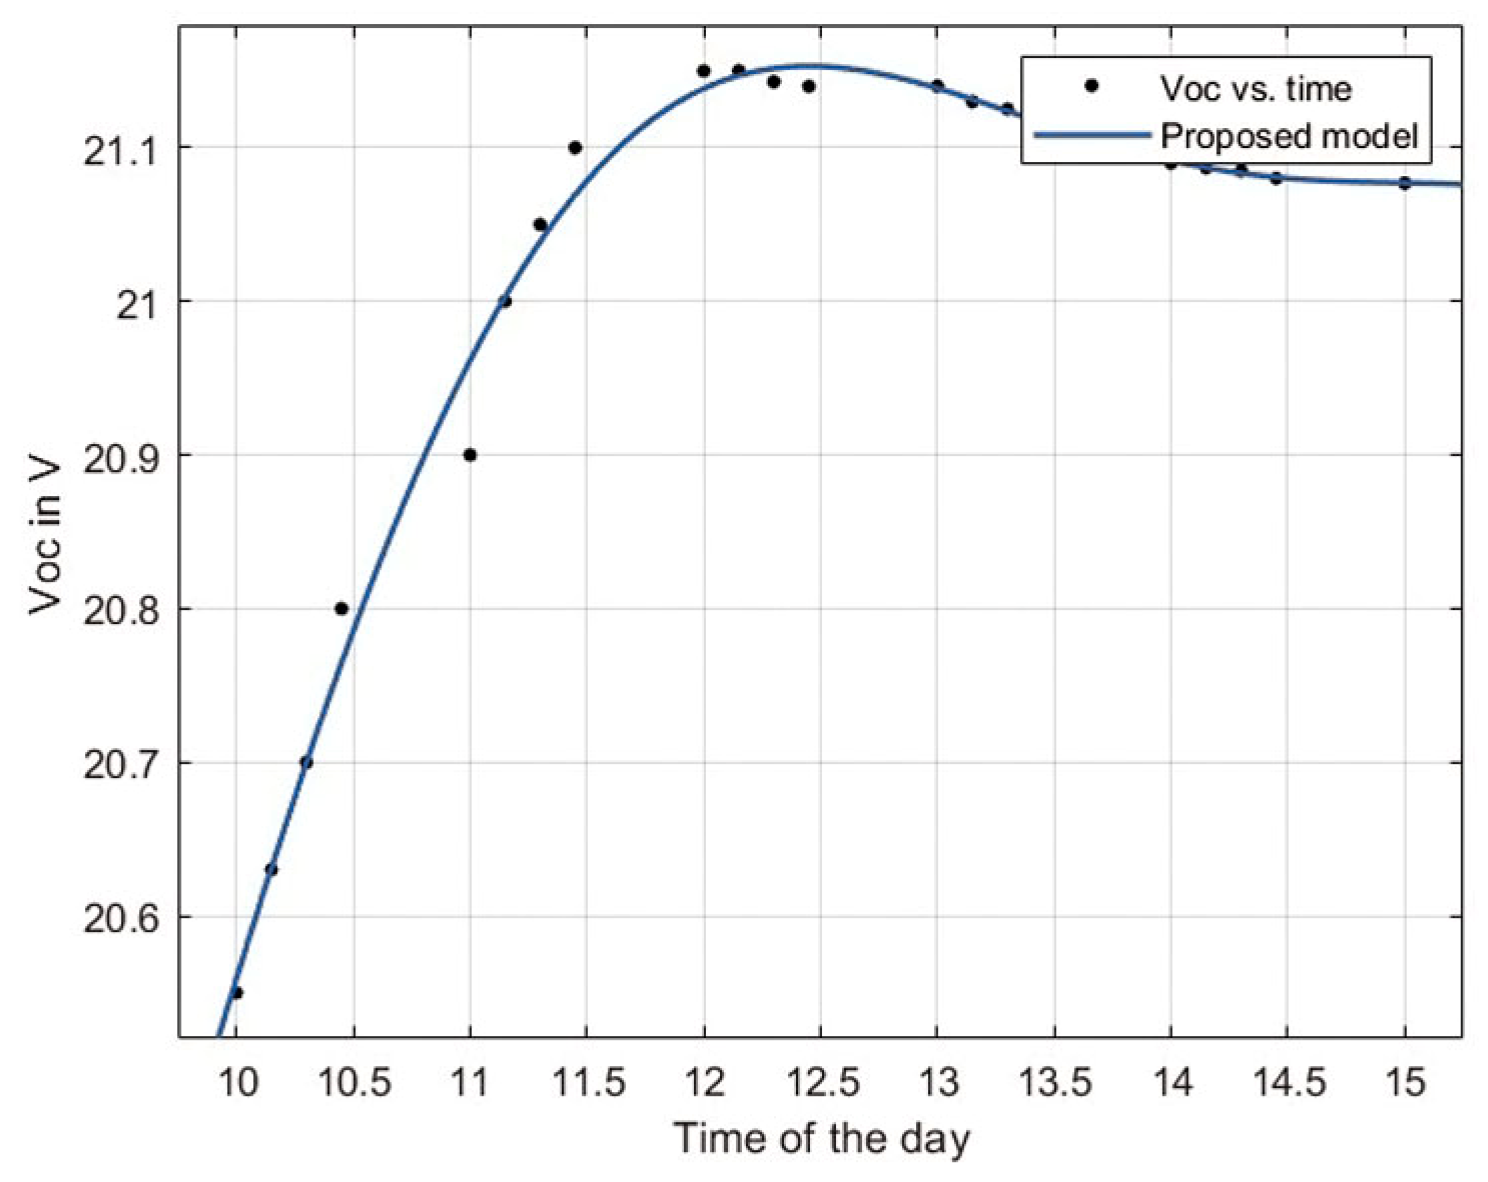
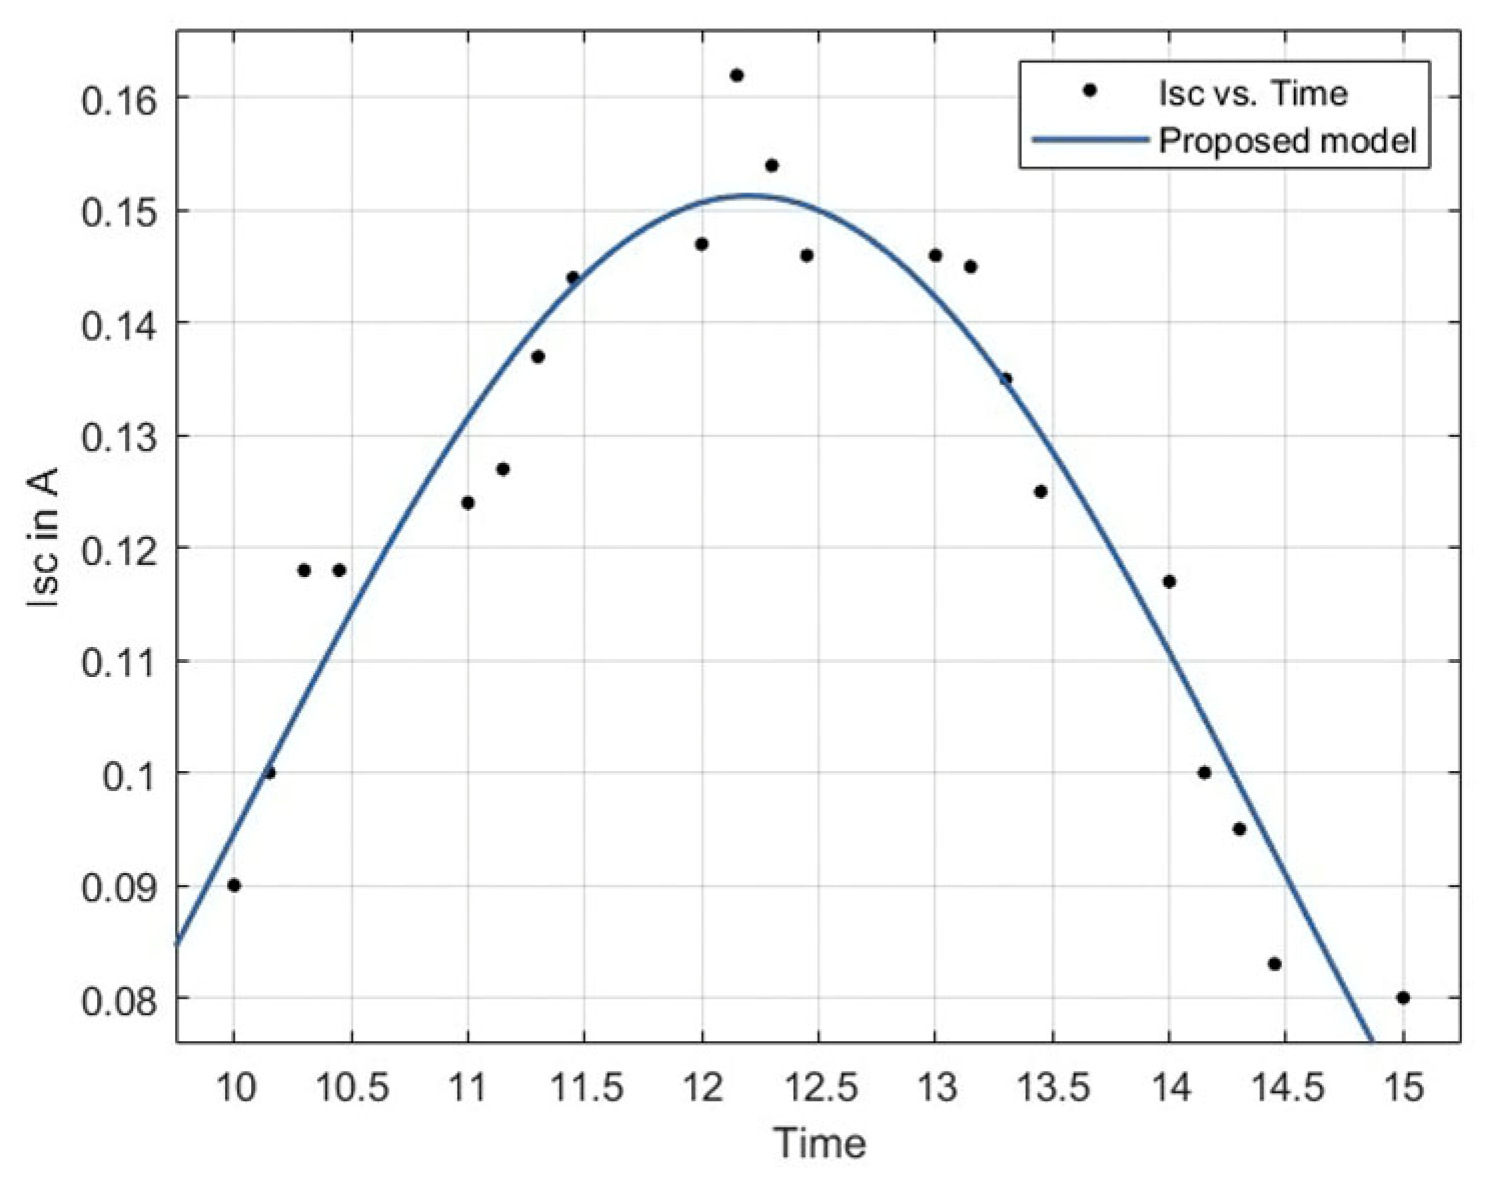
The VOC and ISC of a photovoltaic (PV) module can vary with time due to various factors, such as changes in solar irradiance and temperature. In this model, the focus is only on when the solar irradiance changes as the time changes, considering an almost fixed module temperature, a tilt angle of 60°, and the direction the module was facing (in this case, south) as the key parameters; the measurements were taken 15 min at a time from 10:00 to 15:00. Figure 12 and Figure 13 show the variation in VOC and ISC with the time of the day, and Equations (9) and (10) illustrate the models describing VOC and ISC with time, respectively.
where Time is the time of the day, and solarnoon is the noon time (12:00).
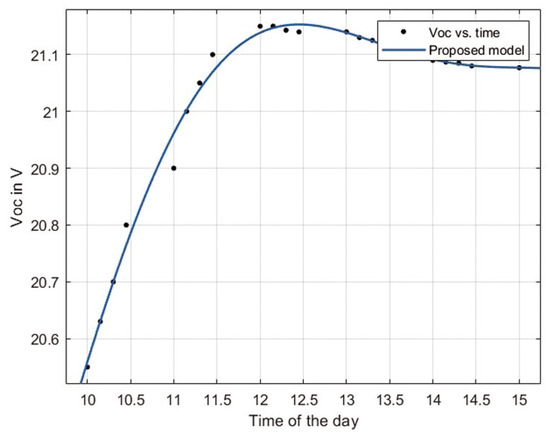
Figure 12.
VOC against the time of the day.
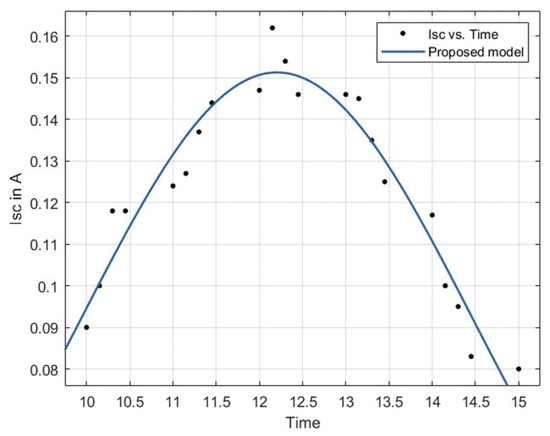
Figure 13.
ISC against the time of the day.
5. Conclusions
Solar energy harvesting using photovoltaic modules combined with an H-Darrius wind turbine is an effective and sustainable method of generating electricity. This study utilized five PV modules and took advantage of their self-cooling properties. The key factors of module temperature, tilt angle, azimuth angle, solar irradiation, and daytime were measured to model each factor independently using a single PV module. The VOC and ISC of the entire system were then measured at various tilt angles and module temperatures. This approach proved to be successful in estimating VOC and ISC with acceptable error.
To further enhance the system’s performance, it is important to consider the integration of wind turbine output. This would allow for accurate measurements of the total power generated by the system. Additionally, studying the impact of wind speed on the wind turbine’s power output, as well as monitoring the VOC and ISC of the module, would provide valuable insights for future improvements.
Author Contributions
Conceptualization, M.I. and A.A.T.; methodology, M.I. and A.A.T.; software, M.I.; validation, M.I. and A.A.T.; investigation, M.I.; data curation, M.I.; writing—original draft preparation, M.I.; supervision, A.A.T.; project administration, M.I.; funding acquisition, A.A.T. All authors have read and agreed to the published version of the manuscript.
Funding
This research was funded by the Research and Sponsored Programs Office at Abu Dhabi University, grant number 19300608.
Institutional Review Board Statement
Not applicable.
Informed Consent Statement
Not applicable.
Data Availability Statement
The raw data supporting the conclusions of this article will be made available by the authors on request.
Acknowledgments
The authors would like to acknowledge the Research and Sponsored Programs Office at Abu Dhabi University for funding this work.
Conflicts of Interest
The authors declare no conflicts of interest.
References
- Abdeen, M.O. Renewable energy resources for electricity generation in Sudan. Renew. Sustain. Energy Rev. 2007, 11, 1481–1497. [Google Scholar] [CrossRef]
- Shaopeng, G.; Qibin, L.; Jie, S.; Hongguang, J. A review on the utilization of hybrid renewable energy. Renew. Sustain. Energy Rev. 2018, 91, 1121–1147. [Google Scholar] [CrossRef]
- Qi, L.; Zhang, Y. Effects of solar photovoltaic technology on the environment in China. Environ. Sci. Pollut. Res. 2017, 24, 22133–22142. [Google Scholar] [CrossRef] [PubMed]
- Branker, K.; Pathak, M.J.M.; Pearce, J.M. A review of solar photovoltaic levelized cost of electricity. Renew. Sustain. Energy Rev. 2011, 15, 4470–4482. [Google Scholar] [CrossRef]
- Fesharaki, V.J.; Dehghani, M.; Fesharaki, J.J.; Tavasoli, H. The effect of temperature on photovoltaic cell efficiency. In Proceedings of the 1st International Conference on Emerging Trends in Energy Conservation–ETEC, Tehran, Iran, 20–21 November 2011; pp. 20–21. [Google Scholar]
- Verma, S.; Mohapatra, S.; Chowdhury, S.; Dwivedi, G. Cooling techniques of the PV module: A review. Mater. Today Proc. 2021, 38, 253–258. [Google Scholar] [CrossRef]
- Sargunanathan, S.; Elango, A.; Tharves Mohideen, S. Performance enhancement of solar photovoltaic cells using effective cooling methods: A review. Renew. Sustain. Energy Rev. 2016, 64, 382–393. [Google Scholar] [CrossRef]
- Ibrahim, H.; Anani, N. Variations of PV module parameters with irradiance and temperature. Energy Procedia 2017, 134, 276–285. [Google Scholar] [CrossRef]
- Kazem, H.A.; Chaichan, M.T. Effect of environmental variables on photovoltaic performance-based on experimental studies. Int. J. Civ. Mech. Energy Sci. (IJCMES) 2016, 2, 1–8. [Google Scholar]
- Goverde, H.; Goossens, D.; Govaerts, J.; Dubey, V.; Catthoor, F.; Baert, K.; Poortmans, J.; Driesen, J. Spatial and temporal analysis of wind effects on PV module temperature and performance. Sustain. Energy Technol. Assess. 2015, 11, 36–41. [Google Scholar] [CrossRef]
- El-Sebaii, A.A.; Al-Hazmi, F.S.; Al-Ghamdi, A.A.; Yaghmour, S.J. Global, direct and diffuse solar radiation on horizontal and tilted surfaces in Jeddah, Saudi Arabia. Appl. Energy 2010, 87, 568–576. [Google Scholar] [CrossRef]
- N’Tsoukpoe, K.E. Effect of orientation and tilt angles of solar collectors on their performance: Analysis of the relevance of general recommendations in the West and Central African context. Sci. Afr. 2022, 15, e01069. [Google Scholar] [CrossRef]
- Sharma, M.K.; Kumar, D.; Dhundhara, S.; Gaur, D.; Verma, Y.P. Optimal Tilt Angle Determination for PV Panels Using Real Time Data Acquisition. Glob. Chall. 2020, 4, 1900109. [Google Scholar] [CrossRef] [PubMed]
- Suthar, M.; Singh, G.K.; Saini, R.P. Comparison of Mathematical Models of Photo-Voltaic (PV) Module and Effect of Various Parameters on Its Performance. In Proceedings of the 2013 International Conference on Energy Efficient Technologies for Sustainability (ICEETS), Tamilnadu, India, 10–12 April 2013; pp. 1354–1359. [Google Scholar] [CrossRef]
- Nguyen, X.H.; Nguyen, M.P. Mathematical modeling of photovoltaic cell/module/arrays with tags in Matlab/Simulink. Environ. Syst. Res. 2015, 4, 1–13. [Google Scholar] [CrossRef]
- Jafarkazemi, F.; Saadabadi, S.A. Optimum tilt angle and orientation of solar surfaces in Abu Dhabi, UAE. Renew. Energy 2013, 56, 44–49. [Google Scholar] [CrossRef]


Disclaimer/Publisher’s Note: The statements, opinions and data contained in all publications are solely those of the individual author(s) and contributor(s) and not of MDPI and/or the editor(s). MDPI and/or the editor(s) disclaim responsibility for any injury to people or property resulting from any ideas, methods, instructions or products referred to in the content. |
© 2024 by the authors. Licensee MDPI, Basel, Switzerland. This article is an open access article distributed under the terms and conditions of the Creative Commons Attribution (CC BY) license (https://creativecommons.org/licenses/by/4.0/).