Abstract
Robot vision, enabled by deep learning breakthroughs, is gaining momentum in the industry 4.0 digitization process. The present investigation describes a robotic grasp detection application that makes use of a two-finger gripper and an RGB-D camera linked to a collaborative robot. The visual recognition system, which is integrated with edge computing units, conducts image recognition for faulty items and calculates the position of the robot arm. Identifying deformities in object photos, training and testing the images with a modified version of the You Only Look Once (YOLO) method, and establishing defect borders are all part of the process. Signals are subsequently sent to the robotic manipulator to remove the faulty components. The adopted technique used in this system is trained on custom data and has demonstrated a high accuracy and low latency performance as it reached a detection accuracy of 96% with 96.6% correct grasp accuracy.
1. Introduction
Industry 4.0, also known as the Fourth Industrial Revolution, is a conceptual framework that is redefining the way industries operate, manufacture, and interact with the global economy. It emerges as a response to the growing need for greater efficiency, flexibility, and sustainability in manufacturing. In essence, Industry 4.0 means the integration of cyber-physical systems, the Internet of Things (IoT), Cloud Computing (CC), and Artificial Intelligence (AI) into the fabric of industrial operations [1]. The impact of this transformation is spreading throughout the manufacturing sector, impacting many aspects of production. It fosters a dynamic, connected ecosystem where machines, devices, and processes communicate seamlessly, enabling real-time data analysis and decision-making [2]. The tangible outcomes of Industry 4.0 include increased productivity, reduced production costs, improved product quality, and reduced time to market. Additionally, manufacturers will be able to respond more quickly to market fluctuations and customer demands, redefining the competitive landscape. Furthermore, in industrial production, the quality of manufactured things is critical to achieving client satisfaction. As a result, the procedure of quality control over created components should be followed before they reach their final destinations on the market. The procedure should begin on the production lines to allow for early detection of defects and deficiencies, utilizing emerging vision assessment technology to further improve the rhythm of production with quality satisfaction. Vision sensors are widely utilized to address such concerns nowadays; however, inspection quality still must be improved [3]. With that aim, we are combining deep learning with sensing cameras to create a monitoring application that enables the early detection of faulty manufactured objects on the manufacturing line using newly developed methodologies. Many works have been interested in adopting AI in industrial vision applications. The work carried out in [4] provides a methodology to recognize the class of an object while estimating its 6D pose with RGB-D data. Specifically, the proposed model adopts a global approach, first recognizing an object and the region of interest (ROI) from RGB images. The pose of the feature is then estimated using relative depth information. Several works have focused on adopting robotic arms to induce many benefits in different applications. For instance, the authors of [5] have proposed a robotic grasping system for automatically sorting garbage based on machine vision in complex backgrounds. To achieve the accurate grabbing of the target object, they adopted a deep learning scheme interested in the Region Proposal Generation and the VGG-16 model for object recognition and pose estimation. The machine vision system sends the information about the geometric center coordinates and the angle of the long side of the target object to the manipulator which completes the classification and grabbing of the target object.
The vision methods were also adopted for industrial welding applications. Vision-aided robotic welding has been applied in the industrial field for decades for the procedures of vision-aided robotic welding. Various methods in vision sensor calibration and hand–eye calibration have been illustrated. For example, the authors of [6] have presented a simple and robust hand–eye calibration strategy that requires minimal user interaction and makes use of a single planar calibration artifact. A simulation approach is used to further investigate and optimize the impact of robot position on the calibration process, and the resulting optimal robot positions are then experimentally validated for a real robot-mounted laser line sensor. Using the proposed optimal method, a semi-automatic calibration process, which requires only four manually scanned lines, is defined, and experimentally demonstrated.
On the other hand, robots have experienced an important evolution to deal with applications within fruit and vegetable harvesting. Using different end-effectors, acceptable results have been reached for apples, tomatoes, sweet peppers, and cucumbers [7]. However, the performances of the used final effectors (harvesting speed, success rate, costs, etc.) compared with the performances of human operators have shown less efficiency than human operators in the harvesting processes [8]. The authors of [9] have combined an advanced RGB-D camera and DL policies with a robot arm for the assembly of mobile phone items. This system exploits a modified version of the YOLO (You Only Look Once) scheme to arbitrarily detect the pieces in industrial working space. To make the UR5 robot plan and execute its movement intelligently without any human operator training, the authors of [10] used a stereo vision camera and DL Faster-RCNN for object classification and recognition. A series of investigations have been devoted to enhancing industrial manufacturing quality and efficiency, relying on vision inspection and emerging DL methods [11]. T.P. Nguyen et al. have proposed a smart industrial vision inspecting system based on CNN to detect product defects like blow holes, chipping, and cracks [12].
An approach based on learning eye–hand coordination for robotic grasping from monocular images was proposed in [13], to learn hand–eye coordination for grasping. A large CNN model was trained to predict the probability of the gripper movement which resulted in successful grasps. Another autonomous rock-stacking method dedicated to construction in an indoor environment using a robot arm was investigated in [14]. This method employs gradient descent with random initial orientation to detect randomly placed objects in a stacking scene. Therefore, in every industrial manufacturing scenario, ensuring excellent quality of manufactured commodities is essential. Early detection of product flaws is critical in quality control in manufacturing to better meet client needs. As a result, in this work, we examined the performance of YOLOv5 for defect inspection in our custom data. Then, the system is linked to a UR5 robot arm related to an RGB-D camera application.
The remainder of this paper is structured as follows. In Section 2, we summarize the proposed system application. Then, the YOLOv5 algorithm is described in Section 3. A description and annotation of the dataset used are depicted in Section 4 and the performance assessment metrics are discussed in this section. We comment on and discuss the obtained results in Section 5. Finally, we provide the conclusion in Section 6.
2. The Proposed System Architecture
This section provides an overview of the overall application system, as depicted in Figure 1. The intelligent grasping system comprises three principal components: a robotic arm equipped with an integrated two-finger gripper for item manipulation, an RGB-D camera affixed to the arm for data acquisition, and an industrial conveyor belt for the transportation of manufactured items. The central element of this developed application is the collaborative UR5 robot. Due to its inherent capabilities, this robot serves as an asset for assisting human operators in assembly or inspection tasks. It possesses a 6-degree-of-freedom (6-DOF) configuration, accompanied by a control box and a user-friendly programming interface tailored for light assembly duties and automated workbench scenarios. Additionally, it is equipped with a two-finger gripper capable of handling objects weighing up to 5 kg, featuring a total pivotal motion range of 360 degrees. The RGB-D camera in this context fulfills a dual purpose. RGB images are utilized as data inputs, subject to processing within the processing units, aimed at feature extraction and the classification of regions of interest (ROIs) for the detection of any defective areas. Simultaneously, the depth component, utilizing grayscale annotations, serves to estimate pose points for coordinating the 6D robot arm’s position. On the depth image, the X, Y, and Z coordinates are delineated on the corresponding side of the ROI. Depth information is derived from RGB images, enhancing pose estimation capabilities. To optimize system efficiency and practicality, we place a significant emphasis on decentralizing processing units, relocating the processing tasks to Edge units to enhance the localization and recognition of monitored data. Specifically, the proposed YOLOv5 model is designed to facilitate real-time data processing in the Edge unit, thereby improving the system’s overall performance.
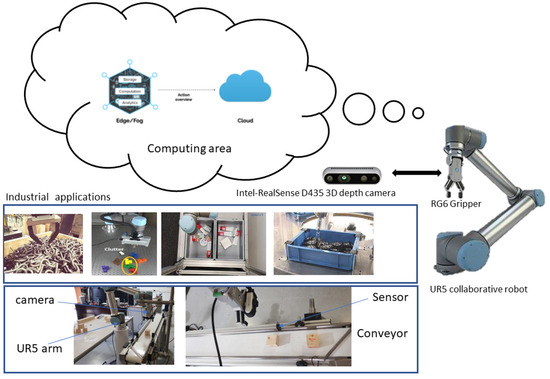
Figure 1.
The proposed system architecture.
3. You Only Look Once Algorithm
YOLOv5 [15] is an object detection model built on CNN. In a single forward pass, the YOLOv5 model takes an image as an input and outputs the bounding boxes and class probabilities for all objects detected in the image. YOLOv5 has several improvements over previous versions, including a smaller model size, faster inference speed, and improved accuracy. It employs an innovative architecture that combines a CSP (Cross Stage Partial) backbone with an SPP (Spatial Pyramid Pooling) head, as well as other optimization techniques like multi-scale training and hyper-parameter optimization. YOLOv5 has achieved cutting-edge performance on several object detection benchmarks, including COCO and Open Images, and is widely used in industry and academia for a variety of computer vision applications. Figure 2 illustrates the YOLOv5 architecture’s four basic components: the input, the backbone, the neck, and the output. The input block primarily contains data pre-processing, such as mosaic data augmentation and adaptive image filling. YOLOv5 integrates adaptive anchor structure calculations into the input to adapt to different datasets, making it possible to instantaneously set the initial anchor frame size whenever the dataset changes.
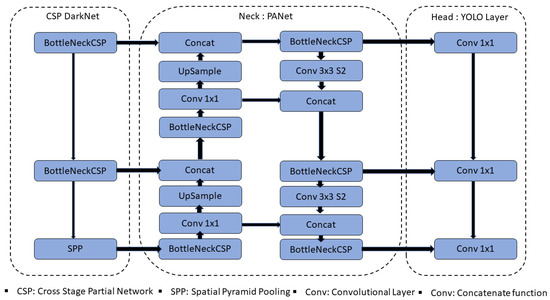
Figure 2.
Yolov5 basic architecture.
The backbone network primarily employs a CSP and an SPP to retrieve feature maps of varying sizes from the input image via multiple convolutions and pooling. The bottleneck CSP structure serves to lower computation and increase inference speed, whereas the SPP structure realizes feature extraction from multiple scales for the same feature map and can generate three-scale feature maps, which improves detection accuracy.
The neck network employs the FPN and PAN pyramid topologies. The FPN structure communicates contextual information characteristics from top to bottom feature maps. At the same time, the PAN structure transmits strong localization features from lower to higher feature maps. The above two structures collaborate to boost detection capabilities by fortifying features gathered from distinct network levels in backbone fusion. Finally, the head output is primarily used as a final detection step to predict targets of various sizes on feature maps.
4. Data-Set Collection and Annotation
4.1. Dataset
To investigate the performance of the YOLOv5 model for our application, we collected a custom dataset comprising both defective and non-defective coils. This dataset was categorized into two distinct classes. Seventy percent of the data was allocated for training, while the remaining 30% was designated for testing. To be precise, the dataset comprises a total of approximately 1294 images, encompassing both “OK” and “Non-OK” pieces. These images were acquired using an RGB camera, capturing the object under study, primarily a metal part, from various angles. Additionally, the influence of lighting conditions on image quality and object characteristics was considered. We conducted image capturing under five different lighting setups: one from the top and four from different positions, each focusing on centralizing the object. To accommodate the input requirements of the deep learning model, we adjusted the image size during the training process. It is important to note that, to mimic real-world conveyor applications, the distance between the camera and the pieces varied along the vertical axis in the captured images. For the generation of the dataset, we classified the data into two classes: non-defective coils and defective ones. The definition of an ideal piece for production involves a green spool with 12 yellow coils. Consequently, any deviation from these specifications is categorized as a defective piece. Defective pieces are identified if they contain either more or fewer than 12 coils, or if the coils and spools exhibit different colors. Our simulation and testing procedures commenced with the training of the network, initially using a learning rate of 0.001 for 100 epochs. Subsequently, we continued training for an additional 40 epochs with a reduced learning rate of 0.0001. In Figure 3, we present sample images of faulty coils (Non-Ok) and non-defective coils (Ok) from our training and test dataset used in our simulation. These images serve to highlight the uniqueness and distinct characteristics of each piece within our dataset.
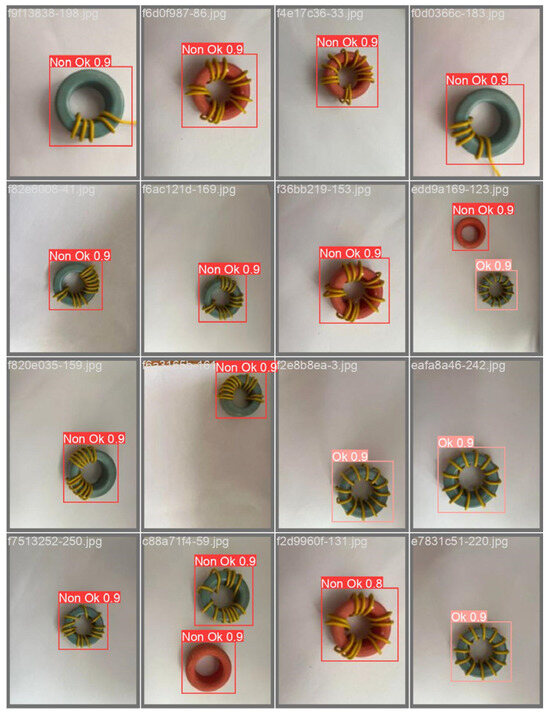
Figure 3.
Training batches for defective and non-defective pieces.
4.2. Machine Learning Metric Measurements
During the YOLOv5 algorithm evaluation process, we used accuracy as the mean measurement; the detection model’s evaluation indicators are precision (P), recall (R), and F1 score. True Positives (TP), False Positives (FP), True Negatives (TN), and False Negatives (FN) are also discrimination values (FN). The predicted results are compared to the actual labels for evaluation purposes. If the model’s output is a correct prediction of a positive class, it is referred to as TP, and if it is a correct prediction of a negative class, it is referred to as TN. While False Positive refers to the incorrect prediction of a positive class, False Negative refers to the incorrect prediction of a negative class. On the other hand, accuracy is a performance criterion that shows the ratio of correct predictions to the total number of occurrences. Measures are also evaluated using precision and recall rates. Precision is the ratio of TP predictions to total positive predictions, and recall rate is the ratio of TP predictions to the sum of True Positive and False Negative predictions. F1 score is another measure used to report results that show the harmonic mean of recall rate and precision.
4.3. Robot Kinematics and Successful Grasp Accuracy
Time to detection is the amount of time needed to identify an object in an input image and create a plan for where to place or capture it. Given the temporal and substantive issues in the system, a real-time response must be given within the allotted time limits. In order to extract features and classify the images captured by the RGB-D camera, the employed YOLOv5 algorithm is performed on a computer that functions as an Edge Computing center. Rapid processing speed and high accuracy are two critical features of our system, so the model that meets these needs is selected as the final scheme.
The processing and robot grasping time are very important for our application as they accelerate the overall task. To measure the total time required for each cycle we calculate the time needed for the RGB-D camera to take the picture, the processing time on the edge unit, and the robot movement when required. Therefore, the total time needed for each detection cycle is:
where , , , , and are the duration of processing, the time needed for the RGB-D camera to take the picture of the piece, the required time for the UR5 to move and take the piece from the conveyor, and the time needed from the camera to estimate the pose of the piece. If, after processing, the piece is detected to be non-defective, the time required for both and is null. It should be noted that the time for the robot’s movement is adjustable and can be set as desired.
We have selected YOLOv5 for our concrete application using the UR5 robot after assessing its accuracy and simulation time. We employ a computer that acts as an interface for Edge Computing. The UR5 controlling box is linked to a platform that incorporates the YOLOv5 concept. We utilize an intermediary tool that is Python-programmed to control the movement of the UR5 robot. The system operates as shown in Figure 4. After the conveyor is turned on, the components under study move until a sensor mounted on the conveyor detects them. The sensor then signals the conveyor to stop, and the camera snaps an image, which is then sent to processing center to apply the YOLOv5. There are two ways in which the inspected piece could be defective or not when the processing runs out. When a piece is defective, the system signals the UR5 robot to move, pick it up, and place it in a designated spot. If not, the conveyor receives a signal to move and prepares to receive a new piece, at which point the cycle is repeated.
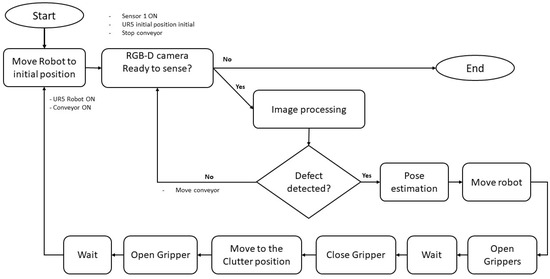
Figure 4.
Robot inspection system flowchart.
5. Results and Discussions
The experimental tests and training were carried out on the Google Colab platform. Different comparable datasets were utilized in this work for different power inductor parts with varied faults. A suitable sample size of varied faulty and non-defect components ensured the flexibility and dependability of the training results, as well as enhanced the defect detection accuracy.
5.1. YOLOv5 Defect Detection Accuracy
Figure 5 illustrates how to evaluate the YOLOv5 data by utilizing bounding boxes to identify identified items, their class labels, confidence scores, and locations inside the image. It also evaluates the algorithm’s performance using performance measures, which is essential for assessing the accuracy and reliability of the algorithm.
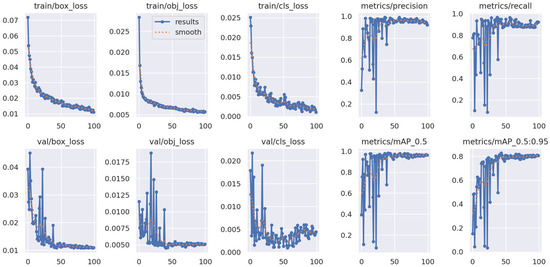
Figure 5.
Yolov5 performance over epochs.
The term train box loss shown in Figure 5 typically refers to the loss function associated with the bounding box predictions during the training of an object detection model using YOLOv5. This loss function is crucial in guiding the model to learn how to accurately predict the locations of objects within an image. As shown during training, the value decreases with an increasing number of epochs, which means that the model is learning to predict bounding box coordinates accurately and assign appropriate confidence scores. Generally, when the model’s predictions align closely with the ground truth annotations in the training data, the box loss decreases. Typically, the phrase Train obj loss refers to the object loss that occurs during the training of an object detection model. This loss function is crucial in helping the model identify the proper items in the image. Classification loss and object loss are two of this function’s main components. As is apparent, this function decrements with epochs, which is in line with the training goal. By reducing this loss, the model is better able to categorize objects inside its bounding boxes. The object loss minimizes as the model’s predictions move closer to the ground truth class labels and the object ratings in the training data.
In addition, the mAP score also shown in Figure 5 provides a summary of the model’s overall performance in terms of object detection accuracy, considering all the classes or categories of objects in our custom dataset. As shown, the metric/mAP reaches high scores near 1 at an IoU of 0.5 which indicates a better object detection performance. This also means that the model is accurate in locating and identifying objects with at least a 50% overlap with the ground truth.
Figure 6 presents the confusion matrix which is especially useful for understanding how well the model performs in terms of True Positives, False Positives, True Negatives, and False Negatives. Figure 7 depicts F1 versus confidence performance for the defective and non-defective dataset. Typically, it shows how the F1 score, a standard assessment metric for object identification, evolves as confidence levels are changed. This sort of graph provides useful information on the trade-off between accuracy and recall in an object detection model at various confidence levels. It enables us to make informed decisions regarding the trade-off between accuracy and recall, maximizing the performance of your object detection model for your unique job or application. As illustrated, the optimal F1 score is obtained with a confidence level of 0.415.
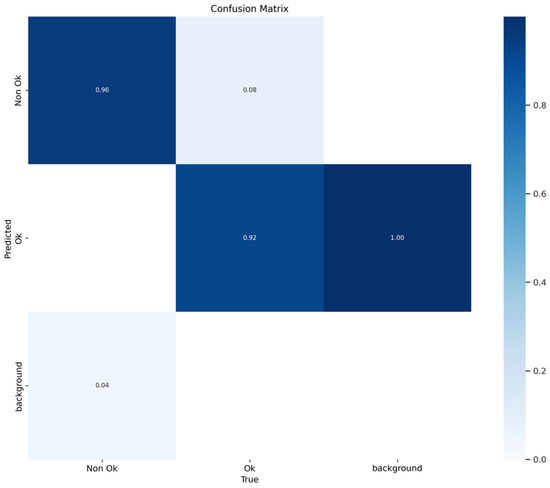
Figure 6.
Confusion matrix performance.
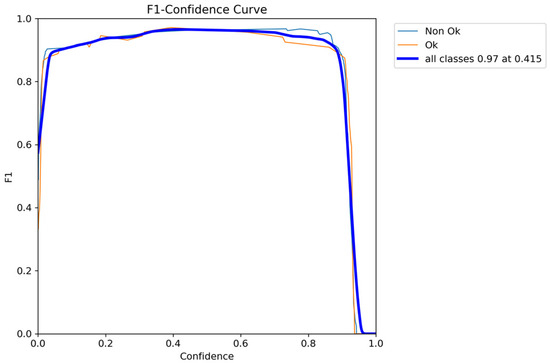
Figure 7.
F1 performance versus confidence.
Figure 8 shows how the performance curve changes for precision versus confidence. As shown, the curve typically starts high and increases until it reaches 1, at the confidence of 0.883. In addition, Figure 9 provides an insight into how well YOLOv5 balances the trade-off between precision and recall across different confidence thresholds. In YOLOv5, as in many object detection models, precision represents the accuracy of positive predictions, and recall measures the model’s ability to detect all the true positive objects.
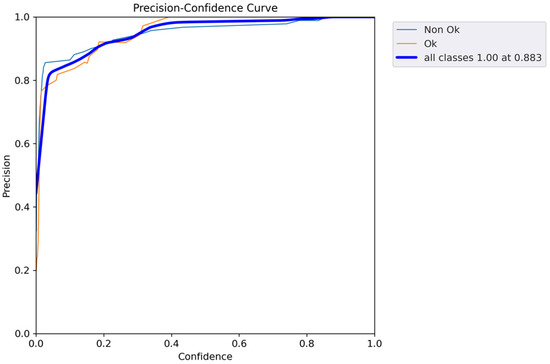
Figure 8.
Performance curve for precision versus confidence.
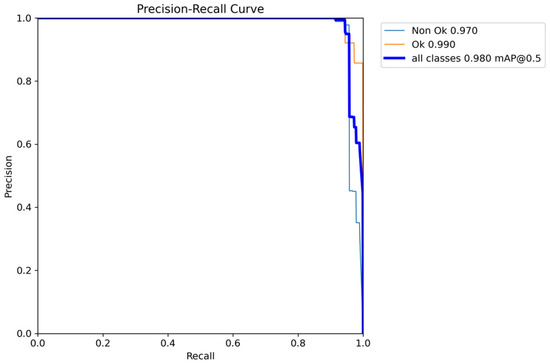
Figure 9.
Performance curve for precision recall.
Figure 10 depicts how the model’s recall rate increases at various confidence levels. It illustrates the trade-off between recall and accuracy. As illustrated, the model becomes more selective in accepting predictions as the confidence threshold increases (going from left to right on the curve). This increases accuracy (fewer false positives) but decreases recall (more false negatives).
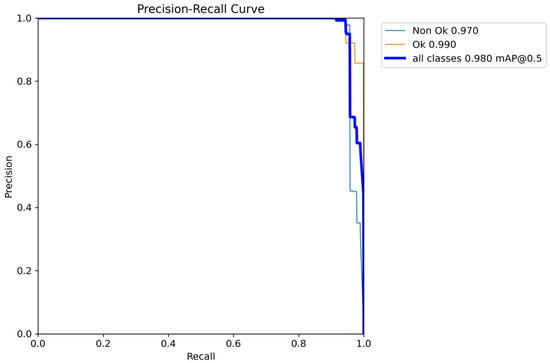
Figure 10.
Confidence curve for recall performance.
5.2. Robot Grasp and Delay Accuracy
The statistical findings of the practical assessment of the suggested fault identification application based on the YOLOv5 algorithm are shown in Table 1. The assessment was conducted using five distinct scenario situations, with the category of the item being supervised on the conveyor being changed each time, and the procedure being repeated 100 times for each scenario. In the first scenario, we were utilizing a non-defective component to conduct the investigation. In addition to this, we provided several defective items with names ranging from defect type 1 to defect type 4 in the same condition. We have selected a distinct defect type for every single case. Meanwhile, it should be mentioned that each time we conducted the experiment, we tried to modify the piece’s position, the robot arm’s position, and the brightness of the lighting. It should be mentioned that, every time we run the experience, we attempt to adjust the item’s location, the robot arm’s position, and the illumination from various corners that surround the piece. The table illustrates that the robot is 100% accurate in identifying the non-defective item out of 100 distinct experiences. The defect type 2 produced the same results, as it achieved an accuracy of 100%. In the case of defect type 1, the robot misidentified two pieces because it did not recognize them well. In those tries, the defective parts were detected as non-defective, yielding a 98% proper-grip accuracy for that experience. In the case of defect type 3, a 95% proper detection accuracy was achieved despite five incorrect tries. We attempted to increase the complexity of the last scenario, defect type 4, by adding the hardest scenario possible to the system. Therefore, out of 100 attempts, 10 incorrect recognitions were made, yielding a 90% accuracy in the grasp. In summary, the system’s total accuracy for each of the five scenarios that were tested for over 100 repetitions was 96.6% grasp success accuracy. This can be explained by the significant accuracy of the YOLOv5 algorithm that was utilized to identify and categorize the pieces, as well as the accurate performance of the RGBD camera that is used to determine the exact location of the piece on the conveyor.

Table 1.
Evaluation of correct grasp accuracy on UR robot.
6. Conclusions
In industrial areas, AI algorithms are being adopted for various reasons, like enhancing and speeding up productivity and quality. In this paper, we are interested in investigating the performance and accuracy of the YOLOv5 algorithm in detecting defective features on a specific piece. The process relies on different conditions, like if the number of coiled circles fits with that required by the production charge. In addition, it can detect faults even if the spills and the color are as defined in the desired piece. Furthermore, the distance between the coiled circles may cause a problem for the dedicated application. Therefore, this is also considered by our system. In general, the power inductance pieces are of different shapes and forms, each one is specifically dedicated to a given application. Thus, considering this issue, is mandatory to make the process of production more rapid and intelligent relying on the effectiveness of the emerging AI algorithms. The use of YOLOv5 in our proposed industrial system has shown a high performance in terms of both accuracy and latency, which, nowadays, is required to improve the rate of production and quality. The YOLOv5 has reached an accuracy of 96% for our custom data and the correct grasp accuracy for studied scenarios reached an average of 96.6%.
Author Contributions
Y.Y., A.G.-G., A.E.O. and M.A. contributed to the design and implementation of the research work, upon the analysis, simulations, and writing of the manuscript. All authors have read and agreed to the published version of the manuscript.
Funding
This research received no external funding.
Institutional Review Board Statement
Not applicable.
Informed Consent Statement
Not applicable.
Data Availability Statement
The data used may be requested directly from the respective author.
Conflicts of Interest
The authors declare that there are no conflicts of interest regarding the publication of this paper.
References
- Chi, H.R.; Wu, C.K.; Huang, N.F.; Tsang, K.F.; Radwan, A. A Survey of Network Automation for Industrial Internet-of-Things Towards Industry 5.0. IEEE Trans. Ind. Inform. 2022, 19, 2065–2077. [Google Scholar] [CrossRef]
- Nizam, H.; Zafar, S.; Lv, Z.; Wang, F.; Hu, X. Real-time deep anomaly detection framework for multivariate time-series data in industrial IoT. IEEE Sens. J. 2022, 22, 22836–22849. [Google Scholar] [CrossRef]
- Futai, M.M.; Bittencourt, T.N.; Carvalho, H.; Ribeiro, D.M. Challenges in the application of digital transformation to inspection and maintenance of bridges. Struct. Infrastruct. Eng. 2022, 18, 1581–1600. [Google Scholar] [CrossRef]
- Hajari, N.; Lugo Bustillo, G.; Sharma, H.; Cheng, I. Marker-Less 3d Object Recognition and 6d Pose Estimation for Homogeneous Textureless Objects: An RGB-D Approach. Sensors 2020, 20, 5098. [Google Scholar] [CrossRef]
- Zhihong, C.; Hebin, Z.; Yanbo, W.; Binyan, L.; Yu, L. A vision-based robotic grasping system using deep learning for garbage sorting. In Proceedings of the 2017 36th Chinese Control Conference (CCC), Dalian, China, 26–28 July 2017; IEEE: Piscataway, NJ, USA, 2017; pp. 11223–11226. [Google Scholar]
- Sharifzadeh, S.; Biro, I.; Kinnell, P. Robust hand-eye calibration of 2D laser sensors using a single-plane calibration artefact. Robot. Comput.-Integr. Manuf. 2020, 61, 101823. [Google Scholar] [CrossRef]
- Wang, C.; Tang, Y.; Zou, X.; SiTu, W.; Feng, W. A robust fruit image segmentation algorithm against varying illumination for vision system of fruit harvesting robot. Optik 2017, 131, 626–631. [Google Scholar] [CrossRef]
- Morar, C.; Doroftei, I.; Doroftei, I.; Hagan, M. Robotic applications on agricultural industry. A review. In Proceedings of the 9th International Conference on Advanced Concepts in Mechanical Engineering—ACME 2020, Iași, Romania, 4–5 June 2020. [Google Scholar]
- Olesen, A.S.; Gergaly, B.B.; Ryberg, E.A.; Thomsen, M.R.; Chrysostomou, D. A collaborative robot cell for random bin-picking based on deep learning policies and a multi-gripper switching strategy. Procedia Manuf. 2020, 51, 3–10. [Google Scholar] [CrossRef]
- Chen, X.; Guhl, J. Industrial robot control with object recognition based on deep learning. Procedia CIRP 2018, 76, 149–154. [Google Scholar] [CrossRef]
- Ren, Z.; Fang, F.; Yan, N.; Wu, Y. State of the art in defect detection based on machine vision. Int. J. Precis. Eng. Manuf.-Green Technol. 2021, 9, 661–691. [Google Scholar] [CrossRef]
- Eklund, K.; Aros-O’Malley, M.; Murrieta, I. Multicultural supervision: What difference does difference make? Contemp. Sch. Psychol. 2014, 18, 195–204. [Google Scholar] [CrossRef]
- Levine, S.; Pastor, P.; Krizhevsky, A.; Ibarz, J.; Quillen, D. Learning hand-eye coordination for robotic grasping with deep learning and large-scale data collection. Int. J. Robot. Res. 2018, 37, 421–436. [Google Scholar] [CrossRef]
- Furrer, F.; Wermelinger, M.; Yoshida, H.; Gramazio, F.; Kohler, M.; Siegwart, R.; Hutter, M. Autonomous robotic stone stacking with online next best object target pose planning. In Proceedings of the 2017 IEEE International Conference on Robotics and Automation (ICRA), Singapore, 29 May–3 June 2017; IEEE: Piscataway, NJ, USA, 2017; pp. 2350–2356. [Google Scholar]
- Redmon, J.; Divvala, S.; Girshick, R.; Farhadi, A. You only look once: Unified, real-time object detection. In Proceedings of the IEEE Conference on Computer Vision and Pattern Recognition, Las Vegas, NV, USA, 27–30 June 2016; pp. 779–788. [Google Scholar]
Disclaimer/Publisher’s Note: The statements, opinions and data contained in all publications are solely those of the individual author(s) and contributor(s) and not of MDPI and/or the editor(s). MDPI and/or the editor(s) disclaim responsibility for any injury to people or property resulting from any ideas, methods, instructions or products referred to in the content. |
© 2023 by the authors. Licensee MDPI, Basel, Switzerland. This article is an open access article distributed under the terms and conditions of the Creative Commons Attribution (CC BY) license (https://creativecommons.org/licenses/by/4.0/).