Proceeding Paper

Batteries Contribution Assessment for Optimal Self-Sufficiency in Large Building Complexes †

by
Emmanuel Karapidakis
1,*,
Marios Nikologiannis
2,
Ariadni Kikaki
1,
Marini Markaki
1 and
Amalia Moutsopoulou
3
1
Department of Electrical and Computer Engineering, Hellenic Mediterranean University, 71410 Chania, Greece
2
Department of Physics, University of Crete, 70013 Rethymno, Greece
3
Department of Mechanical Engineering, Hellenic Mediterranean University, 71410 Chania, Greece
*
Author to whom correspondence should be addressed.
Presented at the 4th International Conference on Communications, Information, Electronic and Energy Systems (CIEES 2023), Plovdiv, Bulgaria, 23–25 November 2023.
Eng. Proc. 2024, 60(1), 7; https://doi.org/10.3390/engproc2024060007
Published: 5 January 2024

Abstract

:
Energy consumption in large building complexes has a specific profile, consisting of thermal energy and electricity. Due to the recent energy crises, operational costs of these needs have been significantly increased. According to EU Energies Policies, the future objective is the transition to renewable-based energy, and self-sufficient and nearly zero buildings. This paper investigates the electricity consumption profile of a specific hotel located in Crete. An algorithm has been introduced to maximize the self-sufficiency of the examined hotel. The algorithm succeeds in increasing the self-sufficiency of the hotel’s energy system up to 99% by determining the PV power and battery capacity.

1. Introduction

Large buildings require energy for various functions, and the amount of energy needed can vary depending on the building’s purpose and design. Many authors studied energy consumption in large-volume buildings through the utilization of diverse methodologies and examination of various facets of the issue [1,2,3]. The specific profile of a large building complex consists of thermal energy and electricity [4]. Attention has been directed towards a mounting concern regarding the increment in energy consumption and the relevant costs.
The recent energy crisis has led to significant increases in operational costs for these needs. The pandemic disrupted the renewable energy sector. While renewables had been experiencing rapid growth, lockdowns and supply chain disruptions delayed the construction of renewable energy projects and the manufacturing of related components [5]. Changes in electricity demand patterns were observed. With more people working from home, there was a shift in electricity consumption from commercial and industrial sectors to residential areas. This shift posed challenges for grid management and load balancing. Furthermore, the recent conflicts such as the Ukrainian war have led to even higher energy costs [6].
EU Energies Policies state that the future objective is the transition to renewables-based energy self-sufficient and nearly zero buildings [7,8,9]. The concept of autonomy in buildings regarding energy consumption with the use of Renewable Energy Sources (RES) has become a priority for many countries to reduce building sector energy consumption [10,11]. The idea necessitates fulfilling a building’s thermal and electrical energy requirements through the installation of locally deployed renewable energy sources. The development of solar energy is one of the most promising approaches for reducing carbon footprints and reducing CO2 emissions in buildings [12]. In recent times, photovoltaic systems (PVs) have experienced notable expansion due to rising electricity costs and the declining prices of installation and operation [13,14].
Hotels are ranked in many countries to be among the most energy-consuming buildings categories in the world [15,16,17]. More than half of the hotel buildings in Europe are located in Mediterranean countries. Being situated in places with increased energy demand during specific seasons, frequent high energy costs, and limited energy supply security is a key characteristic of Mediterranean hotels [18]. On the contrary, there is a significant opportunity to use RES and save energy. However, the utilization of renewable energy sources in hotels is lacking [19].
The present study examines the energy composition of a summer operating hotel situated on the island of Crete. Crete saw a decrease in tourist arrivals and activities in the early months of 2021 due to ongoing pandemic-related challenges. Many tourists did visit Crete in 2021, especially during the summer months, but the overall tourist numbers were lower compared to a typical year due to the pandemic’s lingering effects [20].
Situated in the southern region of the Aegean Sea, Crete experiences an extended period of hot and humid summers from early May to late October. In the summer, hotels experience peak occupancy, coinciding with maximum solar exposure and temperature levels. During this period, energy consumption typically accounts for up to 50% of the total usage for most hotels. Furthermore, the significance of the impact of different seasons on energy consumption varies dramatically with outdoor temperature. Nevertheless, due to this seasonal operation, the hotel has comparatively lower energy consumption than the unitary energy consumption per night spent.
The hotel’s total annual energy consumption has been estimated at 5.4 GWh. The main source of energy used in the hotel is electricity, which is utilized for activities like air conditioning, lighting, lifts, electric appliances, etc. According to a study, the amount of electricity needed to run air conditioners accounts for 30% or more of all energy consumption costs [21]. Furthermore, solar thermal for hot water production plays a remarkable role too.
One of the most common RES that can be easily embedded in buildings is photovoltaics (PV) technology, which can supply sufficient power [22]. The main problem with photovoltaics is that their production is variable due to weather conditions. To address the variability in PV energy production, several strategies and technologies are employed [23]. Such technologies are different types of energy storage systems batteries have the capability to store surplus energy produced during sunny time frames for later utilization when sunlight is insufficient improving the reliability of solar power [24]. The most popular storage solution for reducing PV’s intermittent nature and re-solving the inconsistency between production and load is batteries [25]. When sizing a PV installation coupled with batteries to enhance a building’s energy independence, various combinations of PV installed power and battery capacity might yield equivalent levels of self-sufficiency in the energy system [26].
To increase the investigated hotel’s self-sufficiency, an algorithm has been implemented. The algorithm takes into account not only the technical aspect of the problem (sufficient percentage of self-sufficiency), but the financial aspect as well by taking into account the capital expenditure (CAPEX) required for the installation of the system, since the study is a decision-making tool for entrepreneurs. The implementation of the algorithm is based on actual data obtained from the hotel under investigation. The energy consumption for one year is monitored and elaborated, coupled with data on annual production of a photovoltaic system located in Crete, and a qualitative analysis has been conducted, considering the energy consumption hourly data for the years 2021, 2022 and 2023.
The algorithm’s calculation of photovoltaic power and battery capacity enhances the hotel’s energy system self-sufficiency to 99.02%. This suggests that the hotel may produce and store a substantial portion of its energy requirements, reducing reliance on external power sources. The computed optimal PV power and storage capacity are 7.2 MW and 19.8 MWh, respectively, with an estimated capital cost of EUR 12,150,000 for the system’s installation. This cost includes expenses related to purchasing and installing the solar panels, inverters, and batteries, as well as any necessary infrastructure and labor costs.

2. Materials and Methods
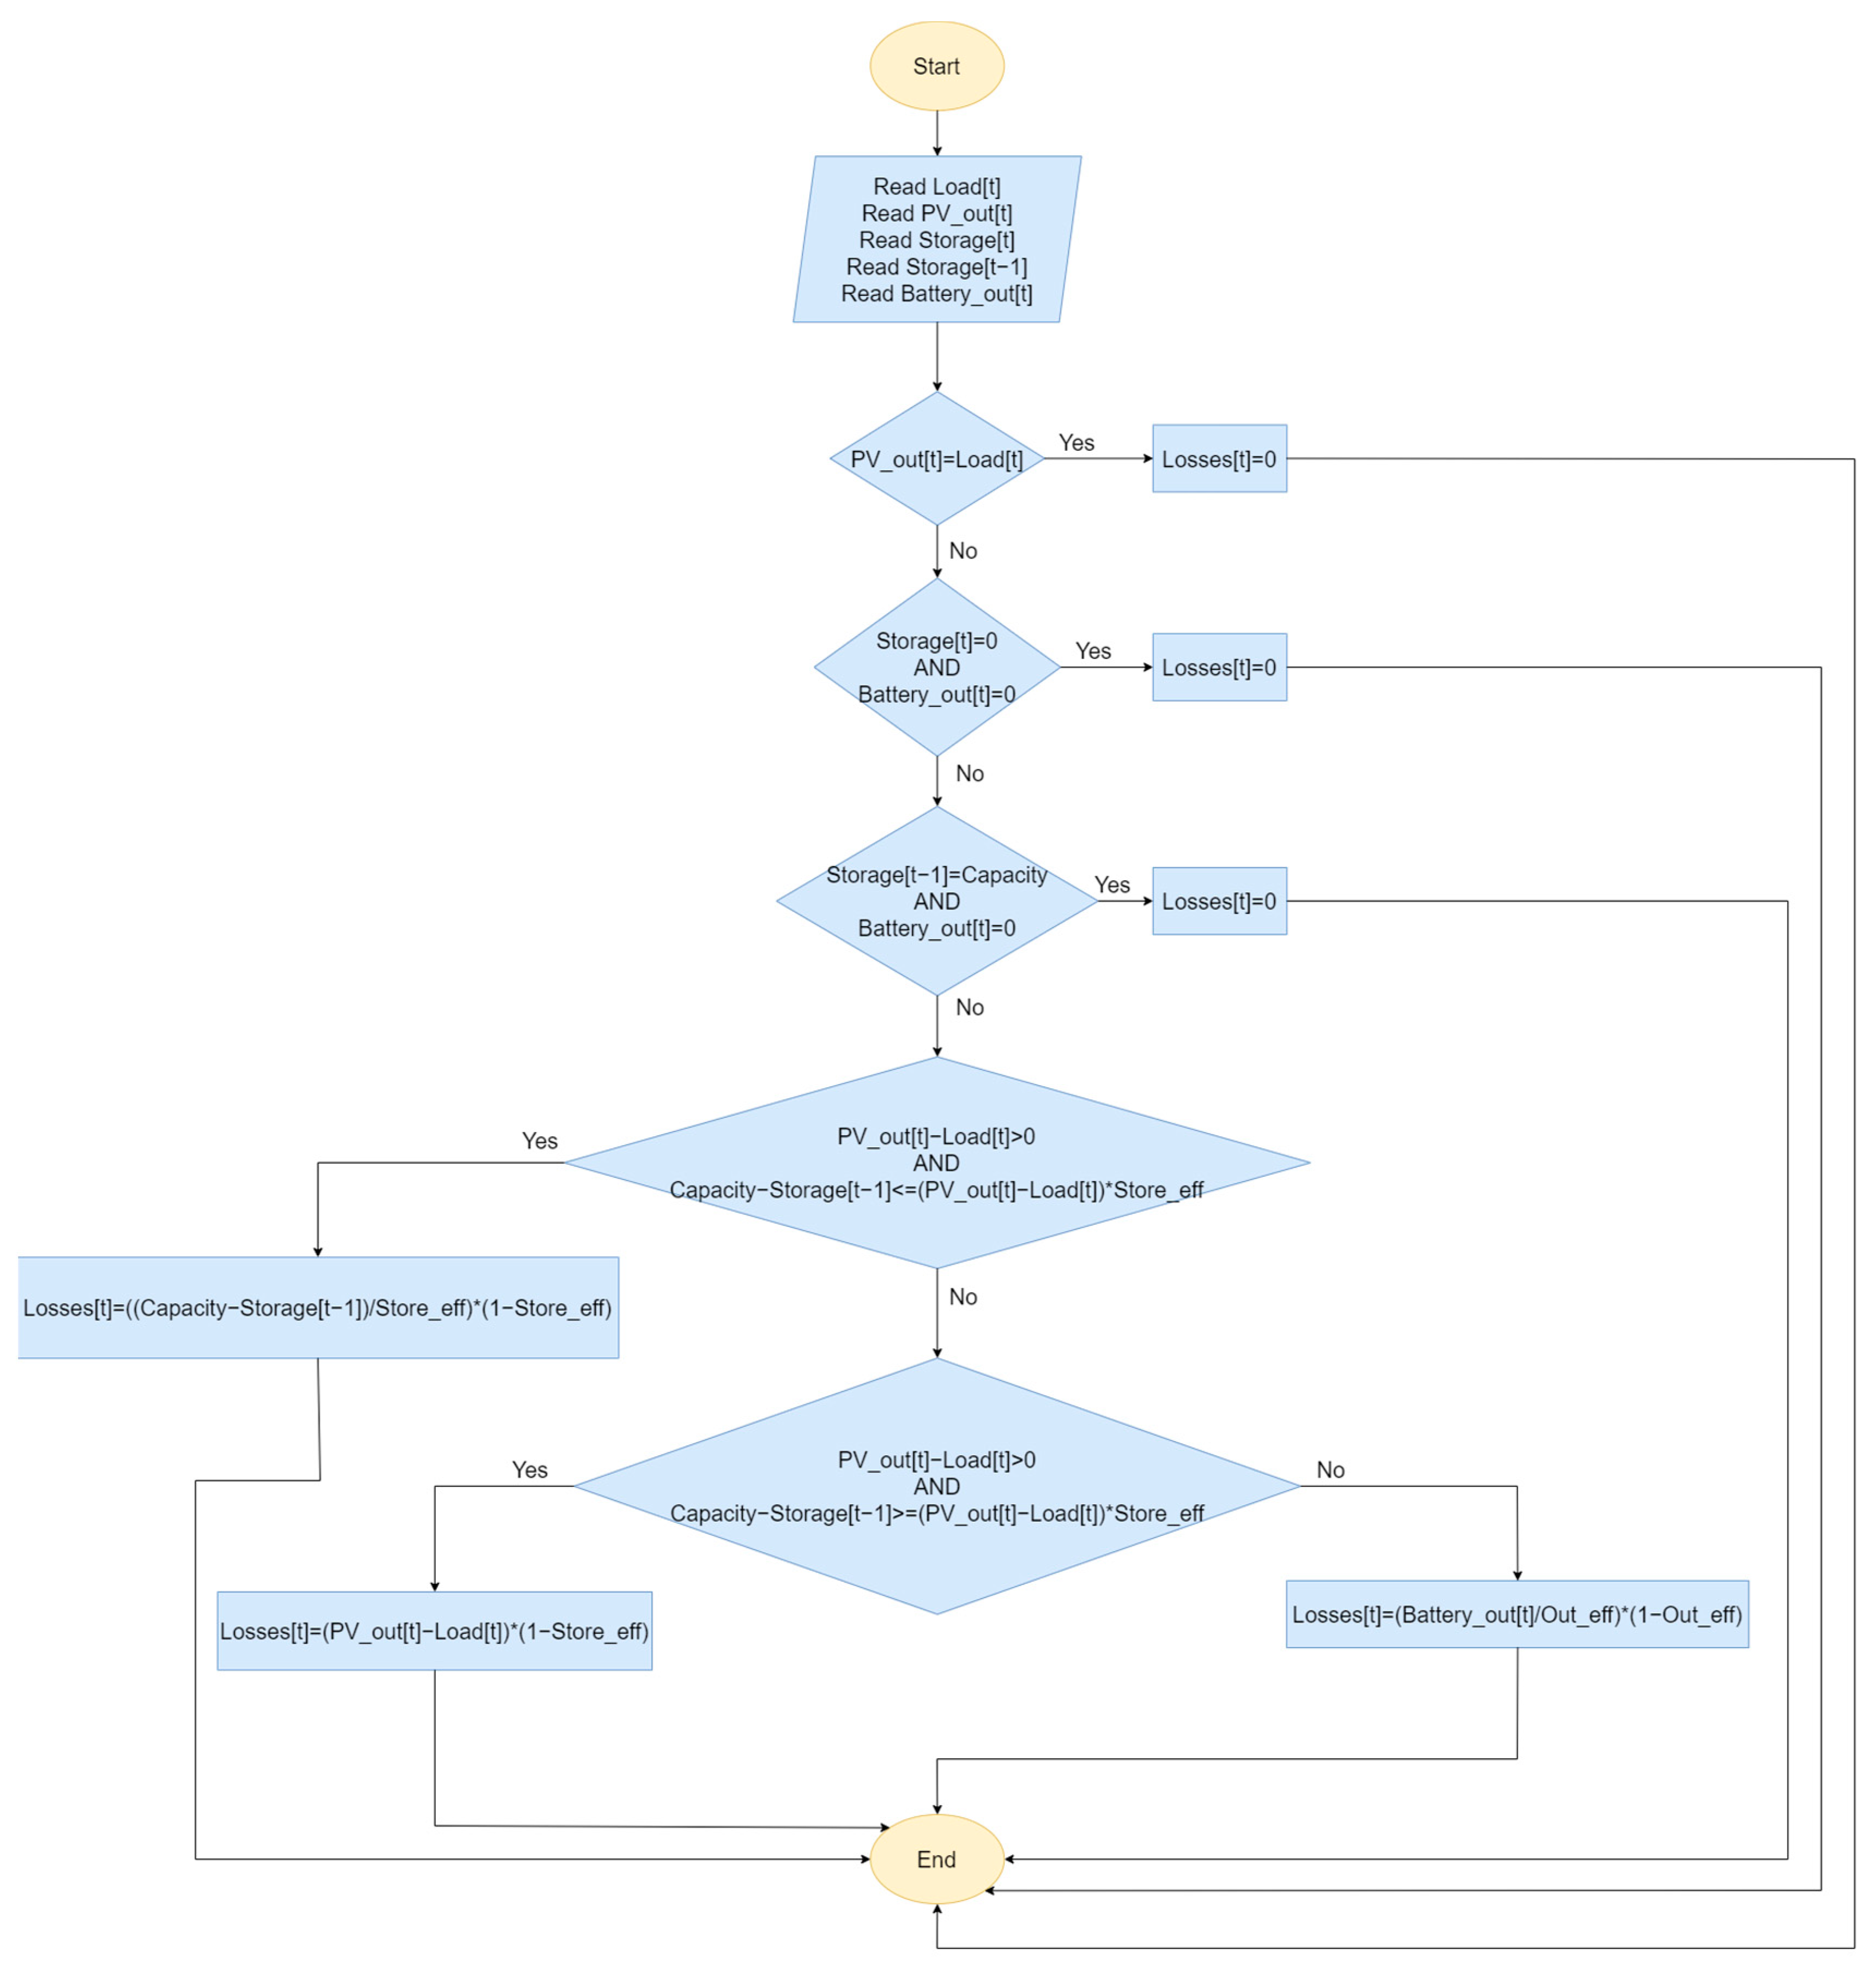
Studying the specific hotel and analyzing the annual consumptions, it is noticeable that the consumption increases significantly in the time range from April to October. This is an expected energy profile for a hotel located in the island of Crete, where the traffic is considerably higher than the rest of the year due to seasonal tourism.
For the entirety of the year 2022, measurements regarding the energy needs have been collected (Figure 1). The surface area of this hotel is approximately 95 acres and has 411 rooms. The result of this research is that the total consumption of the hotel for the year 2022 was 5.4 GWh, while the maximum hourly consumption was 1598.6 kWh.
Analyzing the year, it is observed from Figure 2 that for the duration of the summer season, the highest energy demand is reported, while August reaches its peak.
The same can be seen in Figure 3 from the maximum amount of energy demand for each month.
Expanding further on these results and analyzing indicatively for this month, the following diagram of Figure 4 illustrates the fluctuation in energy demand.
In addition, by focusing on a shorter time span, more specifically on a week in August (the peak-demand month of the year) the following diagram presented in Figure 5 was formed that shows the consumption curve during the week.

3. Methodology

The implementation of the algorithm requires the collection of two sets of data, the hotel’s energy demand on an hourly basis throughout the year 2022, and the hourly output of a solar panel located in Crete. Using these values, the state of the storage system in each hour is calculated, along with the energy allocations stemming from the photovoltaic production and the grid’s contribution to load satisfaction. Then, overall quantities regarding the system’s efficiency can be computed and used to determine a correlation between them and the decision variables of the model.
The values of hourly demand are symbolized as Load[t], t symbolizing the number of hours after the installation, and the normalized PV output as PV[t], so for a specific hour t, the PV output PV out [ t ] , is equal to
PV out t = PV power × PV [ t ] ,
where PV power the nominal power of the installed photovoltaic system.
Before the theoretical installation, the storage system is considered to be fully charged when installed to the energy system (Storage[0] = Capacity), while both output and storage efficiency are selected to be equal to 90%, and the maximum output equal to max ( Load [ t ] ) , for t = 1, 2,…, 8760.
By using the collected data, crucial hourly values describing the behaviour of the system are calculated.
Initially, the output of the installed storage system for each hour, denoted as Battery out [ t ] , is calculated according to the description provided in Figure 6.
Then, the total amount accumulated in the battery by the conclusion of each hour t is calculated as shown in Figure 7.
When both the PV production and battery storage do not suffice for load satisfaction, the system imports power from the grid, the amount being calculated as shown in Figure 8.
Since both the storage capacity and round-trip efficiency are limited, the amount of excess energy, after losses, produced by the photovoltaic system cannot be fully stored for all cases, therefore, rejections attributed to the system’s production should be considered and are calculated as shown in Figure 9.
Additionally, the losses of the storage system after each charge or discharge are calculated as described in Figure 10.
By calculating the hourly values of the system’s attributes as described above, the system’s annual rejection rate, annual percentage of the grid’s contribution, and sys-tem self-sufficiency are computed.
The percentage of the network’s contribution is the amount of annual energy imported over the amount required annually:
Network perc = t = 1 8760 Network [ t ] t = 1 8760 Load [ t ] .
The annual rejection percentage represents the portion of energy rejected annually, divided by the annual production stemming from the photovoltaic installation, excluding the amount that was discarded due to the storage system’s limited efficiency or unsuccessfully stored by the end of the year:
Rej perc = t = 1 8760 Rej [ t ] t = 1 8760 PV out [ t ] - t = 1 8760 Losses [ t ] - ( Store [ 8760 ] - Cap ) .
Additionally, the percentage of the annual energy produced and taken advantage of successfully is the quantity of solar production and the storage system’s maximum charge minus the amount lost, rejected, and stored at the end of the year over the annual requirement of energy:
SS perc = t = 1 8760 PV out [ t ] + Cap - t = 1 8760 Rej [ t ] t = 1 8760 Losses [ t ] - Store [ 8760 ] t = 1 8760 Load [ t ]
By calculating the values stemming from Equations (2)–(4), the dependence of annual self-sufficiency to the installed PV power and storage capacity can be computed, along with the capital expenditure’s correlation to the forementioned values.

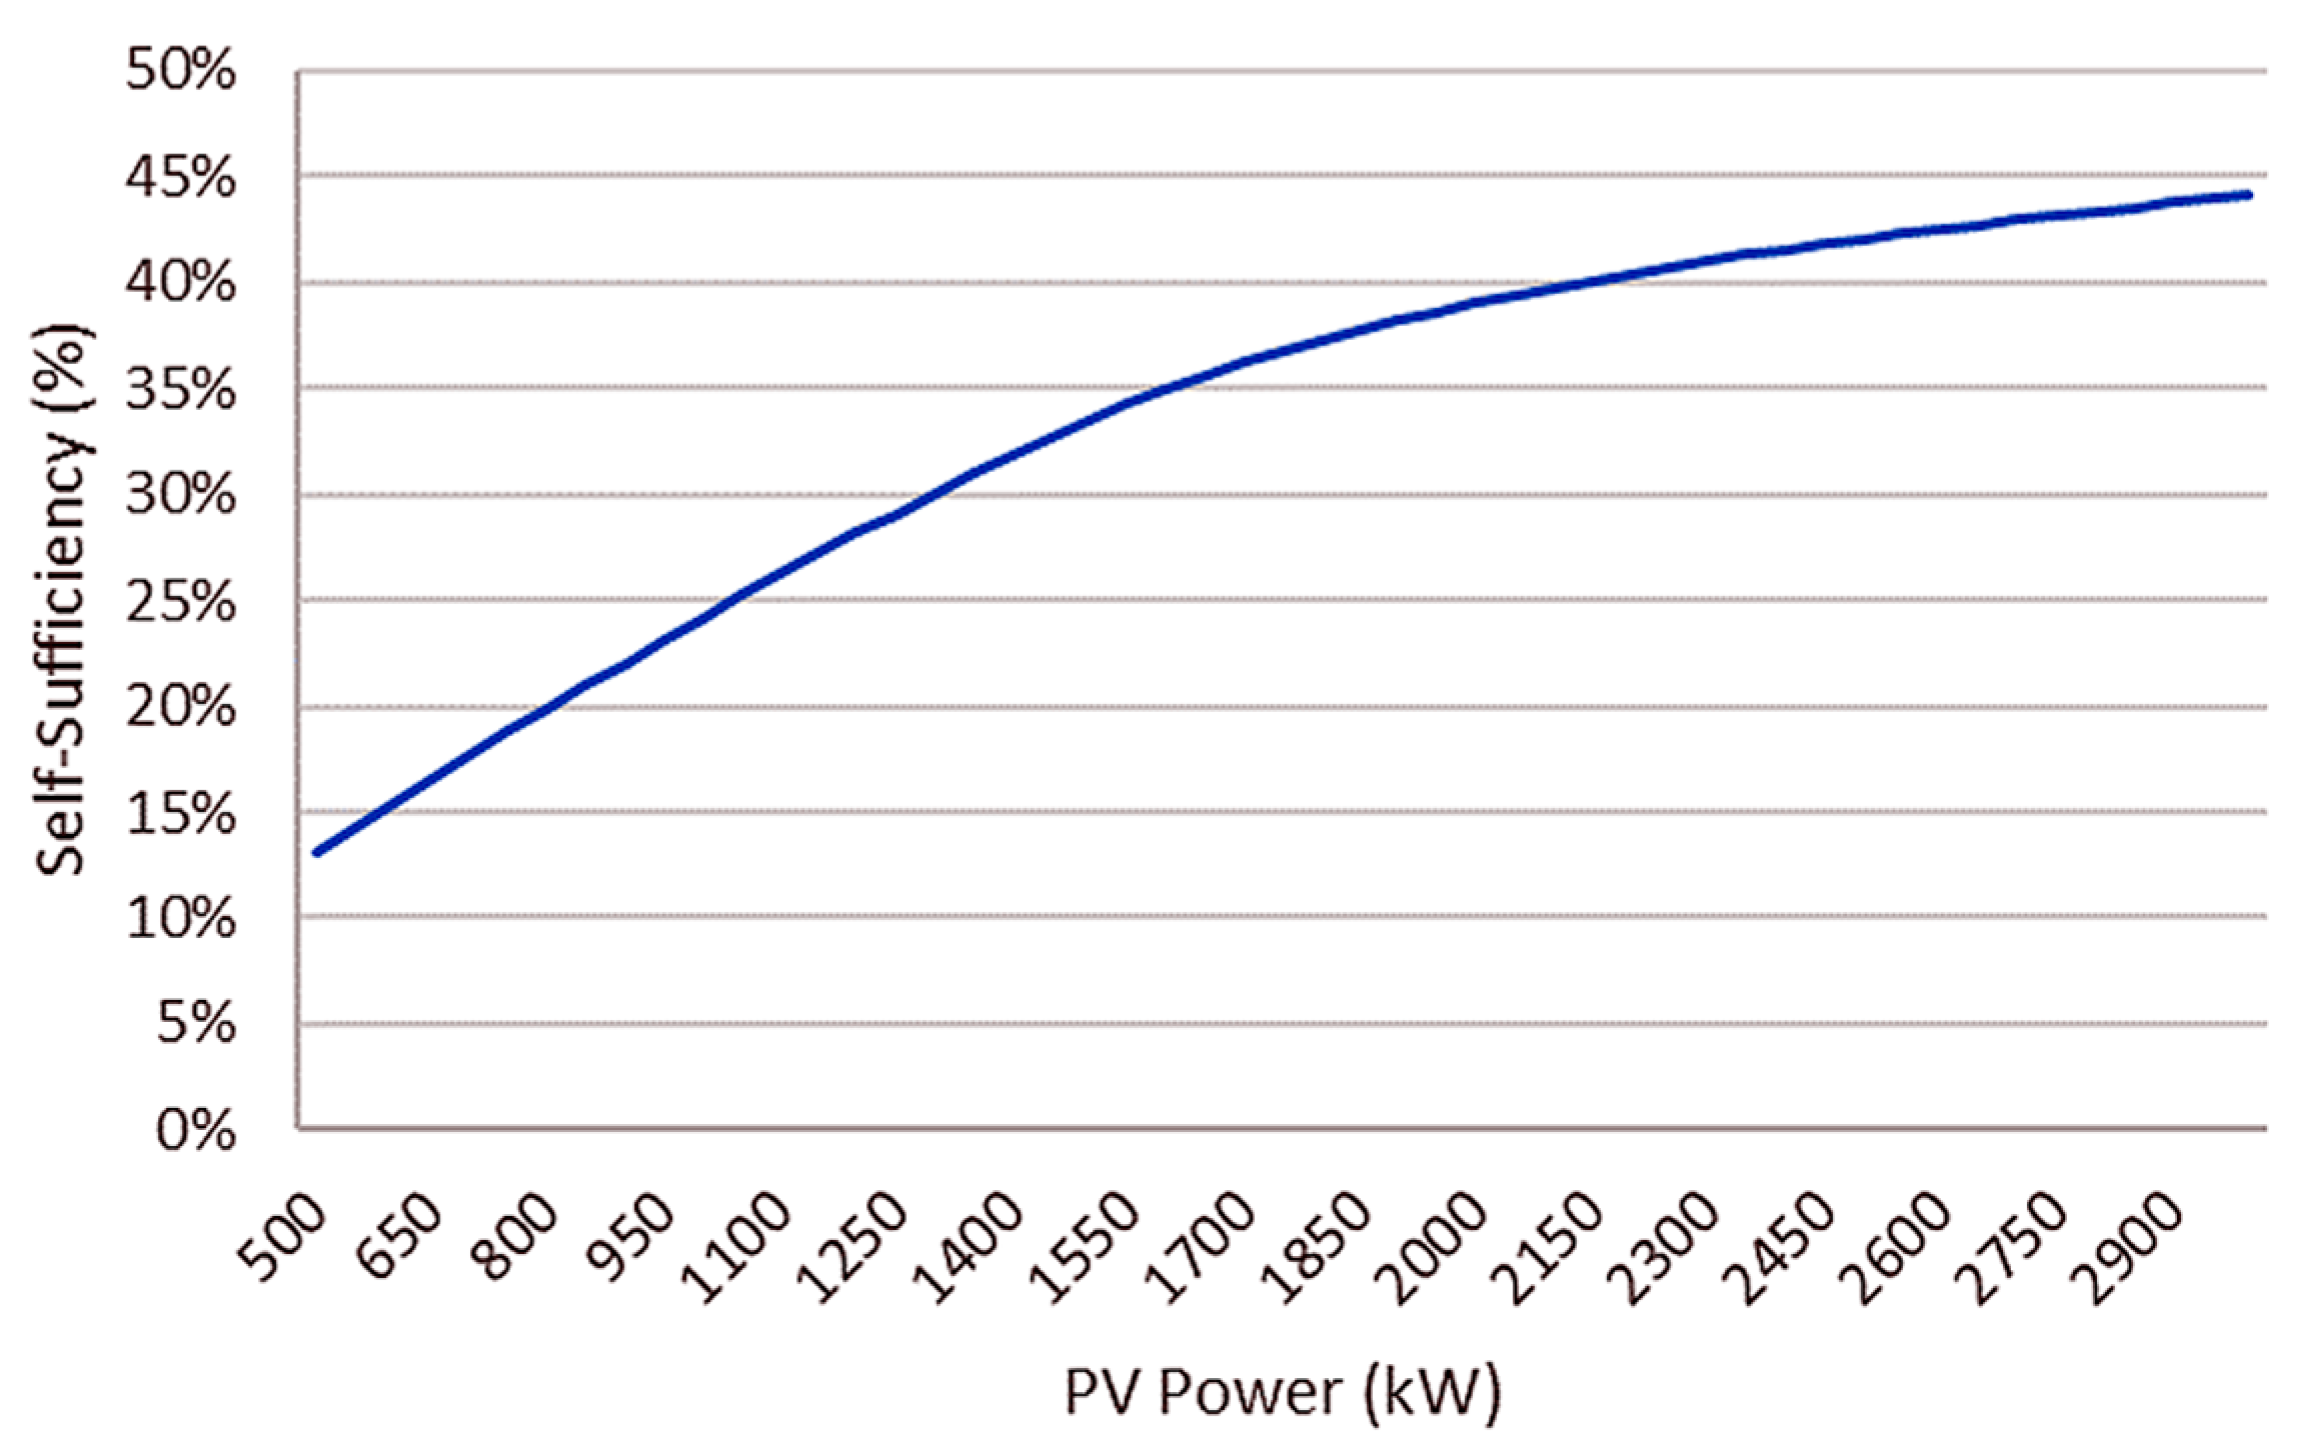
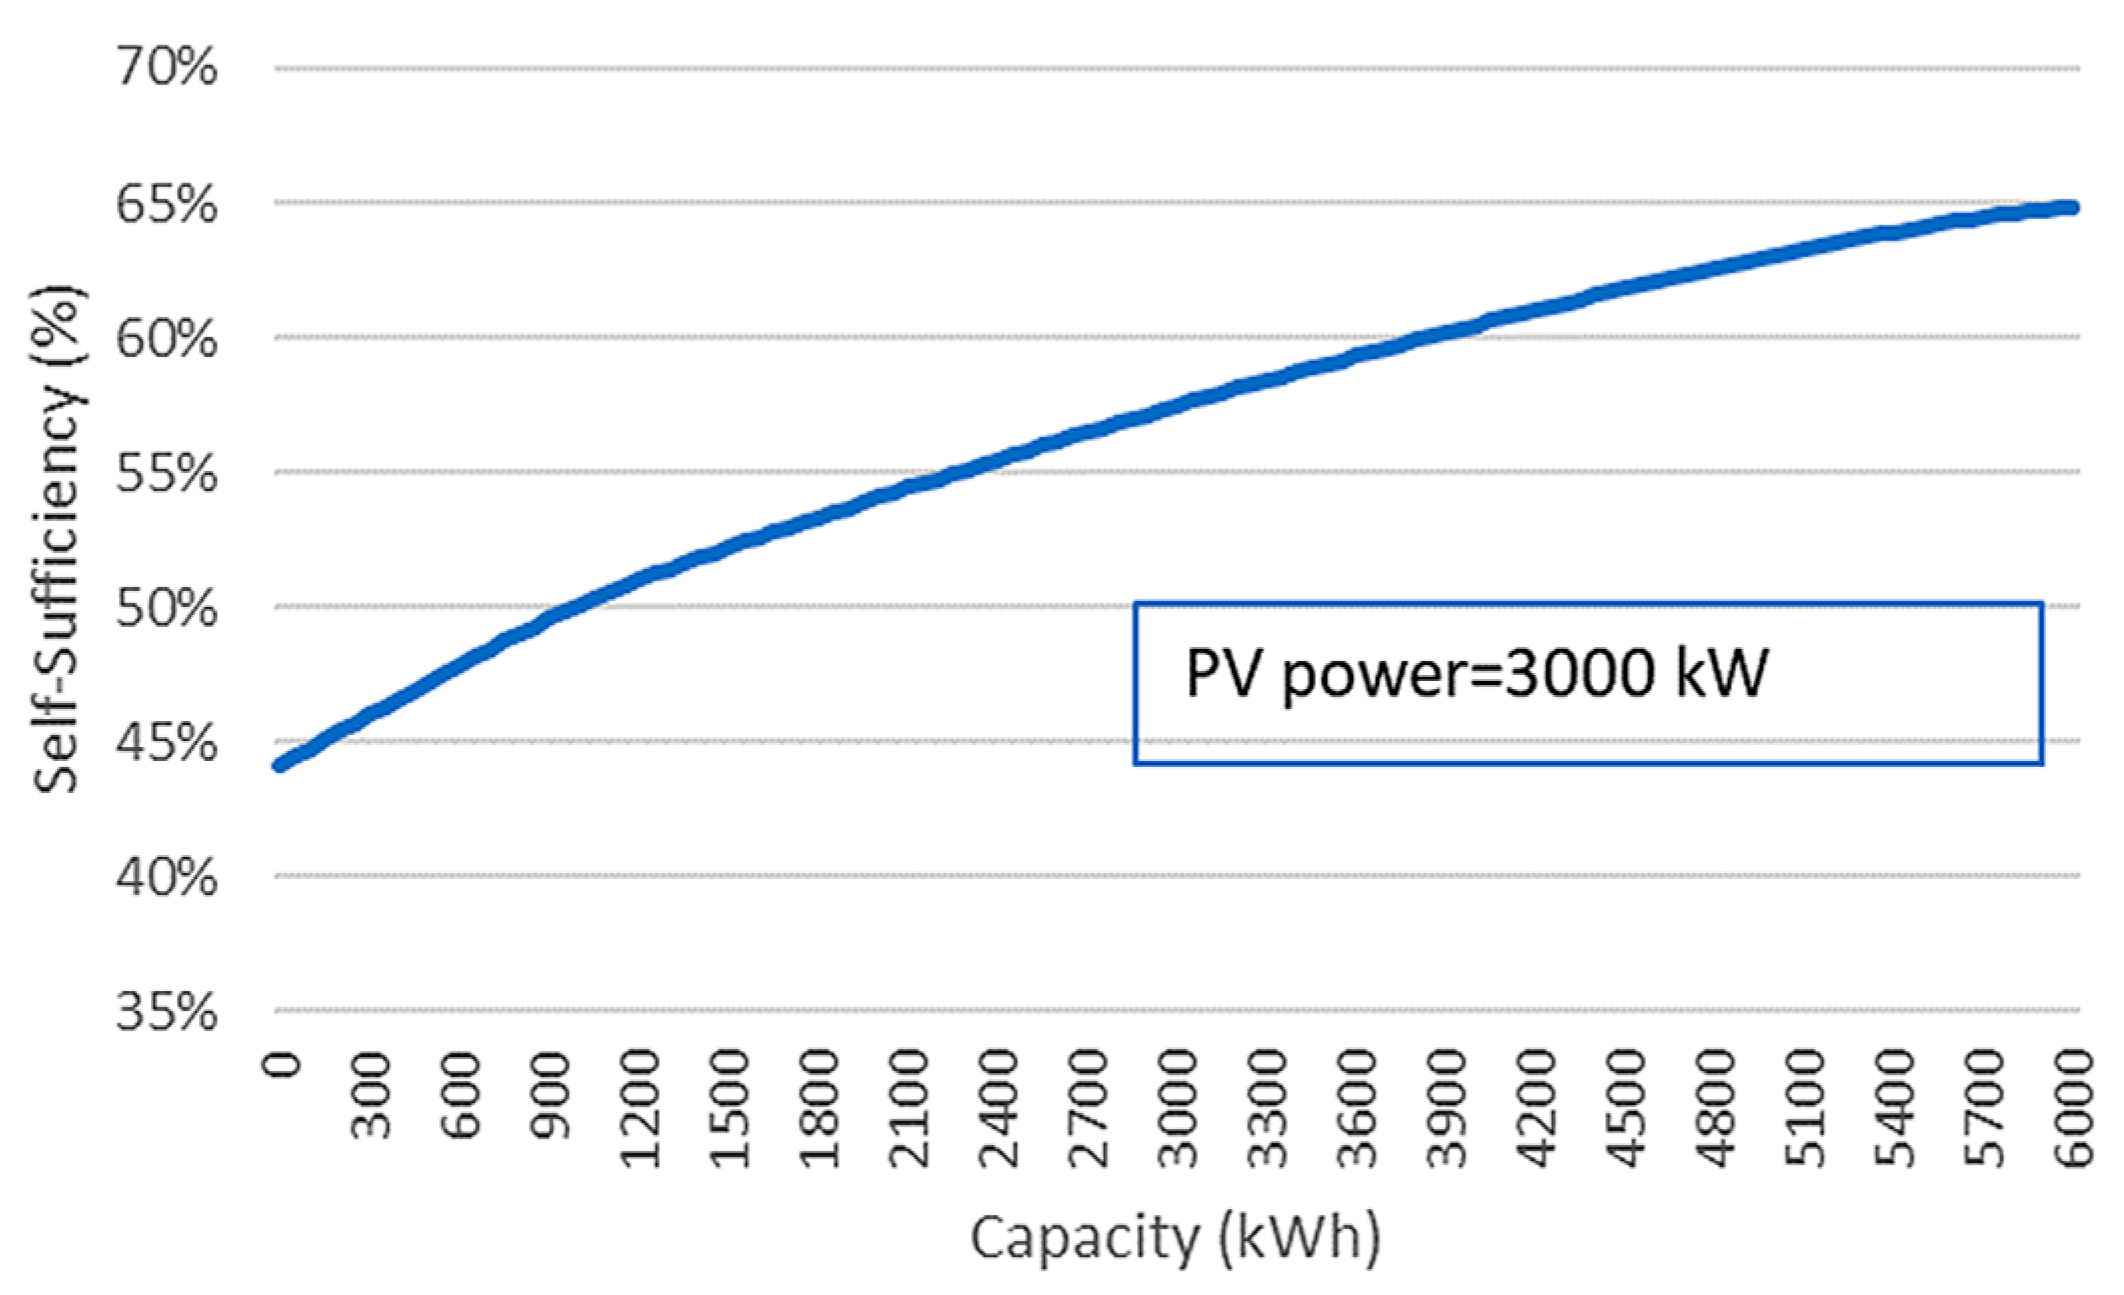
4. Results and Discussion

To assess the necessity of a storage system, the relationship between the system’s self-sufficiency and the photovoltaic system’s power is computed and illustrated in Figure 11.
Without an installed storage system, the self-sufficiency cannot exceed 50%, therefore an energy system is indeed necessary to ensure the system’s independence from the network. For a fixed value of 3000 kW PV power, the relationship between self-sufficiency and the system’s storage capacity is presented in Figure 12.
In this scenario, the sufficiency cannot exceed 70%. To both locate and isolate the sets of decision variables for which the self-sufficiency exceeds a minimum of satisfactory percentage, a 3-dimensional scatter plot of the sufficiency, calculated for a wide range of PV power and storage capacity is formed, as shown in Figure 13.
Figure 13 indicates that for a wide range of PV power and Capacity values, the self-sufficiency exceeds 99%, which is considered a sufficient level of independence from the grid.
In the specified range, the optimal pair of (PV power, capacity) is considered that ensures the minimum capital expenditure required for PV power and energy system installation.
At constant rates of 1000 €/kW for PV power and 250 €/kWh for storage capacity, the CAPEX is computed and presented in Table 1.
In Figure 14, the trend of CAPEX correlated to PV power and capacity is shown.
From both Table 1 and Figure 14, it is apparent that the optimal solution is one of the two solutions that ensure the minimum CAPEX, equal to EUR 12,150,000 in the particular case. However, the first solution yields a slightly higher self-sufficiency percentage (99.017%) compared to the second one (99.015%), and is, therefore, the optimal solution of the model.

5. Conclusions

Large building complexes typically exhibit a distinct energy consumption pattern. In light of recent energy crises, the operational expenses associated with meeting these requirements have seen a significant rise. In accordance with EU Energy Policies, the future goal is to transition towards buildings that rely on renewable energy sources, aiming for self-sufficiency and near-zero energy consumption. This research focused on the energy demand of a hotel situated on the island of Crete. An algorithm was developed to optimize the hotel’s self-sufficiency, and it has proven successful in enhancing the building’s energy system self-sufficiency to as high as 99%.
This achievement was realized by installing 7.4 MW of PV power and 19 MWh of battery capacity, with the total CAPEX approximately equals to 12 M€. The total consumption of the hotel that has been covered was 5.4 GWh, while the maximum hourly consumption was 1598.6 kWh.
It is noteworthy that while this investment reduces the hotel’s dependence on external energy sources and can lead to long-term cost savings, it also involves a substantial initial capital expense. The hotel will need to evaluate the economic benefits and environmental impact of this investment to determine its overall feasibility and return of investment.

Author Contributions

Conceptualization, E.K. and M.N.; methodology, E.K. and M.N.; validation, M.N., M.M., A.M. and A.K.; formal analysis, M.N., M.M. and A.K.; investigation, M.N., M.M. and A.K.; resources, M.N., M.M. and A.K.; writing—original draft preparation, M.N., M.M. and A.K.; writing—review and editing, M.N., M.M. and A.M.; visualization, A.K.; supervision, E.K.; project administration, E.K. All authors have read and agreed to the published version of the manuscript.

Funding

This research received no external funding.

Institutional Review Board Statement

Not applicable.

Informed Consent Statement

Not applicable.

Data Availability Statement

The data presented in this study are available on request from the corresponding author. The data are not publicly available due to private ownership.

Acknowledgments

We express our gratitude for the substantial support, including data and materials, provided by the investigated hotel.

Conflicts of Interest

The authors declare no conflicts of interest.

References

  1. Amasyali, K.; El-Gohary, N.M. A Review of Data-Driven Building Energy Consumption Prediction Studies. Renew. Sustain. Energy Rev. 2018, 81, 1192–1205. [Google Scholar] [CrossRef]
  2. Zhao, H.; Magoulès, F. A Review on the Prediction of Building Energy Consumption. Renew. Sustain. Energy Rev. 2012, 16, 3586–3592. [Google Scholar] [CrossRef]
  3. Mavrotas, G.; Demertzis, H.; Meintani, A.; Diakoulaki, D. Energy Planning in Buildings under Uncertainty in Fuel Costs: The Case of a Hotel Unit in Greece. Energy Convers. Manag. 2003, 44, 1303–1321. [Google Scholar] [CrossRef]
  4. Voss, K.; Sartori, I.; Napolitano, A.; Geier, S.; Goncalves, H.; Hall, M. Load matching and grid interaction of net zero energy buildings. In Proceedings of the EUROSUN 2010 International Conference on Solar Heating, Cooling and Buildings, Graz, Austria, 28 September–1 October 2010. [Google Scholar]
  5. Hoang, A.T.; Nižetić, S.; Olcer, A.I.; Ong, H.C.; Chen, W.-H.; Chong, C.T.; Thomas, S.; Bandh, S.A.; Nguyen, X.P. Impacts of COVID-19 Pandemic on the Global Energy System and the Shift Progress to Renewable Energy: Opportunities, Challenges, and Policy Implications. Energy Policy 2021, 154, 112322. [Google Scholar] [CrossRef] [PubMed]
  6. Guan, Y.; Yan, J.; Shan, Y.; Zhou, Y.; Hang, Y.; Li, R.; Liu, Y.; Liu, B.; Nie, Q.; Bruckner, B.; et al. Burden of the Global Energy Price Crisis on Households. Nat. Energy 2023, 8, 304–316. [Google Scholar] [CrossRef]
  7. E.C. Horizon 2020 Work Programme 2018–2020: 10. Secure, Clean and Efficient Energy. Available online: https://ec.europa.eu/research/participants/data/ref/h2020/wp/2018-2020/main/h2020-wp1820-energy_en.pdf (accessed on 20 June 2023).
  8. IEA. Net Zero by 2050: A Roadmap for the Global Energy Sector; International Energy Agency: Paris, France, 2021. [Google Scholar]
  9. US DOE. A Common Definition for Zero Energy Buildings. 2015. Available online: https://www.energy.gov/ (accessed on 22 June 2023).
  10. Directive 2010/31/EU of the European Parliament and of the Council of 19 May 2010 on the Energy Performance of Buildings (Recast); Official Journal of the European Union: Brussels, Belgium, 2010; Volume 153, Available online: https://eur-lex.europa.eu/LexUriServ/LexUriServ.do?uri=OJ:L:2010:153:0013:0035:EN:PDF (accessed on 26 June 2023).
  11. IEA. Perspectives for the Clean Energy Transition: The Critical role of Buildings; International Energy Agency: Paris, France, 2019. [Google Scholar]
  12. Kisyov, P. Increasing Building’s Self-Sufficiency Rates through PV plus Storage Hybrids. J. Phys. Conf. Ser. 2022, 2339, 012023. [Google Scholar] [CrossRef]
  13. Luthander, R.; Widén, J.; Nilsson, D.; Palm, J. Photovoltaic Self-Consumption in Buildings: A Review. Appl. Energy 2015, 142, 80–94. [Google Scholar] [CrossRef]
  14. Australian Renewable Energy Agency. Solar Energy. 2022. Available online: http://bit.ly/3XbWa8z (accessed on 26 June 2023).
  15. Koroneos, C.; Polyzakis, A. Energy and Exergy Analysis of the Greek Hotel Sector: An Application. Energy Build. 2009, 41, 402–406. [Google Scholar]
  16. Zografakis, N.; Gillas, K.; Pollaki, A.; Profylienou, M.; Bounialetou, F.; Tsagarakis, K.P. Assessment of Practices and Technologies of Energy Saving and Renewable Energy Sources in Hotels in Crete. Renew. Energy 2011, 36, 1323–1328. [Google Scholar] [CrossRef]
  17. Karagiorgas, M.; Tsoutsos, T.; Moiá-Pol, A. A Simulation of the Energy Consumption Monitoring in Mediterranean Hotels. Energy Build. 2007, 39, 416–426. [Google Scholar] [CrossRef]
  18. Dascalaki, E.; Balaras, C.A. XENIOS—A Methodology for Assessing Refurbishment Scenarios and the Potential of Application of RES and RUE in Hotels. Energy Build. 2004, 36, 1091. [Google Scholar] [CrossRef]
  19. Karagiorgas, M.; Tsoutsos, T.; Drosou, V.; Pouffary, S.; Pagano, T.; Lara, G.; Melimmendes, J. HOTRES: Renewable Energies in the Hotels. An Extensive Technical Tool for the Hotel Industry. Renew. Sustain. Energy Rev. 2006, 10, 198–224. [Google Scholar] [CrossRef]
  20. Vourdoubas, J. The Impacts of COVID-19 Pandemic on Tourism Industry in The Island of Crete, Greece. Ejsocial 2023, 3, 72–80. [Google Scholar] [CrossRef]
  21. Ali, Y.; Mustafa, M.; Al-Mashaqbah, S.; Mashal, K.; Mohsen, M. Potential of Energy Savings in the Hotel Sector in Jordan. Energy Convers. Manag. 2008, 49, 3391–3397. [Google Scholar] [CrossRef]
  22. Zhang, T.; Wang, M.; Yang, H. A Review of the Energy Performance and Life-Cycle Assessment of Building-Integrated Photovoltaic (BIPV) Systems. Energies 2018, 11, 3157. [Google Scholar] [CrossRef]
  23. Graham, P.; Wang, D.; Braslavsky, J.; Reedman, L. Projections for Small-Scale Embedded Technologies; Technical Report; CSIRO: Canberra, Australia, 2018; pp. 8–65. Available online: https://www.aemo.com.au/ (accessed on 29 June 2023).
  24. Le, T.S.; Nguyen, T.N.; Bui, D.-K.; Ngo, T.D. Optimal Sizing of Renewable Energy Storage: A Techno-Economic Analysis of Hydrogen, Battery and Hybrid Systems Considering Degradation and Seasonal Storage. Appl. Energy 2023, 336, 120817. [Google Scholar] [CrossRef]
  25. Zhang, Y.; Lundblad, A.; Campana, P.E.; Yan, J. Comparative Study of Battery Storage and Hydrogen Storage to Increase Photovoltaic Self-Sufficiency in a Residential Building of Sweden. Energy Procedia 2016, 103, 268–273. [Google Scholar] [CrossRef]
  26. Moshövel, J.; Kairies, K.-P.; Magnor, D.; Leuthold, M.; Bost, M.; Gährs, S.; Szczechowicz, E.; Cramer, M.; Sauer, D.U. Analysis of the Maximal Possible Grid Relief from PV-Peak-Power Impacts by Using Storage Systems for Increased Self-Consumption. Appl. Energy 2015, 137, 567–575. [Google Scholar] [CrossRef]
Figure 1. Annual and maximum hourly consumption of 2022.
Engproc 60 00007 g001
Figure 2. Monthly energy consumption of 2022.
Engproc 60 00007 g002
Figure 3. Monthly energy maximum consumption of 2022.
Engproc 60 00007 g003
Figure 4. Energy consumption of August 2022.
Engproc 60 00007 g004
Figure 5. Weekly consumption pattern (8–14 August 2022).
Engproc 60 00007 g005
Figure 6. Calculation of battery output in each hour.
Engproc 60 00007 g006
Figure 7. Calculation of battery storage level after each hour.
Engproc 60 00007 g007
Figure 8. Computation of energy imported from the grid.
Engproc 60 00007 g008
Figure 9. Calculation of rejections of the system in each hour.
Engproc 60 00007 g009
Figure 10. Calculation of energy system losses in each hour.
Engproc 60 00007 g010
Figure 11. Annual self-sufficiency with respect to PV power.
Engproc 60 00007 g011
Figure 12. Relationship between self-sufficiency and storage capacity.
Engproc 60 00007 g012
Figure 13. Three-dimensional plot ranges of PV power and storage capacity.
Engproc 60 00007 g013
Figure 14. Correlation between CAPEX, PV and Storage.
Engproc 60 00007 g014
Table 1. Indicative sets of PV power and capacity with the corresponding CAPEX.
PV Power (kW)Capacity (kWh)CAPEX (€)
720019,80012,150,000
740019,00012,150,000
760018,40012,200,000
780018,00012,300,000
800017,60012,400,000
Disclaimer/Publisher’s Note: The statements, opinions and data contained in all publications are solely those of the individual author(s) and contributor(s) and not of MDPI and/or the editor(s). MDPI and/or the editor(s) disclaim responsibility for any injury to people or property resulting from any ideas, methods, instructions or products referred to in the content.

