Proceeding Paper

Algal Organic Matter Fluorescence Analysis of Chlorella sp. for Biomass Estimation †

1
Environment and Remote Sensing Research (EARTH) Laboratory, Department of Physics, College of Science, De La Salle University, 1004 Taft Avenue, Manila 0922, Philippines
2
Division of Physical Sciences and Mathematics, College of Arts and Sciences, University of the Philippines Visayas, Miagao 5023, Philippines
3
Department of Physics, College of Arts and Sciences, Visayas State University, Visca, Baybay City 6521, Philippines
4
Graduate School of Engineering, Chiba University, 1-33 Yayoi-cho, Inage-ku, Chiba 263-8522, Japan
*
Author to whom correspondence should be addressed.
Presented at the 10th International Electronic Conference on Sensors and Applications (ECSA-10), 15–30 November 2023; Available online: https://ecsa-10.sciforum.net/
Eng. Proc. 2023, 58(1), 80; https://doi.org/10.3390/ecsa-10-16220
Published: 15 November 2023

Abstract

:
Algal Organic Matter (AOM) is derived from the dissolved organic matter composition of the algal species being observed. In this study, excitation–emission fluorescence spectroscopy was used to determine Chlorella sp.’s AOM and pigment characteristics in varying algal biomass concentrations. The AOM and pigment characteristics were observed at 400–600 nm and 600–800 nm fluorescence emission, respectively, with an excitation spectrum of 300–450 nm. F450/680 was computed based on the ratio between the dissolved organic matter contribution at 450 nm and chlorophyll-a at 680 nm. F450/680 positively correlated with algal biomass (r = 0.96) at an excitation wavelength of 405 nm. This study is a good reference for those interested in algal biomass estimation and production in natural waters.

1. Introduction

Algae are mostly abundant in rivers and reservoirs connected to drinking water facilities and factories [1,2]. With rapid urbanization and industrialization, effluents can severely affect the environment. This may result in an increase in algal organic matter (AOM) in surface waters. Organic substances produced by algae lead to water discoloration, odor and toxicity problems, and algal blooms [3,4,5].
Different techniques have been used to characterize organic matter in aquatic systems, which can be used to understand the composition of AOM in natural waters. These include specific ultraviolet absorption (SUVA), excitation–emission matrix (EEM) fluorescence spectroscopy, and lidar systems [6,7,8,9]. These techniques are promising tools for understanding the behaviors and composition of AOM and the pigment chlorophyll-a in natural waters.
The behavior and composition of Chlorella sp. has been studied using spectroscopic techniques. We aimed to study excitation–emission (Ex/Em) pairs for algal organic matter and pigment measurement in natural waters. This EEM fluorescence analysis may improve the existing portable fluorescence lidar systems used in algal biomass estimation. A specific fluorescence ratio was used to understand the contributions of chlorophyll-a and AOM in the different growth phases of microalgae. The in situ and real-time monitoring technique was the focus of this study, as it provides new information with faster interpretation.

2. Materials and Methods

2.1. Algal Preparation

Chlorella sp. inoculum was provided by the Microalgae Systematics and Applied Phycology Research Unit of De La Salle University using a BG-11 culture medium. The initial optical density was 0.6, with a pH between 8 and 9. The light/dark cycle was controlled at 12 h/12 h, with a light intensity of 75 μmol/m2/s.
The extracted AOM was obtained via the following processes. The algal supernatant was processed through centrifugation at 8000 r·min−1 for 5 min. It was then filtered with deionized water using 0.47 μm glass filter fiber (Whatman, Marlborough, MA, USA).

2.2. Spectral Characterization

2.2.1. Measuring UV-Vis Using Absorbance Spectroscopy

The aromaticity, size, and aromatic substances of algae can be interpreted by measuring SUVA254. The protein-like structures of algae can also be characterized by measuring SUVA280. The method performed was based on the characterization of water quality in rivers and estuaries [10,11].

2.2.2. Measuring Fluorescence Using Excitation–Emission Spectroscopy

The fluorescence measurements, expressed in normalized units, described in this paper are the EEM of AOM and their pigments at varying biomass concentrations. Excitation–emission pairs were obtained by changing the excitation wavelength at 5 nm intervals. A 3D EEM of varying algal biomass and pigments of Chlorella sp. was analyzed. A detailed discussion on the fluorescence set-up and data analysis is provided in our previous paper on algal growth and real-time monitoring in natural waters [12,13,14].

2.3. The Application of the EEM to Fluorescence Lidar Measurements

The fluorescence EEM provides preliminary guidelines for constructing a fluorescence lidar by identifying excitation–emission combinations. This study explores the possibility of using fluorescence intensity profiles with 380 nm and 405 nm excitation wavelengths. The region of interest for AOM is 400–600 nm, and the region of interest for pigment measurements is 600–800 nm. Developing a fluorescence lidar system for biomass estimation is recommended since it is an in situ and non-invasive technique.

2.4. Comparisons of the Fluorescence EEM

In recent studies, biomass measurements have been taken using indirect or direct techniques. The results from the introduced fluorescence ratio are correlated (Pearson’s r) with optical density measurements, biomass estimation, and estimated chlorophyll-a concentrations.

3. Results and Discussion

The growth of Chlorella sp. in controlled culture media was analyzed for its AOM, and its pigments were analyzed for biomass estimation. The fluorescence EEM is crucial in developing a new fluorescence lidar system for biomass estimation.

3.1. The Spectral Characterization of Chlorella sp.

The variance in the SUVA254 and SUVA280 in varying biomass are shown in Figure 1a. The SUVA254 measured in the AOM ranges from 0.3 to 1.4 L mg−1·m−1. This means that the aromaticity of AOM is low, indicating a smaller number of protein-like substances [15]. The same trend was observed between SUVA254 and SUVA280, which shows a positive correlation between aromaticity and protein-like structures (r = 0.89, p < 0.05). These changes in organic matter from the logarithmic phase to the decline phase are helpful in algal growth monitoring.
The fluorescence intensity results from the 3D EEMs at varying algal biomass are presented in Figure 1b. The fluorescence EEMs, based on Ex/Em peaks, are valuable for distinguishing different types of organic matter components and types of natural waters. All algal biomass showed similar fluorescence EEM trends for the AOM and pigments. The total organic matter contribution was measured at a fluorescence emission wavelength of 450 nm [16]. Fluorescence emission spectroscopy is commonly used for surface water and terrestrial systems [17]. The observed excitation/emission pairs for algal organic matter are 385 nm/405 nm and 405 nm/450 nm. Higher fluorescence intensity profiles were measured using 405 nm/450 nm, but no significant differences were shown at 385 nm/450 nm (p < 0.05).
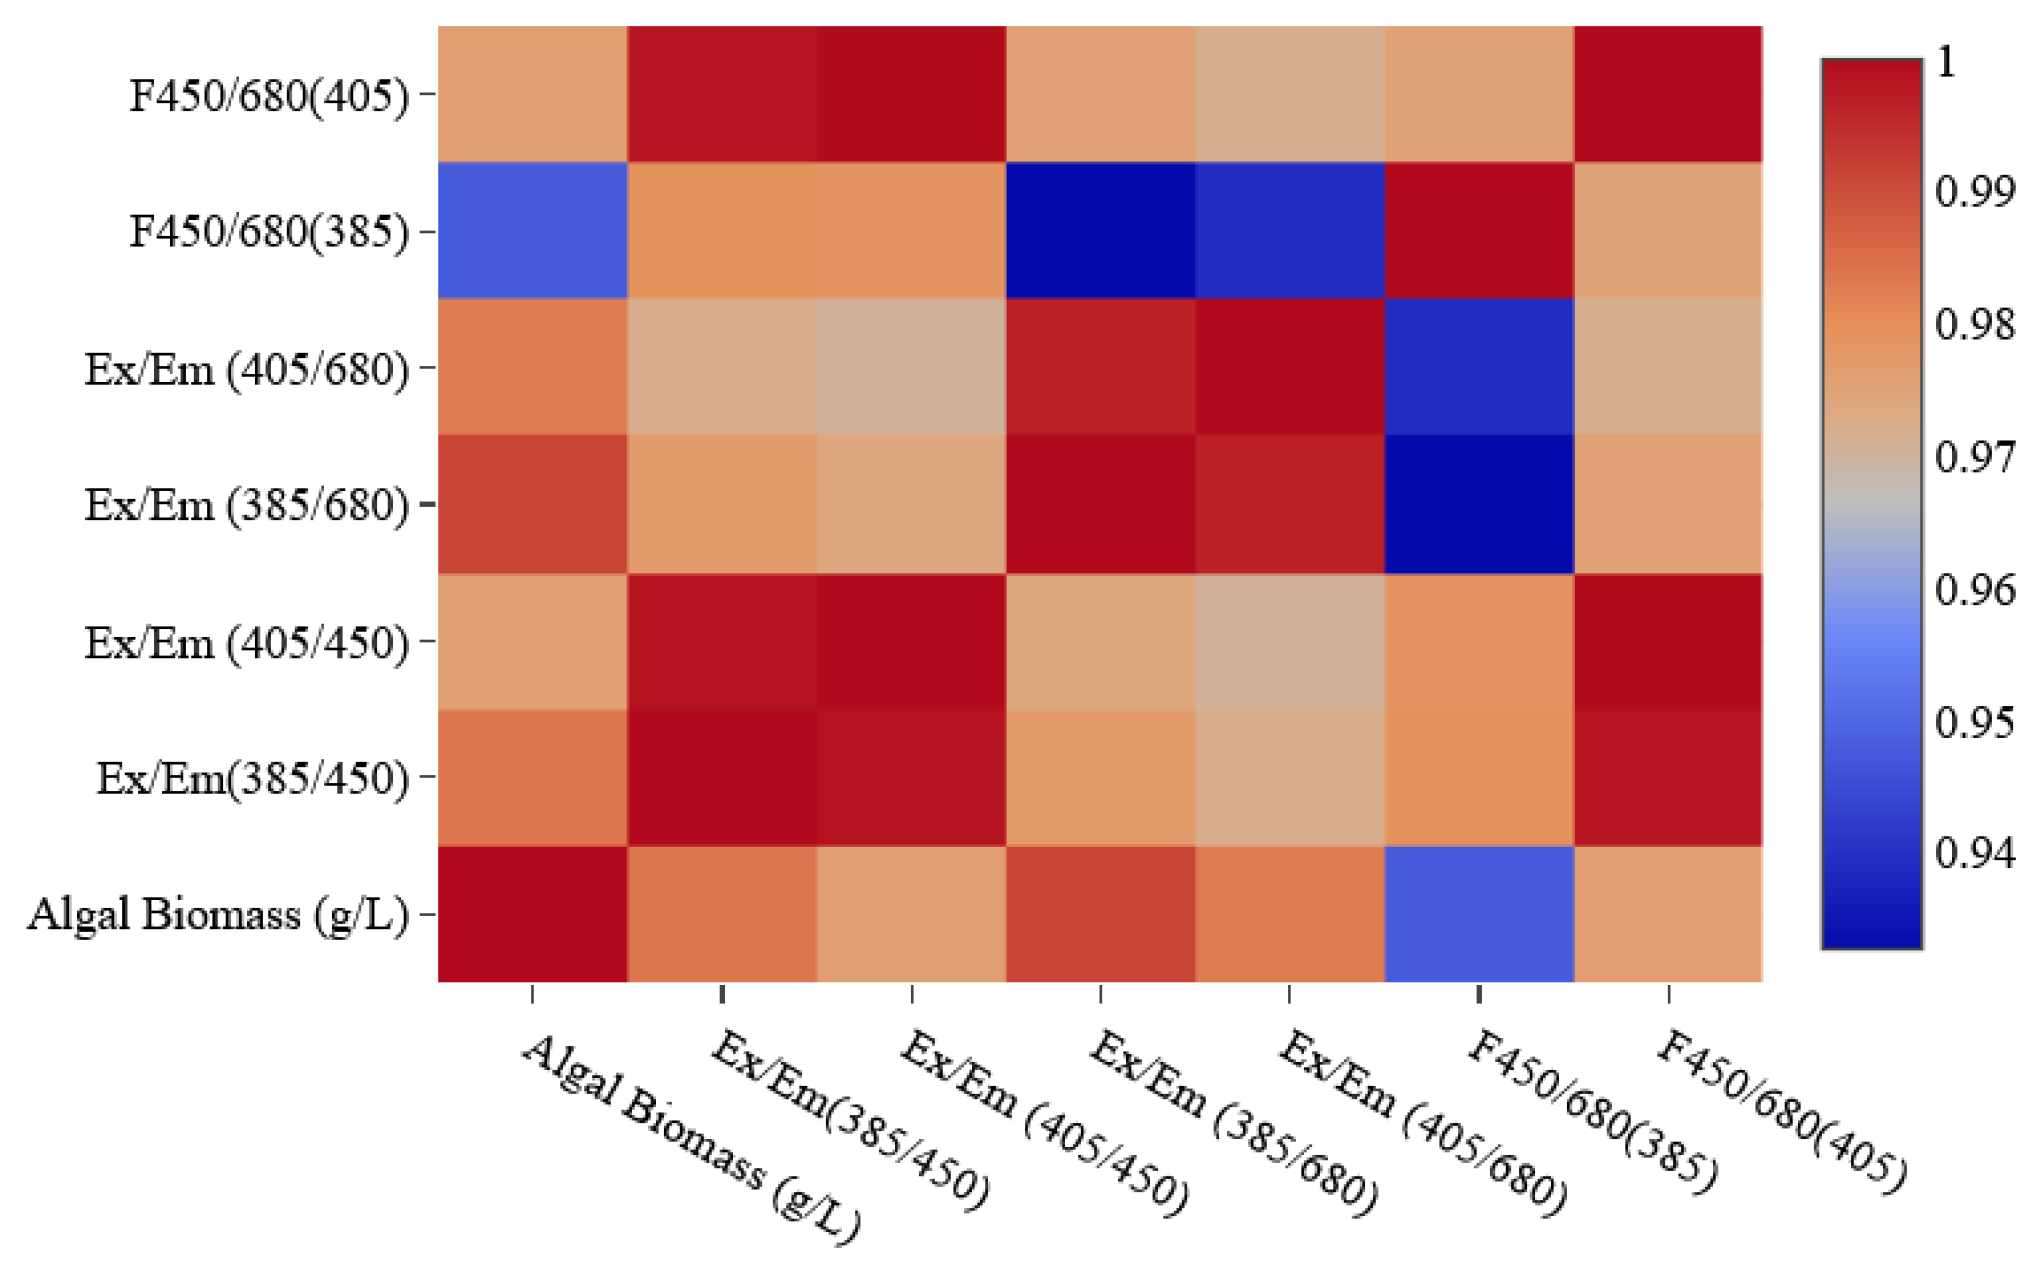
The same trend was reflected in the 405 nm/680 nm and 385 nm/680 nm pairs for our measurement of chlorophyll-a (p < 0.05). The mean values were compared using Pearson’s r correlation (p < 0.05), as shown in Figure 2. The Ex/Em 385 nm/450 nm pair showed a higher correlation compared to the Ex/Em 405 nm/450 nm with the algal biomass concentration. This was also the case when using a fluorescence emission wavelength of 680 nm. On the other hand, the fluorescence ratio showed opposite results. F450/680 at an excitation wavelength of 405 nm (r = 0.96) positively correlates with F450/680 at an excitation wavelength of 385 nm (r = 0.94) with algal biomass. This F-ratio is recommended to understand the dry-weight algal biomass in natural waters.

3.2. The Analysis of the Fluorescence EEM regarding the Development of the Lidar System

Developing a portable fluorescence lidar system is vital for the real-time monitoring and estimation of algal biomass in natural waters. With the guidance of the excitation–emission pairs used in this study, improving the existing fluorescence lidar system with a new excitation wavelength at 405 nm is recommended. Simultaneous measurements at 450 and 680 nm are also suggested to understand the behavior of AOM and the chlorophyll concentrations of microalgae, respectively (Figure 3). F450/680 was used to calculate dry-weight measurements of algal biomass of Chlorella sp. for excitation wavelengths of 385 nm and 405 nm. Similar trends were observed, but a higher positive correlation was computed at an excitation wavelength of 405 nm.
The developed fluorescence lidar system discussed in our previous study showed its unique features and robustness [13,14]. It uses a pulsed LED circuit at an excitation wavelength of 385 nm, which serves as a transmitting system. With our new understanding of Ex/Em pairs, we suggest the development of a portable pulsed laser diode (LD) at an excitation wavelength of 405 nm. This study paves the way for the discovery of a new technique for developing a fluorescence lidar system using excitation–emission pairs [8].

Author Contributions

Conceptualization, J.C., J.R.L. and J.B.; methodology, J.C.; validation, formal analysis, J.C., J.R.L., J.B. and T.S.; investigation, J.C.; writing—original draft preparation, J.C., J.R.L. and J.B.; writing—review and editing, J.C., M.C.G., E.V. and T.S.; supervision, M.C.G., E.V. and T.S.; funding acquisition, M.C.G. and T.S. All authors have read and agreed to the published version of the manuscript.

Funding

This study received no external funding.

Institutional Review Board Statement

Not Applicable.

Informed Consent Statement

Not Applicable.

Data Availability Statement

Data are contained within the article, further inquiries can be directed to the corresponding author.

Acknowledgments

The authors would like to acknowledge the support they received from the University of the Philippines Visayas, De La Salle University, Chiba University, Department of Science and Technology-Accelerated Science and Technology Human Resource Development Program, and Visayas State University. We also thank DLSU-URCO project No. 16 IR2TAY19-2TAY21 for supporting this project.

Conflicts of Interest

The authors declare no conflicts of interest.

References

  1. Ebrahimzadeh, G.; Alimohammdi, M.; Kahkah, M.; Mahvi, A.H. Relationship between algae diversity and water quality-a case study: Chah Niemeh reservoir Southeast of Iran. J. Environ. Health Sci. Eng. 2021, 19, 437–443. [Google Scholar] [CrossRef] [PubMed]
  2. Feng, J.; Zhou, L.; Zhao, X.; Chen, J.; Li, Z.; Liu, Y.; Ou, L.; Xie, Z.; Wang, M.; Yin, X.; et al. Evaluation of environmental factors and microbial community structure in an important drinking-water reservoir across seasons. Front. Microbiol. 2023, 14, 1091818. [Google Scholar] [CrossRef] [PubMed]
  3. Caron, D.A.; Garneau, M.E.; Seubert, E.; Howard, M.D.A.; Darjany, L.; Schnetzer, A.; Cetinic, I.; Filteau, G.; Lauri, P.; Jones, B.; et al. Harmful algae and their potential impacts on desalination operations off southern California. Water Res. 2010, 44, 385–416. [Google Scholar] [CrossRef] [PubMed]
  4. Villacorte, L.O.; Ekowati, Y.; Neu, T.R.; Kleijn, J.M.; Winters, H.; Amy, G.; Schippers, J.C.; Kennedy, M.D. Characterisation of algal organic matter by bloom-forming marine and freshwater algae. Water Res. 2015, 73, 216–230. [Google Scholar] [CrossRef] [PubMed]
  5. Du, Y.; An, S.; He, H.; Wen, S.; Xing, P.; Duan, H. Production and transformation of organic matter driven by algal blooms in a shallow lake: Role of sediments. Water Res. 2022, 219, 118560. [Google Scholar] [CrossRef] [PubMed]
  6. Chu, H.; Yu, H.; Tan, X.; Zhang, Y.; Zhou, X.; Yang, L.; Li, D. Extraction procedure optimization and the characteristics of dissolved extracellular organic matter (bEOM) from chlorella pyrenoidosa. Coll. Surf. B Biointerfaces 2015, 125, 238–246. [Google Scholar] [CrossRef] [PubMed]
  7. Tan, L.; Zhang, Z.; Wang, Z.; Zhang, P.; Xiong, C.; Kuang, Y.; Peng, X.; Yu, M.; Qian, Y. Compositional variations in algal organic matter during distinct growth phases in karst water. Front. Environ. Sci. 2023, 11, 1112522. [Google Scholar]
  8. Saito, Y.; Hosokawa, T.; Shiraishi, K. Collection of excitation-emission-matrix fluorescence of aerosol-candidate-substances and its application to fluorescence lidar monitoring. Appl. Opt. 2022, 61, 653–660. [Google Scholar] [CrossRef] [PubMed]
  9. Cadondon, J.G.; Vallar, E.A.; Beltran, A.B.; Orbecido, A.H.; Galvez, M.C.D. Variation in Dissolved Organic Matter Using Absorbance and Fluorescence Measurements during Dry Season in St. Rosa and Cabuyao Rivers, Philippines. Water 2022, 14, 1444. [Google Scholar] [CrossRef]
  10. Lal, P.P.; Juste-Poinapen, M.S.N.; Poinapen, J. Assessing the water quality of Suva foreshore for the establishment of estuary and marine recreational water guidelines in the Fiji Islands. Water Sci. Technol. 2021, 84, 3040–3054. [Google Scholar] [CrossRef] [PubMed]
  11. Sanyal, P.; Ray, R.; Paul, M.; Gupta, V.K.; Acharya, A.; Bakshi, S.; Jana, T.K.; Mukhopadhyay, S.K. Assessing the Dynamics of Dissolved Organic Matter (DOM) in the Costal Environments Dominated by Mangroves, Indian Sundarbans. Front. Earth Sci. 2020, 8, 218. [Google Scholar] [CrossRef]
  12. Cadondon, J.; Vallar, E.; Belo, L.; Orbecido, A.; Galvez, M.C. UV-Vis Absorbance and Fluorescence Characterization of Pasig River Surface Water Samples Towards the Development of an LED Fluorescence Lidar System. Int. J. Adv. Sci. Eng. Inf. Technol. 2021, 11, 968–980. [Google Scholar] [CrossRef]
  13. Cadondon, J.G.; Ong, P.M.B.; Vallar, E.A.; Shiina, T.; Galvez, M.C.D. Chlorophyll-a pigment measurement of spirulina in algal growth monitoring using portable pulsed LED fluorescence lidar system. Sensors 2022, 22, 2940. [Google Scholar] [CrossRef]
  14. Cadondon, J.G.; Vallar, E.A.; Shiina, T.; Galvez, M.C.D. Real-time Chlorophyll-a Pigment Monitoring of Chlamydomonas reinhardtii in a Controlled Environment Using Pulsed LED Fluorescence LiDAR System. Photonics 2023, 10, 144. [Google Scholar] [CrossRef]
  15. Li, L.; Gao, N.; Deng, Y.; Yao, J.; Zhang, K. Characterization of intracellular & extracellular algae organic matters (AOM) of Microcystic aeruginosa and formation of AOM-associated disinfection byproducts and odor & taste compounds. Water Res. 2012, 46, 1233–1240. [Google Scholar] [PubMed]
  16. Lee, S.; Park, J. Identification of Dissolved Organic Matter Origin Using Molecular Level Analysis Methods. Water 2022, 14, 1317. [Google Scholar] [CrossRef]
  17. Harjung, A.; Schweichhart, J.; Rash, G.; Griebler, C. Large-scale study on groundwater dissolved organic matter reveals a strong heterogeneity and a complex microbial footprint. Sci. Total Environ. 2023, 854, 158542. [Google Scholar] [CrossRef] [PubMed]
Figure 1. (a) Whisker and box plot of AOM in different growth phases. This figure represents the absorbance at SUVA254 and SUVA280 (n = 6). (b) Fluorescence intensity from the 3D EEMs at varying algal biomass concentrations.
Engproc 58 00080 g001
Figure 2. Heat map depicting the correlations between the Ex/Em pairs, F ratio, and algal biomass of Chlorella sp.
Engproc 58 00080 g002
Figure 3. Fluorescence EEMs of Chlorella sp. at 0.3 g/L. (a) Algal organic matter EEM showing Ex/Em 405 nm/450 nm and Ex/Em 385 nm/450 nm. (b) Chlorophyll-a pigment EEM showing Ex/Em 405 nm/680 nm and Ex/Em 385 nm/680 nm.
Engproc 58 00080 g003
Disclaimer/Publisher’s Note: The statements, opinions and data contained in all publications are solely those of the individual author(s) and contributor(s) and not of MDPI and/or the editor(s). MDPI and/or the editor(s) disclaim responsibility for any injury to people or property resulting from any ideas, methods, instructions or products referred to in the content.