Abstract
The forecast of the generation of electrical energy from the solar resource is associated with its uncertainty due to the meteorological variations that it presents. Solar power generation forecasts are important for the efficient operation of solar plants. This article shows a methodology entailing a multilayer neural network with backpropagation and input data from a model with time lag coordinates for a horizon of 24 h and beyond. The neural network model was compared with statistical and prediction models numerical time, resulting in a MAPE of 0.57% and a MAE of 69.29 W.
1. Introduction
Currently, economic development has increased disproportionately, causing greater energy demand throughout the world, putting the supply and demand of it at risk. To satisfy the need for energy, sources of conventional origin have been exploited; however, these compromise the health of living beings and the environment, which is why the use of sources of renewable origin with a low carbon ratio has been proposed [1].
Photovoltaics is an affordable, free, and easily accessible energy type that has proven to be a clean renewable source and is found in abundance almost everywhere in the world. Its use has increased in recent years, being incorporated into the energy repertoire in different parts of the world [2]. In 2021, fifty countries generated a tenth of their electricity from renewable sources, with photovoltaic energy standing out. In 2020 there were only 43 countries and in 2019 there were 36 [3], which indicates that more and more countries are betting on the development of research in the use of photovoltaic energy; however, this brings with it particular challenges posed by the intermittent origin of such renewable energies, such intermittency depending on their availability and variability [4].
The use of photovoltaic energy has been one of the topics of interest as a research objective in recent years. This is due to the growth of the clean energy industry and the commitments obtained at the United Nations Conference on Climate Change, the latter seeking the use of energy with a low carbon ratio [5], in addition to the increasing meteorological events that have directly affected the generation of electric power [6].
Large-scale photovoltaic power plants present difficulties in the management of the solar resource due to their intermittency, affecting the system of connection to the network, storage, and distribution; it is, therefore, necessary to protect the system from such adversities, which is why the search for more accurate and precise forecasts of photovoltaic energy is the development area of this work [7].
There are different methods to develop the prediction of electrical energy from renewables, such as: statistical models, Numerical Weather Prediction (NWP), Artificial Intelligence (AI), and hybrid models [8,9,10]. Each of the previous models has their best use and their respective areas for improvement.
Statistical models are based on the history of the data, that is, from past observations characteristics are obtained that help predict future data through the minimization of errors [11,12]. This approach depends on the quality of the data and their pre-processing; among the most used are: Autoregressive Models (AR), exponential smoothing model, Autoregressive Models and Moving Averages (ARMA), Autoregressive Models Integrated with Moving Averages (ARIMA), Autoregressive Models Integrated with Moving Averages with Seasonality (SARIMA) [13,14,15]. The models based on NWP are based on the physical-mathematical phenomena of meteorological and geological origin through atmospheric parameters, with their use enabling understanding of the current state of the atmosphere. The data are extracted through satellite stations and soil measurement devices, with the measurement instruments requiring constant monitoring and calibration [16,17]. On the other hand, models based on Artificial Intelligence have been widely used in recent years, since they allow the prediction of stochastic data so that photovoltaic and wind energy present such behavior in their observations [18], thus becoming a method that allows its development and improves its performance. In the case of hybrid methods, they are used to obtain the best qualities of each of the previously described methods and improve their performance [19,20].
Photovoltaic (PV) power forecasting is characterized by two types of models according to the time scale: ultrashort for data from seconds to hours and short term for next day observations [21]. The first model is used in real time, while the second is for planning the next day. Currently there are investigations that have been developed with the aim of providing a good prediction of photovoltaic energy, models have been proposed based on statistical methodologies, such as the case of models that use a SARIMA technique to generate information from their data. Past observations are later incorporated into a multilayer neural network with a backward propagation algorithm, where the selection of the parameters will achieve a prediction to an ultra-short horizon. Neural networks with short-term memory are a widely used technique due to their performance capacity; however, this type of network is improved with the contribution of other techniques. This is the case of models that use a convolutional neural network as a base [22], which is a type of classifying network. On the other hand, within the prediction models of photovoltaic energy, artificial intelligence techniques are used, as is the case of supervised learning machines that pre-treat their input elements and incorporate a linear regression for the correlation of their data [23]. There is a classification according to the efficiency of photovoltaic energy prediction models in which, according to the mean absolute percentage error, it establishes that the models that present a value less than 10% are accurate and reliable, a value between 10–20% indicates a good prediction, 20–50% means a reasonable prediction, and more than 50% indicates an inaccurate model [24].
The prediction models of photovoltaic energy are important and fundamental to avoid possible penalties to the operators of the photovoltaic power generation plants, reduce the risks of their connection to the electrical grid, and specify the use of energies with a low carbon ratio [25]. Its study is necessary for the development and fulfillment of the goals established to reduce climate change, as there are still areas of opportunity that must be explored to improve the performance of forecast models. Hybrid models have been shown to be capable of improving PV power prediction performance; however, they are not yet fully explored for development in research. Given the technological advances that have been developed in recent decades, this paper shows a methodology of a hybrid method that establishes:
- A technique that combines PV power prediction methods for a short-term scale for large amounts of data.
- The development of a model for the prediction of photovoltaic energy through neural networks that will have as input information the data of an embedding model with delay coordinates and will be compared with a clear sky model and a SARIMA.
- Finally, the proposed model will be validated with real data from a photovoltaic plant.
2. Materials and Methods
2.1. Data Acquisition
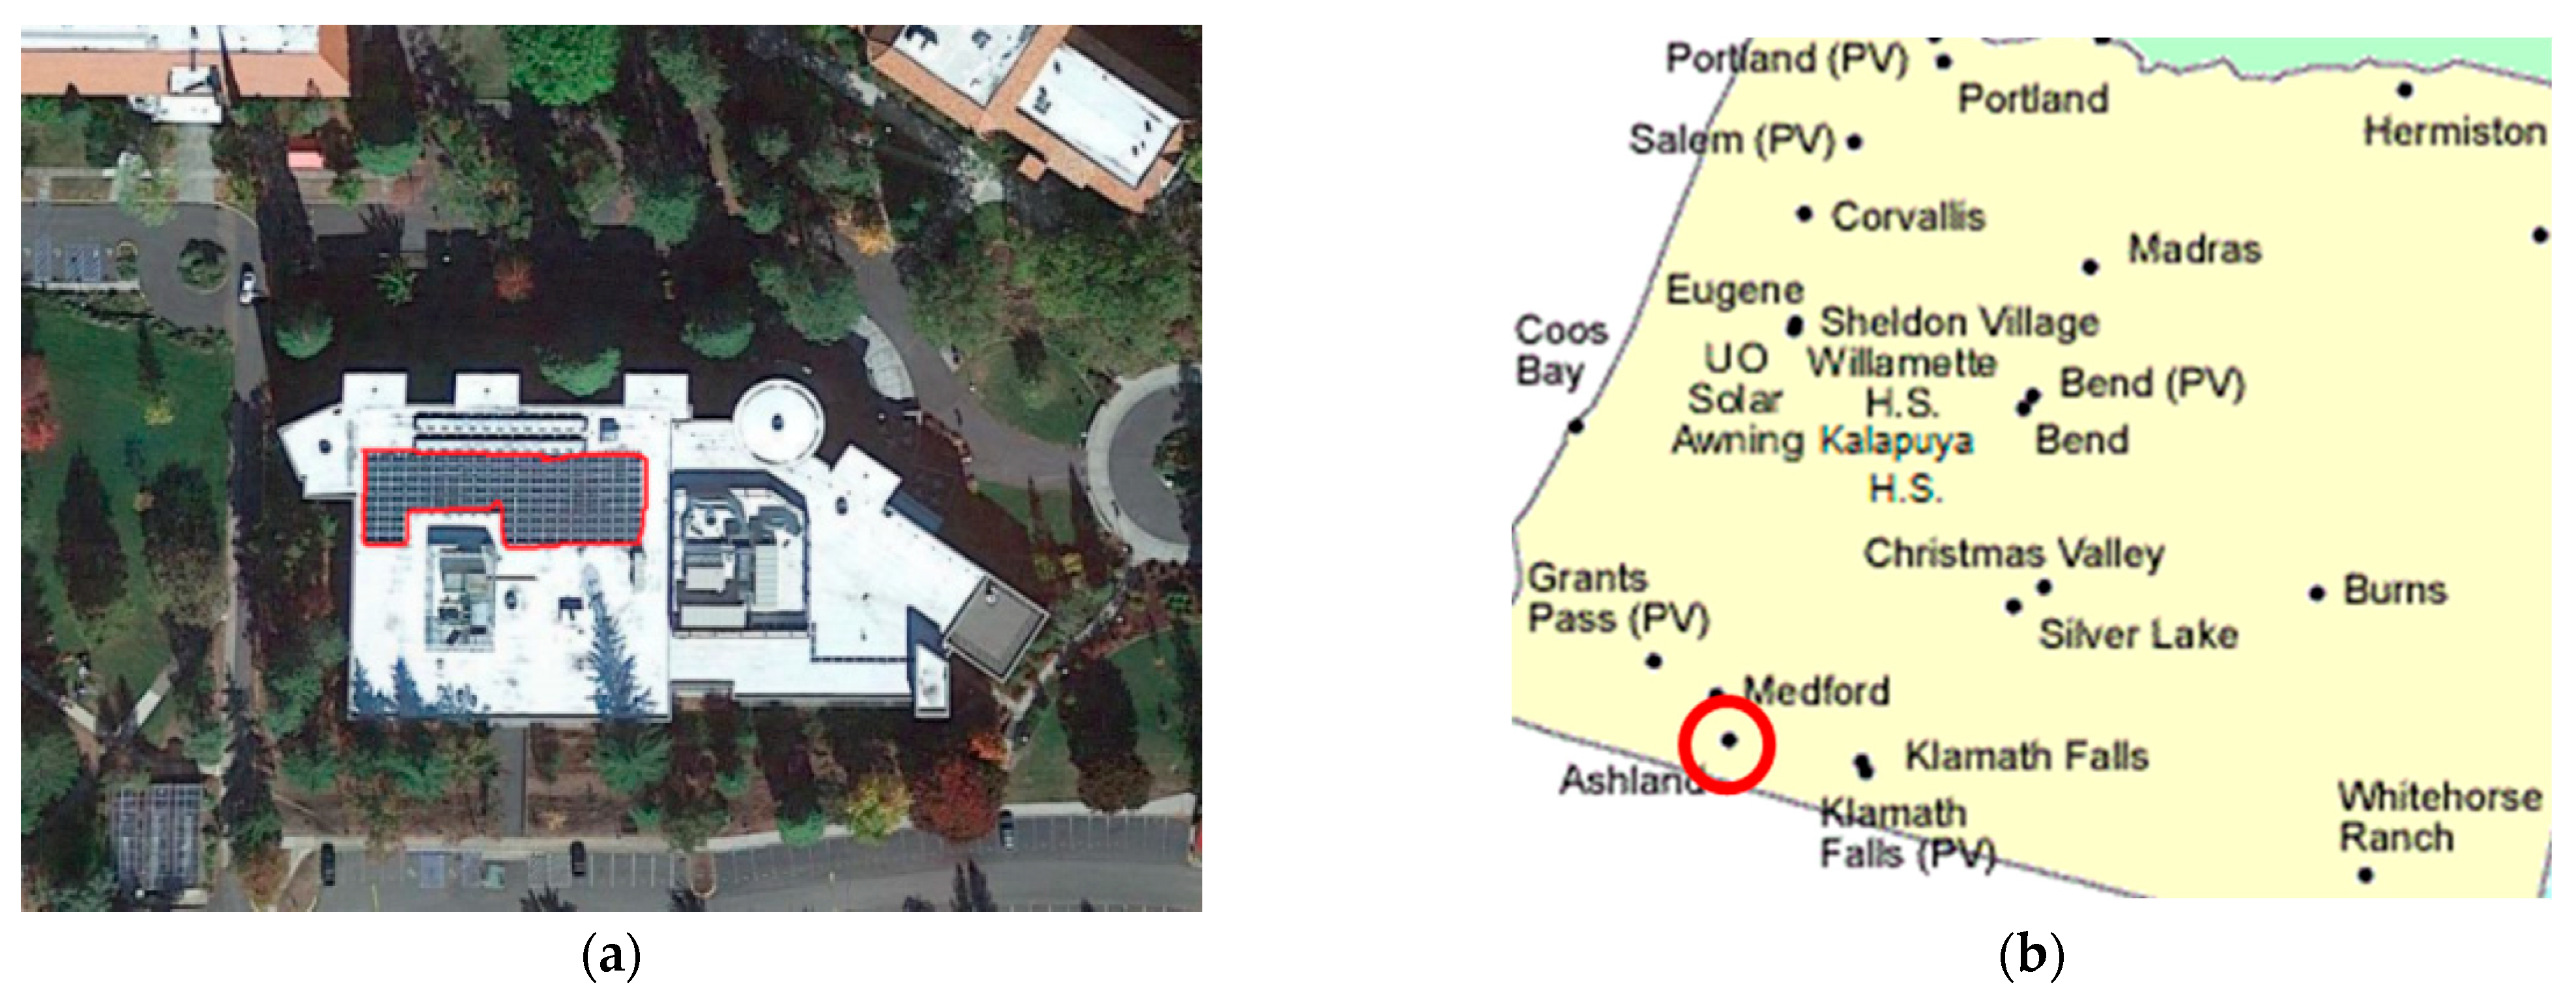
The acquisition of the database was obtained through the Solar Radiation Monitoring Laboratory of the University of Oregon, a free source that allows visualization of experimental data from its research projects. Figure 1 shows a satellite image of the photovoltaic array installation used as the objective of this investigation, which corresponds to daily observations of a system [26].
Figure 1.
Area of the study experiment. (a) The red line shows the array of a photovoltaic system in Ashland; (b)the red circle show the location of the photovoltaic array has a latitude of 42.19 and a longitude of 122.70 at an altitude of 595 m.
The database has 315,648 observations with a horizon resolution of every five minutes, the information period of the observations is from 1 January 2018 00:00 to 30 November 2021 23:55. Table 1 presents six variables of the photovoltaic array that were used to carry out the present experiments.

Table 1.
Variables extracted by Solar Radiation Monitoring Laboratory of the University of Oregon.
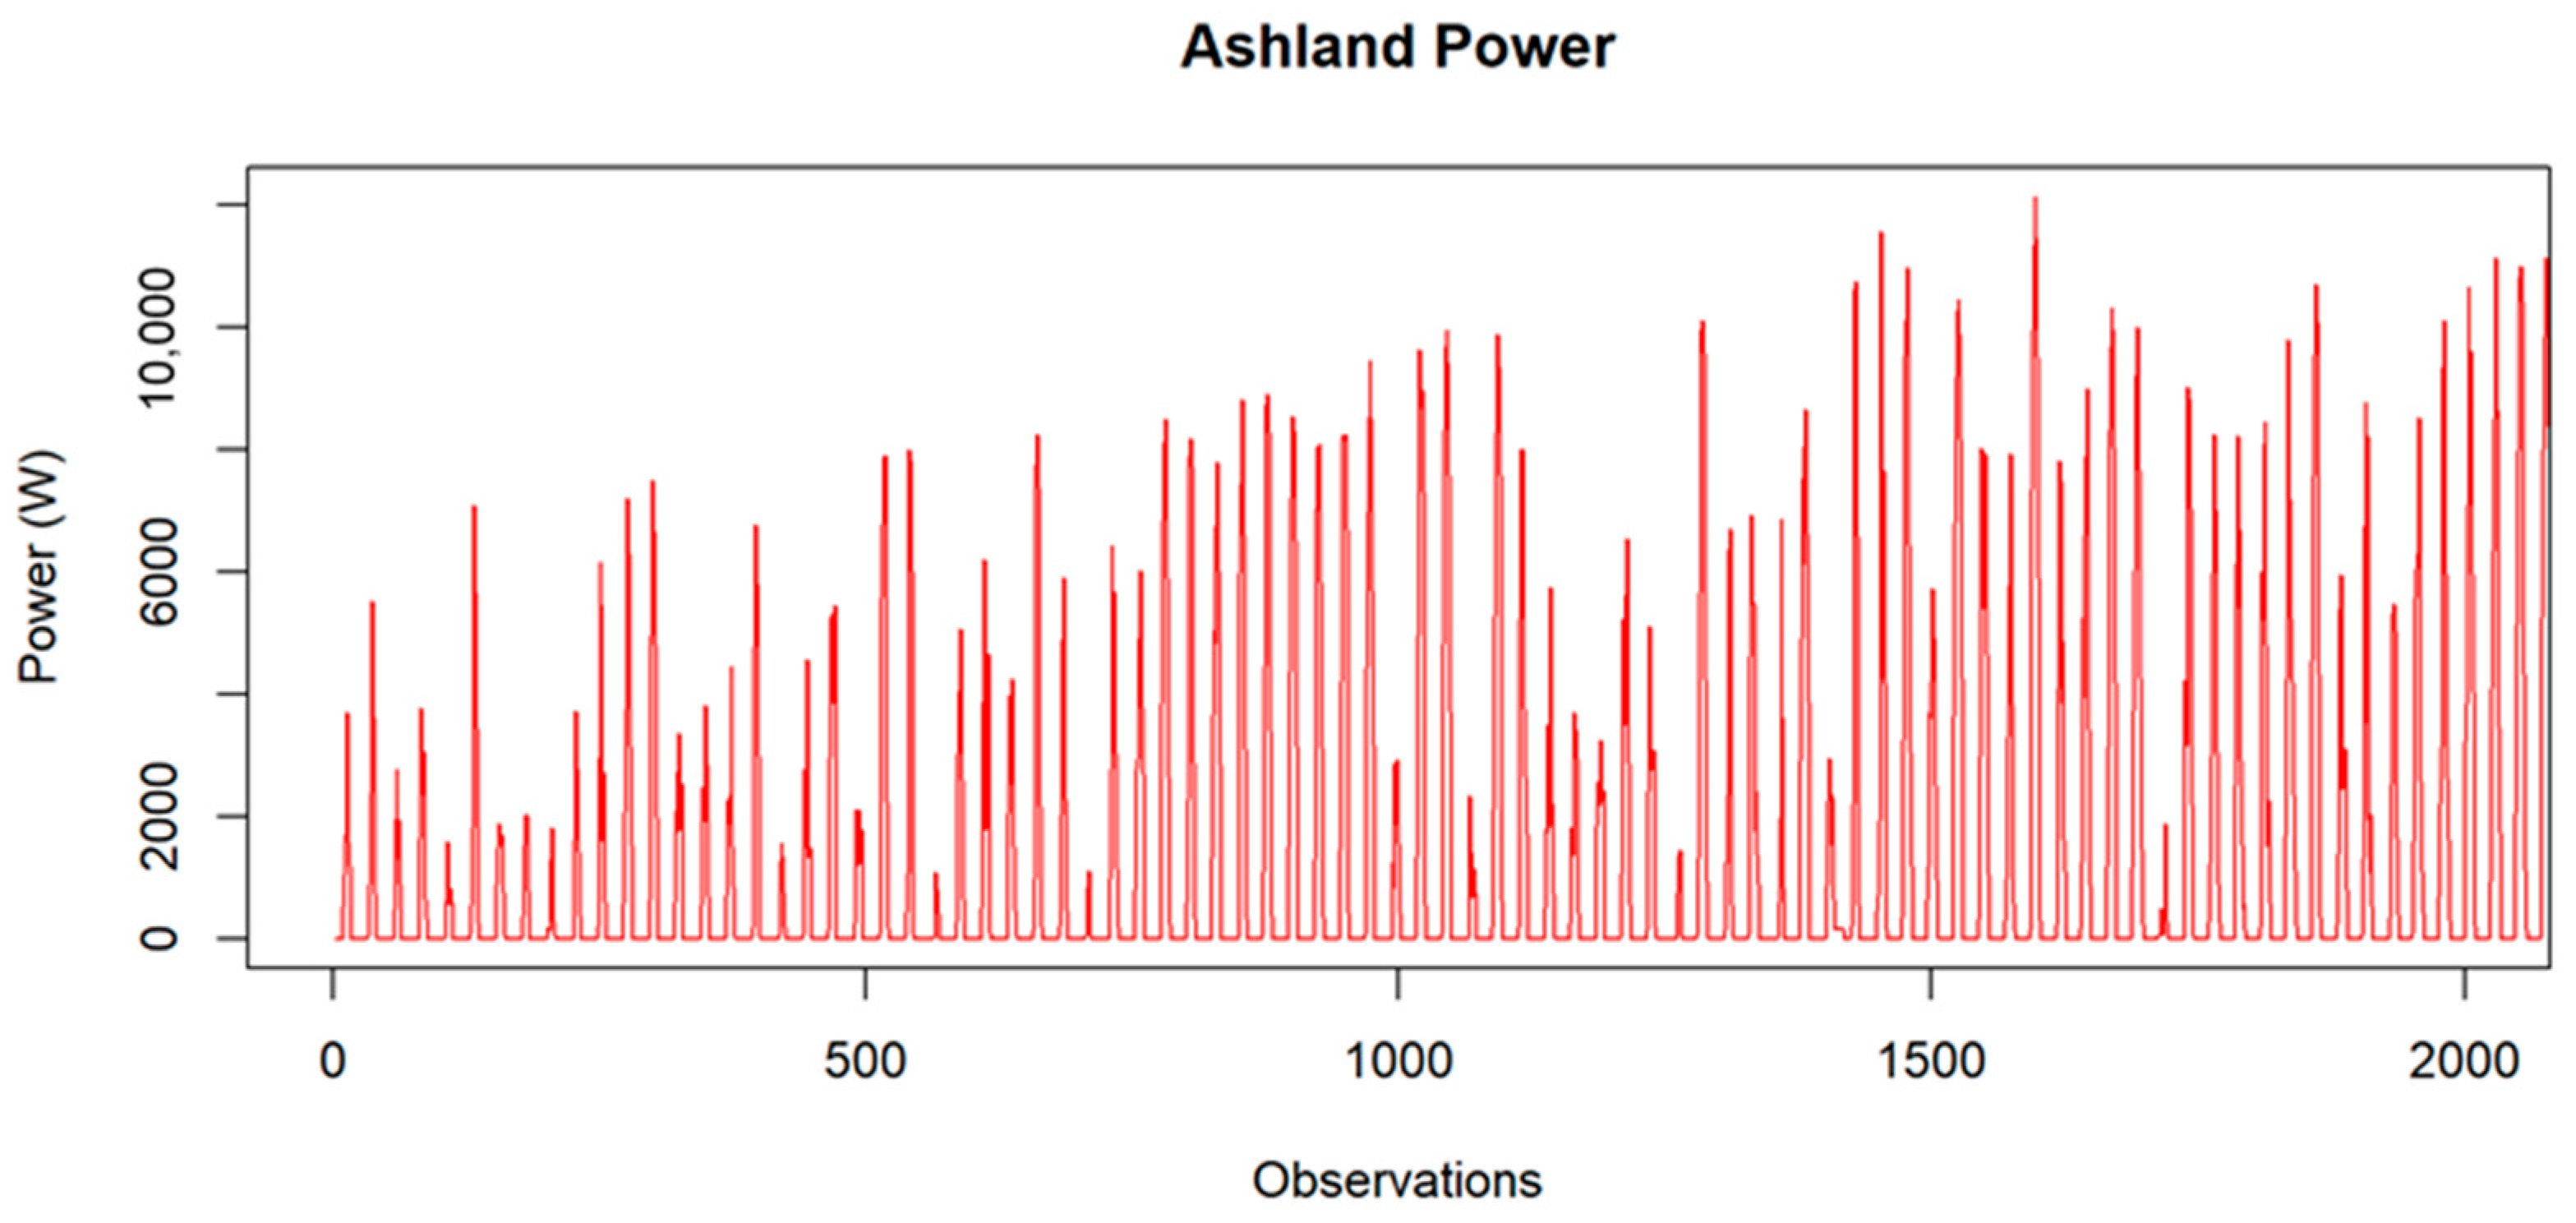
Figure 2 shows the time series of the first 2000 observation of the power variable. The behavior of the series is cyclical.
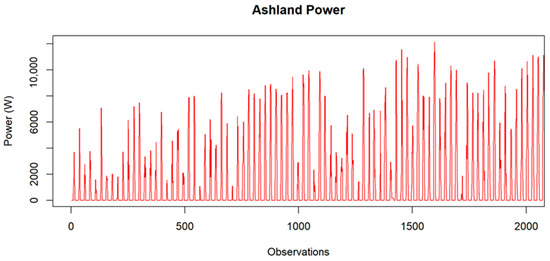
Figure 2.
Time series of the power a photovoltaic system.
The time series has a total of 1283 missing data, which corresponds to less than 10% of the total data, so a data imputation was applied by taking the last observation into consideration for the periods of missing hours. Table 2 shows the percentage of missing data according to the database variables.

Table 2.
Missing time series data.
Once the time series was completed, the following experiments were carried out in a sequential form:
Clear Sky Model
SARIMA Model
Lag Coordinate Embedding Model
Multilayer neural networks
2.2. Clear Sky Model
A clear sky model is based on the calculation of solar radiation transfer through algorithms designed for the simulation of the wavelength in the physical interactions between solar radiation and atmospheric particles. Equation (1) shows the calculation of global solar radiation:
where G is the global solar irradiance (, is the global irradiance of the clear sky (), and is the transmissivity of the clouds that model the system. To carry out the clear sky model, the apparent instantaneous movement of the sun was calculated using the equation of Cooper: the angle of inclination establishes the amount of solar radiation that reaches the earth, which is inversely proportional to the square of the distance from the sun [26]. Equation (2) shows the magnitudes to be considered in the angle of inclination according to the Cooper equation.
where is an arbitrary day of the year. To calculate the apparent movement of the sun, the latitude of Ashland was incorporated as reference data, which resulted in the global irradiance; later, based on the information from the photovoltaic array, an adjustment was made to the IV curve of the solar panel according to the characteristics of the manufacturer, in such a way that the output power of the system was calculated according to each observation. The clear sky model does not consider specific characteristics of the system or sudden changes of physical origin, such as: system damage, system maintenance, or a physical phenomenon with little anticipation, among others, so one of its main disadvantages is its characterization of ideal conditions of the environment and the system.
2.3. Autoregressive Model of Order Moving Averages with Seasonality (P, D, Q)s
The Integrated Autoregressive Model of Moving Averages of Order with Seasonality (P, D, Q)s is a combination of the autoregressive models AR (p) and moving averages MA (q), with seasonality of order p, d, q, with the particularity of including a restoration process called differences. In addition, it incorporates seasonality as a component for the forecast calculation of a variable, leaving the following order (P, D, Q)s. It is a model that works with past observations and has the ability to identify seasonal behavior in a time series. Equation (3) shows the variables considered for calculating the model:
where is the instantaneous moment of the forecast, is the autoregressive coefficient together with i.e., the normalized record of the time series to be modeled, is the moving average coefficient with its respective error term of each record, i.e., . Calculation of the model commences with the selection of 80% of its observations as training and the other remaining for testing, followed by a Dickey-Fuller test to identify if the time series is stationary; if it is not, the differences are calculated for its transformation.
The model obtained an array (4, 0, 3) (0, 1, 0) (288) which indicates that it considers four autoregressive values and three moving averages of past observations with no difference in a one-day seasonality, corresponding to 288 observations every five minutes.
2.4. Time Delay Coordinate Embedding Model
A Time Delay Coordinate Embedding model (TDC) consists of mapping the observations in different phases of space. The TDC model is useful for discovering effective coordinate systems to represent the dynamics of physical systems. Recently, models identified by dynamic mode decomposition into time lag coordinates have been shown to provide linear representations of strongly nonlinear systems. The use of significant models of complex non-linear systems from measurement data aims to potentiate and improve the characterization, prediction, and control of observations.
Takens and Sauer [27] established that if the sequence really consists of scalar measurements of the state of a dynamical system, then, under certain assumptions, the time delay embedding provides a one-to-one picture of the original ensemble, described by the following equation:
where is the time series observed at regular intervals, is the length of the time series, ( is the time lag, is the number of dimensions in which to embed , meaning that the time lag of the time series is large enough to provide information for the next instant in time. Figure 3 shows the structure of the TDC model. The column headers locate the dimensions of the experiments in the time series dynamically as ; the observation in the current time written as and two previous ones, for the forecast of the following observation, are based on these three observations resulting in , yielding the observation ; once the predicted value is established, the following observations are embedded successively within the same matrix.

Figure 3.
The Time Delay Coordinate model (past observations forecasting) Neural Networks.
Figure 4 also shows that, as the displacement of the dimensions given by is advanced, i.e., , the moment will come when there will be no observations that can continue to return results for the last forecasted observations and will be marked as NA (absence of data).
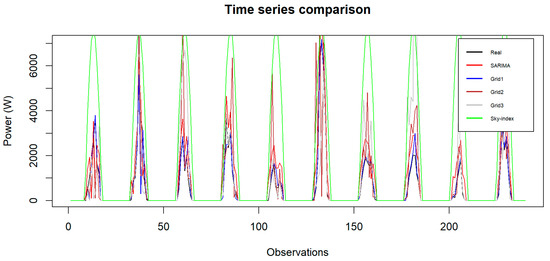
Figure 4.
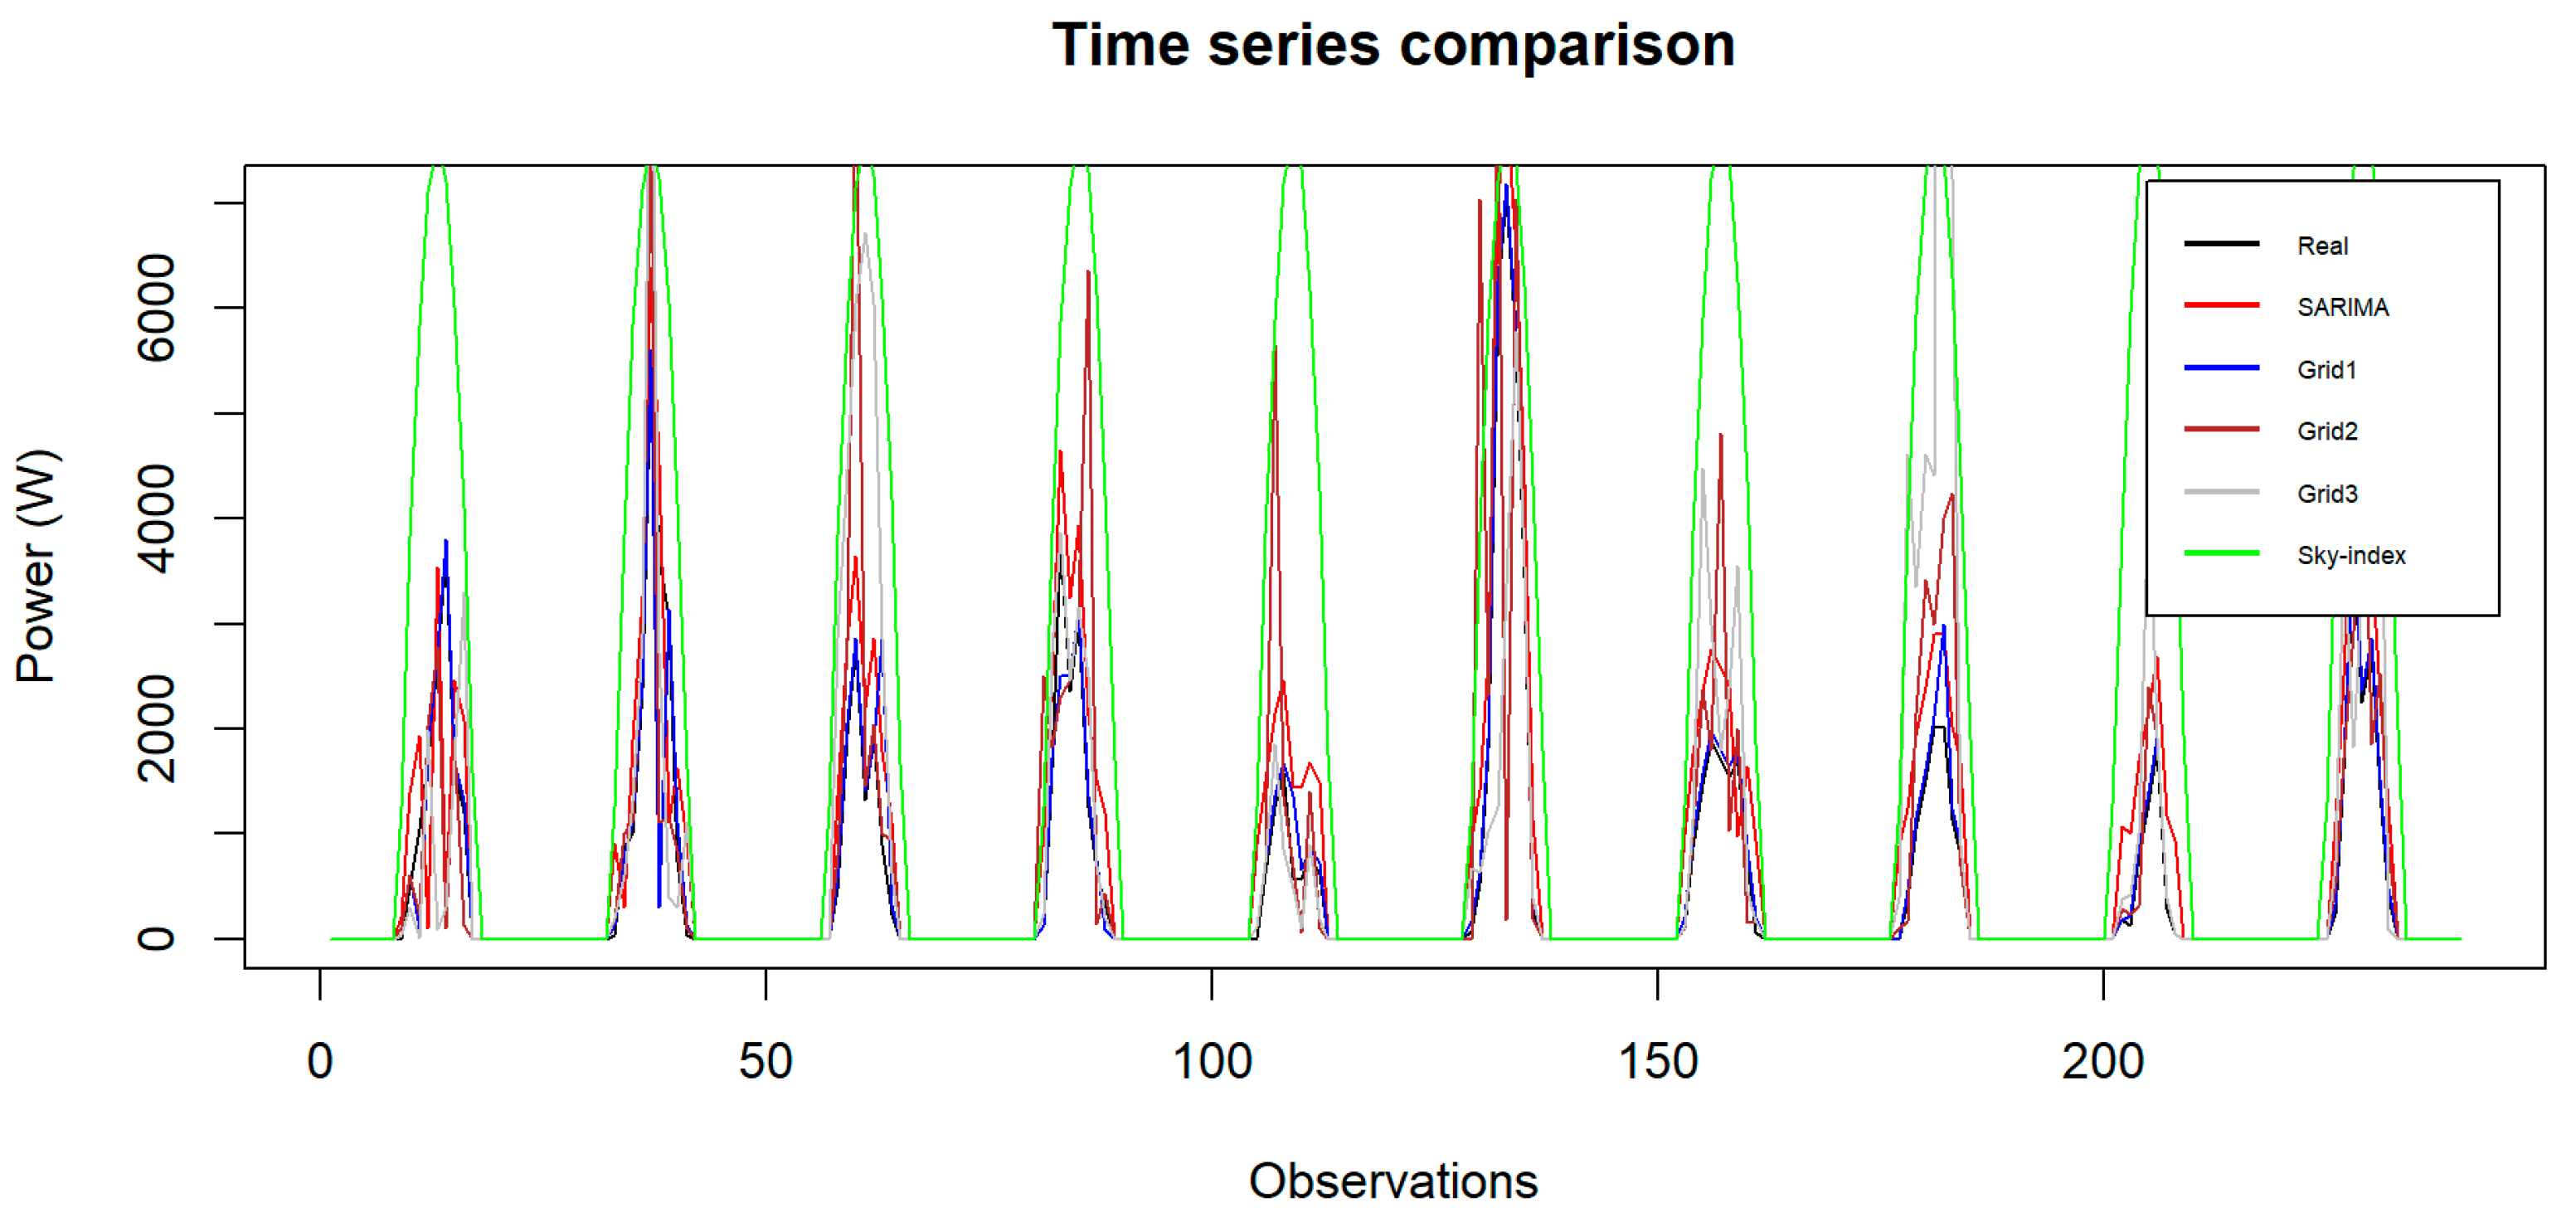
Comparison of the time series of the models.
2.5. Artificial Neural Networks
Artificial Neural Networks (ANN) are mathematical models that try to reproduce the functioning of the nervous system, made up of a set of units called neurons. The functioning of a neural network depends on the structure selected for its performance. In the development of the neural network model, it was decided to use a multilayer-type network, and the information resulting from the TDC model was used as input data in order to provide more information to the network for its training. In the structure of the network, different parameters were tested in order to obtain an accurate forecast. The multilayer neural network had 80% of the training information and the rest was used for validation. Table 3 shows the structures that had a positive degree of forecast accuracy.

Table 3.
Multilayer network structure.
3. Results and Discussion
Figure 4 shows a comparison of the models of neural networks with different architectures in their configuration, SARIMA, and clear sky index with respect to the actual observations of the photovoltaic array. The observations estimated with each model were obtained as a product time series with the same cyclical pattern that corresponds to the generation of electrical energy from the solar resource. The time of the clear sky index model is the one with the greatest variation compared to the actual observations. Figure 4 shows that the network 1, which has a network architecture and configuration, presents a fluctuation closer to reality.
The models with different error metrics were evaluated to determine their reliability, including mean absolute percentage error, mean absolute error (MAE), and coefficient of determination (R2). Table 4 shows that in the calculation of the MAPE, the model that had the lowest degree of error was network 1, giving a value of 0.57% compared to the clear sky index model that had an error of 38.6%, the latter due to the model assuming that, at all times, the meteorological conditions are stable and there are no technical failures of the photovoltaic system. In the case of the values obtained for network 2 and 3, there were variations that depend on the architecture of the grid from the hidden layers and the activation function. The largest value of the MAE was obtained by the clear sky index with 1096.34 W of deviation compared to the research models; the value of the lowest deviation was obtained by network 1 with 69.29 W. In the case of the coefficient of determination, the model that had the best approximation of the estimate with respect to the real value was network 1 with a value of 0.97, while other models presented greater variation.

Table 4.
Forecast error metrics.
The neural network model 1 presented a MAPE value of 0.57%, which indicates that the performance of the model has a good reliability since it belongs to the range of 0–10%. [24].
4. Conclusions
This paper proposes supplying input data to a back-propagated multilayer neural network from output data of a time delay coordinate embedding model and comparing the results with statistical and numerical weather prediction models, as well as different architectures of the neural network. The model of network 1 obtained a MAPE of 0.57% and an R2 of 0.97, indicating that the model based on multilayer neural networks presents a good performance in the forecast of solar power.
Author Contributions
All authors contributed to the study conception and design. Material preparation, data and analysis were performed by G.G.-G., G.S.-B. and J.C.-R. The first draft of the manuscript was written by G.G.-G. and all authors commented on previous versions of the manuscript. All authors have read and agreed to the published version of the manuscript.
Funding
G.G.-G. would like to acknowledge grant given to by Conahcyt, México, grant number 827363.
Institutional Review Board Statement
Not applicable.
Informed Consent Statement
Not applicable.
Data Availability Statement
The data was obtained from the Solar Radiation Monitoring Laboratory of the University of Oregon.
Conflicts of Interest
The authors declare no conflict of interest. The author G.S.-B. wants to clarify that the presented is all his own opinion and research lines, and not necessarily the opinion of BBVA México.
References
- IEA. Renawable Electricity. Available online: https://www.iea.org/fuels-and-technologies/electricity (accessed on 3 March 2023).
- International Renewable Energy Agency. Available online: https://www.irena.org/Energy-Transition/Technology/Solar-energy (accessed on 1 April 2023).
- IEA. Solar. Available online: https://www.iea.org/fuels-and-technologies/solar (accessed on 3 March 2023).
- Gürel, A.E.; Agbulut, Ü.; Bakır, H.; Ergün, A.; Yıldız, G. A state of art review on estimation of solar radiation with various models. Heliyon 2023, 9, e13167. [Google Scholar] [CrossRef]
- UNFCCC. UN Climate Change Quarterly. Available online: https://unfccc.int/documents?f%5B0%5D=conference%3A4526 (accessed on 2 April 2023).
- Parasad, A.A.; Kay, M. Evaluation of simulated solar irradiance on days of high intermittency using WRF-Solar. Sol. Energy 2020, 13, 2200–2217. [Google Scholar]
- Antonanzas, J.; Osorio, N.; Escobar, R.; Urraca, R.; Pison, F.J.M.-D.; Antonanzas-Torres, F. Review of photovoltaic power forecasting. Sol. Energy 2016, 136, 78–111. [Google Scholar] [CrossRef]
- Khalid, M.; Savkin, A. A method for short-term wind power prediction with multiple observation points. IEEE Trans. Power Syst. 2012, 27, 579–586. [Google Scholar] [CrossRef]
- Chen, N.; Qian, Z.; Nabney, I.; Meng, X. Wind power forecasts using Gaussian processes and numerical weather prediction. IEEE Trans. Power Syst. 2014, 29, 656–665. [Google Scholar] [CrossRef]
- Dowell, J.; Pinson, P. Very short-term probabilistic wind power forecasts by sparse vector autoregression. IEEE Trans. Smart Grid. 2016, 7, 763–770. [Google Scholar] [CrossRef]
- Zhao, X.; Bai, M.; Yang, X.; Liu, J.; Yu, D.; Chang, J. Short-term probabilistic predictions of wind multi-parameter based on one-dimensional convolutional neural network with attention mechanism and multivariate copula distribution estimation. Energy 2021, 234, 121306. [Google Scholar] [CrossRef]
- Mellit, A.; Pavan, A.M.; Ogliari, E.; Leva, S.; Lughi, V. Advanced methods for photovoltaic output power forecasting. Appl. Sci. 2020, 10, 487. [Google Scholar] [CrossRef]
- Karner, O. ARIMA representation for daily solar irradiance and surface air temperature time series. J. Atmos. Sol.-Terr. 2009, 71, 841–847. [Google Scholar] [CrossRef]
- Inman, R.H.; Pedro, H.T.; Coimbra, C.F. Solar forecasting methods for renewable energy integration. Energy Combust. 2013, 39, 535–576. [Google Scholar] [CrossRef]
- Alsharif, M.H.; Younes, M.K.; Kim, J. Time series ARIMA model for prediction of daily and monthly average global solar radiation: The case study of Seoul, South Korea. Symmetry 2019, 11, 240. [Google Scholar] [CrossRef]
- Arbizu-Barrena, C.; Ruiz-Arias, J.A.; Rodríguez-Benítez, F.J.; Pozo-Vázquez, D.; Tovar-Pescador, J. Short-term solar radiation forecast using advection and diffusion of the MSG cloud index. Energy Sol. 2017, 155, 1092–1103. [Google Scholar] [CrossRef]
- Diagne, M.; David, M.; Boland, J.; Schmutz, N.; Lauret, P. Post processing of solar irradiance forecasts from the WRF model in Island. Sol. Energy 2014, 105, 99–108. [Google Scholar] [CrossRef]
- Amit Kumar Yadav, S.S. Chandel, Solar radiation prediction using Artificial Neural Network techniques: A review. Renew. Sustain. Energy Rev. 2014, 33, 772–781. [Google Scholar] [CrossRef]
- López, G.; Batlles, F.J.; Tovar-Pescador, J. Selection of input parameters to model direct solar irradiance by using artificial neural networks. Energy 2005, 30, 1675–1684. [Google Scholar] [CrossRef]
- Wanga, Z.; Wanga, F.; Sub, S. Solar irradiance short-term prediction model based on BP neural network. Energy Procedia 2011, 12, 488–494. [Google Scholar] [CrossRef]
- Ahmad, M.J.; Tiwari, G.N. Solar radiation models—Review. Int. J. Energy Environ. 2010, 1, 513–532. [Google Scholar] [CrossRef]
- Huang, X.; Liu, J.; Xu, S.; Li, C.; Li, Q.; Tai, Y. A 3D ConvLSTM-CNN network based on multi-channel color extraction for ultrashort-term solar irradiance forecasting. Energy 2023, 272, 127140. [Google Scholar] [CrossRef]
- Osah, S.; Acheampong, A.A.; Fosu, C.; Dadzie, I. Deep learning model for predicting daily IGS zenith tropospheric delays in West Africa using TensorFlow and Keras. Adv. Space Res. 2021, 68, 1243–1262. [Google Scholar] [CrossRef]
- Lewis, C.D. International and Business Forecasting Methods; Butter Worths: London, UK, 1982. [Google Scholar]
- University of Oregon Solar Radiation Monitoring Laboratory. Available online: http://solardata.uoregon.edu/cgi-bin/ShowArchivalFiles.cgi (accessed on 1 April 2023).
- Yang, L.; Gao, X.; Hua, J.; Wang, L. Intra-day global horizontal irradiance forecast using FY-4A clear sky index. Sustain. Energy Technol. Assess. 2022, 50, 101816. [Google Scholar] [CrossRef]
- Yagasaki, K.; Uozumi, T.G. Controlling chaos using nonlinear approximations and delay coordinate embedding. Phys. Lett. A 1998, 247, 129–139. [Google Scholar] [CrossRef]
Disclaimer/Publisher’s Note: The statements, opinions and data contained in all publications are solely those of the individual author(s) and contributor(s) and not of MDPI and/or the editor(s). MDPI and/or the editor(s) disclaim responsibility for any injury to people or property resulting from any ideas, methods, instructions or products referred to in the content. |
© 2023 by the authors. Licensee MDPI, Basel, Switzerland. This article is an open access article distributed under the terms and conditions of the Creative Commons Attribution (CC BY) license (https://creativecommons.org/licenses/by/4.0/).

