Abstract
The concept of risk assessment is an important tool in the asset integrity management of power distribution systems. This manuscript presents a risk-based asset integrity management (RBAIM) methodology for the optimization of power distribution assets using a time series analysis approach. This approach deals with time series forecasting on risk assessment for low-voltage-level (400/230 V) failures using the Python programming language and considering historical low-voltage (LV) fuse failure data from a case study over 44 months, starting from 2019. The proposed approach is deployed in a power distribution utility located in a densely populated area of Colombo district, Sri Lanka. The authors proposed a methodical approach for the identification of priority components for asset maintenance and repair ranking based on the risk index percentage value to enhance the predictiveness of potential defects and estimate the risk of potential failures. The results show that the proposed time series forecasting methodology for RBAIM is useful for power distribution utility asset owner organizations for continuous monitoring, the evaluation of asset conditions, and the implementation of proper maintenance and repair strategies to enable assets to perform at their optimal level. The proposed RBAIM methodology enables practicing engineers to assure the asset integrity of power distribution utilities.
1. Introduction
The asset integrity management (AIM) of power distribution systems is a challenging task of balancing inputs from stakeholders, such as owners, local authorities, regulatory bodies, and customers, with the decision criteria ranging from strategic to operational levels [1,2]. The necessity of effective and efficient decision-making further magnifies the complexity of AIM, depending on different planning horizons, such as the short, medium and long term [1,2]. In this study, AIM is defined as “the means of ensuring that the people, systems processes and resources which deliver the integrity, are in place, in use and fit for purpose over the whole life cycle of the asset. Whole life cycle comprises: design, construction, installation, commissioning, and operation” [3,4]. Decision-making, design, and maintenance strategies under uncertainty, whilst meeting different stakeholder requirements, are a crucial part of power distribution systems’ AIM [1,2]. Asset integrity assurance (i.e., using an inspection and maintenance management process) with a limited annual budget requires effective and efficient prioritization of associated factors [5]. Hence, in order to overcome those challenges, methodical approaches for AIM are required.
Power distribution infrastructure is composed of a significant number of geographically dispersed components, including static components such as transformers, fuses, towers, poles, and power cables with rotary components such as load break switches, sectioning switches, transformer tap changers, etc. [5,6]. Hence, the main challenge faced by power distribution utilities is to maintain the integrity of the assets’ complex and comprehensive infrastructure [7]. The risk of failure of those components due to degradation, external issues, manufacturing defects, etc. can reduce the integrity of the power distribution network and can also be disastrous for the power distribution utility, especially in highly populated areas [2,8,9]. Risk assessment is a vital tool in the asset and operational management of power distribution assets [1,10]. Historical failure analysis of those components is essential for power distribution system AIM to achieve high quality and reliability, while managing costs, ensuring safety, and avoiding environmental hazards [2,11]. Hence, risk-based asset integrity management (RBAIM) is required for the optimization of power distribution assets.
Time series analysis of power distribution systems’ processes involves careful investigation of recorded data over time [12,13]. However, in the literature, most of the time series analysis and forecasting methods that have been discussed mainly concern electricity power distribution demand and energy forecasting [13,14,15]. Little research is available on time series analysis for historical failure data of power distribution system components in the literature on RBAIM [15,16,17,18]. Hence, the authors have observed that historical failure data of power distribution system components can be analyzed using time series analysis to make predictions for decision-making and scarce resource utilization. Therefore, developing a step-by-step methodology involving time series analysis and the concept of risk to facilitate the decision-making process to provide a solution to fill the gaps that exist in failure analysis is required for RBAIM.
This manuscript aims to develop a novel RBAIM approach for low-voltage (400/230 V) failures of power distribution systems, selecting failures of low-voltage (LV) fuses, applied to a regional section of a Sri Lankan power distribution utility. A Python program-based time analysis methodology has been deployed for an RBAIM approach. The proposed methodology involves a methodical approach to the identification and documentation of LV failures, the recognition of maintenance ranking based on risk indexes, resulting in the prioritization of AIM for optimum resource and spare part utilization. Hence, this paper suggests an interesting and unique time series prediction approach, providing a practical and systematic contribution to the related literature. Initially, the study’s research background, the case study methodology and development are presented, considering LV failures against a quality of power supply to consumer consequence, which is represented by a reliability index called a system average interruption duration index (SAIDI) of power distribution systems. After that, the results, discussions, and conclusion from the case study are presented, including proposals for future research at the end of the manuscript.
2. Research Background
2.1. Assets, Risk, Maintenance Management, AIM, and RBAIM
The assets of electricity distribution infrastructure require inspection and maintenance to achieve goals, such as optimal allocation of yearly budget, resources, and risk-based performance assessment, which should be aligned with organizational objectives to make data-driven decisions [19,20]. The Publicly Available Specification (PAS) 55 standard, published by the British Standards Institution in 2004, necessitates the integration of organizational processes and practices to manage assets, performances, risks, and expenditures over the life cycle to achieve the organization’s strategic plans in a sustainable and optimal way [4,19,21]. Using ISO 55001 Asset Management Systems, organizations can manage assets more effectively throughout the life cycle, whilst managing, improving, and implementing significant assets [22]. Furthermore, ISO 31000 provides a methodical approach to risk management through identifying risks, evaluating the probability of risk occurrence, and determining the severity of the problems caused by an event [19,23]. In addition, ISO 9001 (2015) indicates the identification of relevant risks, controlling throughout the design with the use of a quality management system [9,24].
It is necessary to identify risks within the business process in order to implement appropriate measures to mitigate them [19,25,26]. Risk can be defined qualitatively/quantitatively as the product of the probability of an event and its consequences [19,20,26]. Risk management involves risk assessment and evaluation for decision-making [19,20]. For power distribution utilities, widely accepted business values are quality of supply (in terms of loss of electricity to consumer minutes), safety (in terms of injuries to personnel and third parties), financial impact (in terms of cost of damage to the organization), image (in terms of reputation), and compliancy (in terms of regulations and legislations) [8,10,19].
The maintenance perspective can be divided into two main categories, namely, reactive and proactive maintenance [19]. The supporting pillars for maintenance management involve process, quality, information and communication technology (ICT), as well as knowledge management [19,20]. With AIM, a set of systematic and proactive strategies can be used to enable industrial assets to operate efficiently and safely during their life cycle [3,4]. Hence, in order to achieve optimal AIM methodology, a RBAIM is required as a systematic approach to managing the physical assets of an organization, with a focus on minimizing risk and maximizing the reliability and safety of those assets.
2.2. Time Series Analysis and Forecasting
Many industries use time series forecasting for demand prediction, resource allocation, predictive maintenance, financial performance, and various other applications [27,28]. Time series forecasting is defined as a technique to predict future occurrences after analyzing past trend data [18,27,29]. In this context, models are used to fit historical data to predict future values [18,29]. Time series forecasting is a data-driven approach, which facilitates effective and efficient planning [27]. Therefore, time series forecasting can be used for an RBAIM approach to identify, assess, and manage the risks associated with physical assets.
The time series analysis approach starts with examining the historical data to check for trends, seasonal patterns, cyclical patterns, and regularity effects [27,29]. The methods used for time series analysis and forecasting include moving average (involves calculating the average of the last n observations), exponential smoothing (involves assigning exponentially decreasing weights to older observations), AutoRegressive Integrated Moving Average (ARIMA—involves modeling the dependence between observation and a number of lagged observations), Seasonal AutoRegressive Integrated Moving Average (SARIMA—involves seasonality of time series data), and machine learning methods (involve algorithms such as artificial neural networks) [18,27]. Accordingly, the proposed RBAIM methodology uses ARIMA as a time series forecasting methodology.
The steps in time analysis and forecasting can vary, depending on the method being used and the specific problem being solved [18]. A general outline of the steps for time series analysis and forecasting includes data preparation; exploratory data analysis, which involves visualizing data; summarizing statistical properties; checking for stationarity, using either an Augmented Dickey–Fuller (ADF) test, a Kwiatkowski–Phillips–Schmidt–Shin (KPSS) test or a Phillips–Perron (PP) test; appropriate preprocessing steps, such as differencing or log transformation, which should be carried out if the data set is not stationary; appropriate model selection; model fitting, evaluation, and forecasting for future values of the time series; and model refinement [18,27].
3. Case Study Methodology and Development
3.1. Use of Case Study Methodology
A case study research methodology is adopted in this research. This involves scrutinizing a particular case to obtain deeper understanding of a particular phenomenon [30]. This methodology involves steps such as defining the research question, selecting the case(s), data collection, data analysis, reporting, and interpretation [30]. The different approaches to case study methodology include the inductive approach (using data and observations to generate theories and explanations), the deductive approach (using theories and hypotheses via observation and data), and the abductive approach (using observations to come up with tentative explanations and testing, refining those via additional data collection and analysis) [30]. In this case study, an abductive approach is used, as historical time series data are used for tentative explanations and testing, with further refining of data for forecasting.
3.2. The Case Study Background
The power distribution network of the Dehiwala area of the Ceylon Electricity Board (CEB), Sri Lanka, has been selected for the application of the proposed time series forecasting case study on RBAIM for LV fuse failures of power distribution systems. The Dehiwala area has been selected as a representative area for the study, as it has a similar electricity infrastructure to other CEB areas with comparatively higher consumer density, higher consumer expectations, and a high industrial work capacity [9,10,16].
Through analysis of historical LV failure data for the overhead power distribution lines of the case study region, the general reasons for LV failures have been observed to be LV fuse failures, breakdown at the distribution transformer (DT), neutral leakage, and LV issues. The study is based on LV fuse failures, which constitute the most frequently occurring LV failure reason of all LV failures. LV fuses are used to protect the LV distribution network [31].
Although the risk of impact of LV fuse failures is comparatively low compared to medium-voltage (MV) failures (i.e., the failures at the ranges of 33/11 kV), a single LV failure causes power loss to a set of consumers in the same LV feeder, as depicted in Figure 1. Hence, an LV fuse failure results in a significant impact to a group of consumers, compared to a single consumer service connection level failure, which has an impact on only one consumer. Furthermore, LV fuse failures from 1 May 2019 to 31 December 2022 are observed and recorded for 11 kV/0.4 kV DTs of capacities 100 kVA, 160 kVA, 250 kVA, 400 kVA, 630 kVA, and 800 kVA in the selected power distribution area of the selected case study organization for the proposed RBAIM approach.
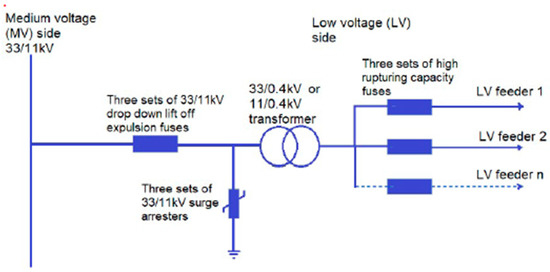
Figure 1.
Typical arrangement of power distribution system in CEB [31].
3.2.1. LV Fuses
High rupturing capacity (HRC)-type current-limiting fuses of 160 A, with knife edge type as per IEC 60269, are used by CEB as LV fuses in their power distribution networks [31]. Figure 2 shows a picture of a typical HRC fuse used by CEB.

Figure 2.
160 A LV fuse used by CEB [31].
3.2.2. Probability of LV Failure
The probability of failure (PoF) of LV fuses for a particular DT capacity is obtained using Equation (1) given below:
3.2.3. SAIDI and Consequence of Failure (CoF)
In order to measure the quality of the power system performance, reliability indexes are incorporated [32]. In this study, SAIDI is used as a measure of consequence for quality of power supply to consumers. For this research, SAIDI is defined as the average duration of LV fuse failure interruptions per consumer on a daily basis for different capacities of DTs. The failure rate is denoted by λi, the number of customers is given by Ni, and SAIDI is given using Equation (2), as below:
3.2.4. Risk Index Determination
An index of risk has been calculated for historical LV fuse failure data as PoF and SAIDI as CoF, in relation to the selected case study organization; this is given under Equation (3) below:
Risk index = PoF × CoF
3.3. Development of Time Series Analysis Forecasting Based on RBAIM Methodology
The steps in RBAIM shall include asset identification with categorization; assessment of risk associated with each asset, based on PoF and CoF; development of a risk management plan, outlining the measures to manage or mitigate the identified risks; implementation of the risk management plan, establishing appropriate processes and procedures for AIM; monitoring and review of the risk management plan; and continuous review and improvement of the risk assessment process.
In this study, RBAIM using time series forecasting for LV fuses of power distribution systems has been investigated. Figure 3 shows the basic flow chart used for the time series forecasting for LV fuse failure data.
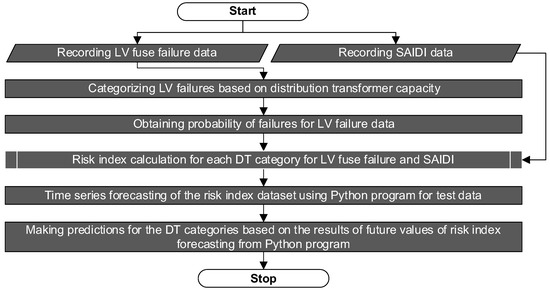
Figure 3.
Basic flow chart used for the RBAIM for LV fuse failures and SAIDI.
In accordance with Figure 3, the recording of LV fuse failures was carried out to calculate the probability of LV failures. Then, daily SAIDI data for each DT category with respect to LV fuse failures were calculated. After that, daily percentage indexes of risk were calculated for each DT category, as per Equations (1)–(3) for the selected duration of 44 months. Then, time series forecasting for test data and predictions for real future based on risk index percentage values were carried out for each category of DTs.
Detailed Mathematic Modeling
Initially, historical data collection of daily LV fuse failures for 44 months were recorded for 11 kV/0.4 kV 100 kVA, 160 kVA, 250 kVA, 400 kVA, 630 kVA, and 800 kVA DT categories. Then, SAIDI data were calculated for each DT category of LV fuse failures. Risk index percentages were calculated, using PoF as LV fuse failure and CoF as SAIDI, and recorded in Comma Separated Values (CSV) files. After that, risk index percentage datasets were visualized and decomposed to check for any time series patterns, trends, and seasonality that might affect the performance of the time series model [33,34,35].
In the next step, stationary tests for the risk index percentage data sets were carried out, using the Augmented Dickey–Fuller (ADF) test. For ADF, the null hypothesis is non-stationarity, and the alternative hypothesis is stationarity [29,36]. The null hypothesis is not rejected if the ADF statistic is less negative than the critical value, indicating that the time series is non-stationary [29,36]. Then, the null hypothesis is rejected if the ADF statistic is more negative than the critical value, indicating that the time series is stationary [29,36].
In this study, all ADF test results have shown that the test statistic is less than the critical value for different confidence intervals. This confirms that all six categories of risk index percentage data sets are stationary. If the time series data are found to be non-stationary, it shall be transformed to stationarity using differencing, detrending, or de-seasonalizing methods.
Autoregressive Integrated Moving Average (ARIMA) with optimal set of performance parameters has been used to forecast the risk index percentages of LV fuse failures and SAIDI of all categories of DTs. ARIMA is a popular and powerful time series model which can capture the linear patterns in time series data [29,36]. The general form of ARIMA model is ARIMA(p,d,q), where p gives the order of the autoregressive component (AR), d gives the degree of differencing required to make the time series stationary (I), and q is the order of the moving average component (MA). In the AR component of ARIMA, the current value of the time series depends linearly on the past values up to lag p and is given in the following equation [29,36]:
In Equation (4), y(t) gives the current values of the time series, denotes a constant, are the autoregressive coefficients that represent the linear relationship between the current value and its past values up to lag p, and denotes the error term [29,36]. The MA component of ARIMA assumes that the current values of the time series depend linearly on the past errors up to lag q, and it is given in the following equation [29,36]:
In Equation (5), gives the mean of the time series, indicates the moving average coefficients that represent the linear relationship between the current values and the past errors up to lag q, is the current error term, and et is the white noise error term that is independent of [29,36]. The differencing component (I) of ARIMA indicates the time series stationarity through taking the first difference or a higher order difference, and it is given via the following equation [26,33]:
In equation (6), y(t)′ and y(t)″ are the first and second differences of the time series, respectively. After determining the suitable ARIMA model for all the categories of data sets, model diagnostics for all data sets were carried out to evaluate the fit of the ARIMA model with the observed time series data, checking whether the model assumptions were met or violated [33,34,35]. Accordingly, residual analysis, autocorrelation, and partial autocorrelation suggested that model residuals are normally distributed for all the determined ARIMA models.
Time series forecasting was carried out for one year, from 1 January 2022 to 31 December 2022, and the forecasted values were compared with the real values to check the accuracy of the predictions. In the last step, the risk index percentages were forecast for the real future from 31 December 2022 to 100 steps ahead, and the resulting CSV files were obtained. The resulting mean squared error (MSE) and root mean squared error (RMSE) values for risk index percentages of all categories of DTs were recorded. Figure 4 indicates the risk-based time series forecasting flow chart used for the Python program for the RBAIM approach.
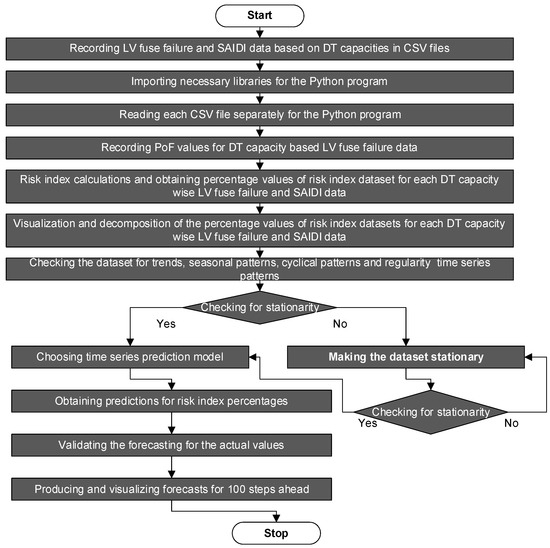
Figure 4.
Flow chart for risk-based time series forecasting using Python program.
4. Data Collection and Analysis
As per Figure 4, calculated DT category-wise risk index percentages for historical LV fuse failure data and corresponding SAIDI data for 44 months were calculated, and the resulting risk index percentages values were recorded in CSV files. The resulting risk index data sets were examined to check for any time series patterns. Then, stationarity tests were carried out for all DT categories [33,34,35].
The resulting one-step-ahead forecasts compared with real data for one year duration and real future predictions for 100 steps ahead from 1 January 2023 are given in Figure 5, Figure 6, Figure 7, Figure 8, Figure 9 and Figure 10 for each category of DT for risk index percentages calculated using LV fuse failures and corresponding SAIDI data.
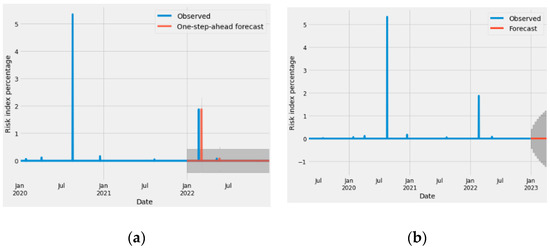
Figure 5.
Observed values compared to (a) one-step-ahead forecast and (b) 100-steps-ahead real future forecast of risk index percentages of LV fuse failures and SAIDI for 11 kV/0.4 kV DT rating 100 kVA.
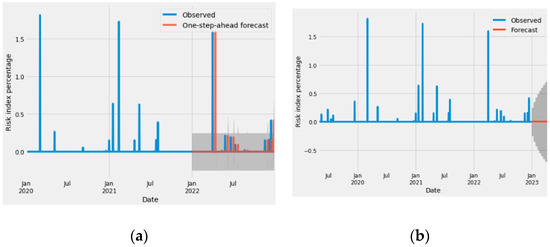
Figure 6.
Observed values compared to (a) one-step-ahead forecast and (b) 100-steps-ahead real future forecast of risk index percentages of LV fuse failures and SAIDI for 11 kV/0.4 kV DT rating 160 kVA.
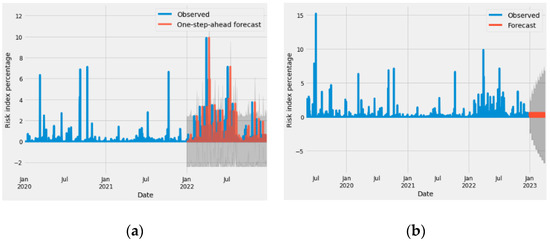
Figure 7.
Observed values compared to (a) one-step-ahead forecast and (b) 100-steps-ahead real future forecast of risk index percentages of LV fuses failures and SAIDI for 11 kV/0.4 kV DT rating 250 kVA.
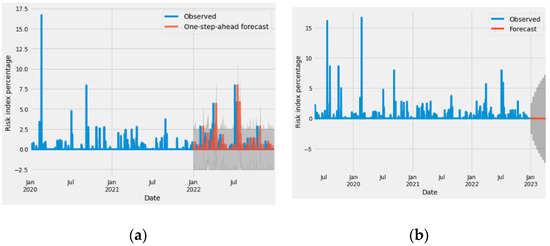
Figure 8.
Observed values compared to (a) one-step-ahead forecast and (b) 100-steps-ahead real future forecast of risk index percentages of LV fuse failures and SAIDI for 11 kV/0.4 kV DT rating 400 kVA.
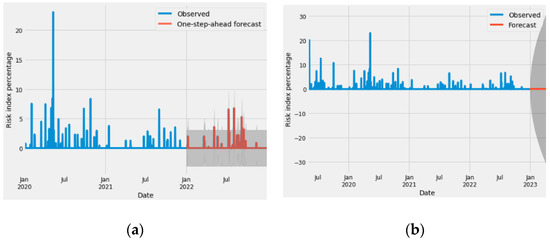
Figure 9.
Observed values compared to (a) one-step-ahead forecast and (b) 100-steps-ahead real future forecast of risk index percentages of LV fuse failures and SAIDI for 11 kV/0.4 kV DT rating 630 kVA.
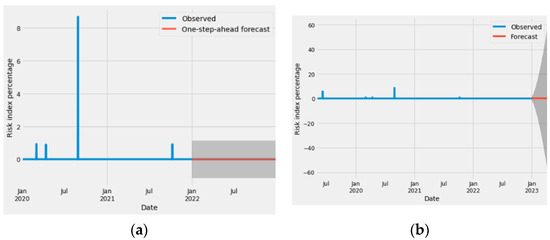
Figure 10.
Observed values compared to (a) one-step-ahead forecast and (b) 100-steps-ahead real future forecast of risk index percentages of LV fuse failures and SAIDI for 11 kV/0.4 kV DT rating 800 kVA.
5. Results and Discussion
Overall, Figure 5a, Figure 6a, Figure 7a, Figure 8a, Figure 9a and Figure 10a show that the one-step-ahead forecasts approximately align with the true values for all 11 kV/0.4 kV DT 100 kVA, 160 kVA, 250 kVA, 400 kVA, 630 kVA and 800 kVA categories of LV fuse failure and SAIDI-based risk index percentage data sets, respectively. The second (b) diagrams in all Figure 5, Figure 6, Figure 7, Figure 8, Figure 9 and Figure 10 show the real future predictions for 100 steps ahead for risk index percentages of all types of DT categories. The resulting average risk index percentage values are recorded in CSV files, and the data extracted from the Python program for real future forecasts are given in Table 1 for LV fuse failures and SAIDI data of all categories of DTs. Table 1 shows that 11 kV/0.4 kV 630 kVA DT has the highest risk of LV fuse failure and SAIDI consequence., Accordingly, resources and maintenance costs are to be allocated mainly for the DTs of that category. Furthermore, DTs of 11 kV/0.4 kV 250 kVA & 400 kVA have more or less resulting risk index percentage values, so resources shall be allocated similarly for those two categories. For other categories of DTs, asset managers can allocate resources according to risk index percentage predictions, as given in Table 1.

Table 1.
Risk index prediction results.
The resulting mean squared error (MSE) and root mean squared error (RMSE) predictions for risk index percentages of LV fuse failures of DT categories are given in Table 2. In general, lower values of MSE and RMSE are desirable for accurate predictions. Therefore, the values obtained for MSE and RMSE given in Table 2 are satisfactory for the desired predictive accuracy for time series forecasts for the RBAIM model.
Table 2.
Forecasted MSE and RMSE values.
According to the RBAIM approach, the development and implementation of the risk management plan for the identified risk index percentage predictions for each DT category and the continuous improvement of the risk assessment process shall be carried out by the organization’s asset management professionals.
6. Conclusions and Recommendations
In this study, a time series forecasting approach for RBAIM has been developed, using the Python programming language, for a power distribution utility located in a densely populated area of Colombo, Sri Lanka. The established model involves historical LV fuse failure data of different categories of DTs and corresponding SAIDI values to provide risk-based predictions. Daily SAIDI values have been used as a measure of consequence for the probability of LV fuse failures. The methodology can be adopted for failures of other physical assets in a power distribution system. The ultimate goal of RBAIM is to prevent catastrophic failures that can have severe consequences, such as loss of power supply, environmental damage, danger to personnel, and financial losses. Hence, this research provides an RBAIM methodology with the support of data-driven decision-making for predictive maintenance and prioritization of scarce resources and spare parts utilization through analyzing PoF, using LV fuse failures, and CoF, using SAIDI.
Since time series analysis and forecasting can be used to make predictions about various types of data, the resulting forecasts are not always accurate, and this can be influenced by a variety of factors such as changes in the underlying data or unanticipated events.
Further research shall be carried out to investigate how to incorporate the time-dependent nature of a system’s reliability for assuring asset integrity in power distribution systems, with the support of a machine learning approach. Particularly, the risk of impact on MV failures and with mean time to repair (MTTR) consequences for risk index assessment of power distribution systems for proper resource utilization and decision-making for predictive maintenance will be studied using a similar case study approach in the future.
Author Contributions
Conceptualization, A.M.S.R.H.A. and R.M.C.R.; methodology, software, validation, formal analysis, investigation, resources, data curation, A.M.S.R.H.A.; writing—original draft preparation, A.M.S.R.H.A.; writing—review and editing, visualization, supervision, R.M.C.R.; All authors have read and agreed to the published version of the manuscript.
Funding
This research received no external funding.
Institutional Review Board Statement
Not applicable.
Informed Consent Statement
Not applicable.
Data Availability Statement
Not applicable.
Conflicts of Interest
The authors declare no conflict of interest.
References
- Nordgard, D.E.; Gjerde, K.S.O.; Catrinu, M.D.; Lassila, J.; Jartanen, J.; Bonnoit, S.; Aupied, J. A Risk based Approach to Distribution System Asset Management and A Survey of Perceived Risk Exposure Among Distribution Companies. In Proceedings of the 19th International Conference on Electricity Distribution, Vienna, Austria, 21–24 May 2007. [Google Scholar]
- Aliyari, M.; Ayele, Y.Z. Risk analysis in low-voltage distribution systems. Proc. Inst. Mech. Eng. Part O J. Risk Reliab. 2018, 233, 118–138. [Google Scholar] [CrossRef]
- Ratnayake, R.M.C.; Markeset, T. Asset integrity management for sustainable industrial operations: Measuring the performance. Int. J. Sustain. Eng. 2012, 5, 145–158. [Google Scholar] [CrossRef]
- Ratnayake, R.M.C. Sustainable performance of industrial assets: The role of PAS 55-1&2 and human factors. Int. J. Sustain. Eng. 2013, 6, 198–211. [Google Scholar] [CrossRef]
- Mirhosseini, M.; Keynia, F. Asset management and maintenance programming for power distribution systems: A review. IET Gener. Transm. Distrib. 2021, 15, 2287–2297. [Google Scholar] [CrossRef]
- Wallnerstrom, C.J.; Bertling, L. Risk Management applied to Electrical Distribution Systems. In Proceedings of the 20th International Conference on Electricity Distribution, Prague, Czech Republic, 8–11 June 2009. [Google Scholar] [CrossRef]
- Nordgård, D.E.; Samdal, K. Establishing risk-based maintenance strategies for electricity distribution companies. In Reliability, Risk and Safety Three Volume Set; CRC Press: Boca Raton, FL, USA, 2009. [Google Scholar]
- Zhao, M.-X.; Su, J.; Liu, S.-G. Risk assessment based maintenance management for distribution network. J. Int. Counc. Electr. Eng. 2014, 2, 84–89. [Google Scholar] [CrossRef]
- Attanayake, A.M.S.R.H.; Ratnayake, R.M.C. On the Necessity of Using Supervised Machine Learning for Risk-Based Screening of Distribution Transformers: An Industrial Case Study. In Proceedings of the IEEE International Conference on Industrial Engineering and Engineering Management (IEEM), Kuala Lumpur, Malaysia, 7–10 December 2022; pp. 0468–0473. [Google Scholar] [CrossRef]
- Attanayake, A.M.S.R.H.; Ratnayake, R.M.C. Risk-Based Inspection and Maintenance Analysis of Distribution Transformers: Development of a Risk Matrix and Fuzzy Logic Based Analysis Approach. In Proceedings of the IEEE International Conference on Industrial Engineering and Engineering Management (IEEM), Kuala Lumpur, Malaysia, 7–10 December 2022; pp. 0457–0462. [Google Scholar] [CrossRef]
- Gitelman, L.D.; Kozhevnikov, M.V.; Chebotareva, G.S.; Kaimanova, O.A. Asset Management of Energy Company Based on Risk-Oriented Strategy. In Energy Production and Management in the 21st Century IV: The Quest for Sustainable Energy; WIT Press: Southampton, UK, 2020; pp. 125–135. [Google Scholar]
- Saha, E.; Saha, R.; Mridha, K. Short-Term Electricity Consumption Forecasting: Time-Series Approaches. In Proceedings of the 2022 10th International Conference on Reliability, Infocom Technologies and Optimization (Trends and Future Directions) (ICRITO), Noida, India, 13–14 October 2022; pp. 1–5. [Google Scholar] [CrossRef]
- Bitos, M.; Mills, D.; Ashton, S.R. Utilising Forecasting Time Series Data and Flexibility Services to manage Distribution Networks. In Proceedings of the CIRED 2021—The 26th International Conference and Exhibition on Electricity Distribution, Online Conference, online, 20–23 September 2021; pp. 2760–2763. [Google Scholar] [CrossRef]
- Çetinkaya, Ü.; Avcı, E.; Bayindir, R. Time Series Clustering Analysis of Energy Consumption Data. In Proceedings of the 2020 9th International Conference on Renewable Energy Research and Application (ICRERA), Glasgow, UK, 27–30 September 2020; pp. 409–413. [Google Scholar] [CrossRef]
- Kindalkar, S.S.; Itagi, A.R.; Kappali, M.; Karajgi, S. Time Series Based Short Term Load Forecasting using Prophet for Distribution System. In Proceedings of the 2022 International Conference on Smart Generation Computing, Communication and Networking (SMART GENCON), Bangalore, India, 23–25 December 2022; pp. 1–6. [Google Scholar] [CrossRef]
- Attanayake, A.M.S.R.H.; Ratnayake, R.M.C. Digitalization of Distribution Transformer Failure Probability Using Weibull Approach towards Digital Transformation of Power Distribution Systems. Future Internet 2023, 15, 45. [Google Scholar] [CrossRef]
- Goswami, K.; Kandali, A.B. Electricity Demand Prediction using Data Driven Forecasting Scheme: ARIMA and SARIMA for Real-Time Load Data of Assam. In Proceedings of the 2020 International Conference on Computational Performance Evaluation (ComPE), Shillong, India, 2–4 July 2020; pp. 570–574. [Google Scholar] [CrossRef]
- Shumway, R.H.; Stoffer, D.S. Time Series Analysis and Its Applications with R Examples, 3rd ed.; Springer: Berlin/Heidelberg, Germany, 2016; p. 568. [Google Scholar] [CrossRef]
- Mehairjan, R.P.Y. Risk-Based Maintenance for Electricity Network Organizations; Springer International Publishing: Cham, Switzerland, 2016. [Google Scholar]
- Gomez, J.F.; Galan, P.M.; Guillen, A.J.; Crespo, A. Risk-based criticality for network utilities asset management. IEEE Trans. Netw. Serv. Manag. 2019, 16, 755–768. [Google Scholar] [CrossRef]
- Reyes-Picknell, J. An Introduction to PAS 55—Optimal Management of Physical Assets. Available online: https://reliabilityweb.com/articles/entry/an_introduction_to_pas_55_optimal_management_of_physical_assets (accessed on 12 February 2023).
- ISO55001 Asset Management Systems. Available online: https://saiassurance.com.au/iso-55001/#:~:text=ISO%2055001%20Asset%20Management%20Systems%20helps%20organisations%20manage%20assets%20more,the%20value%20of%20their%20assets (accessed on 12 February 2023).
- ISO 31000 Risk Management. Available online: https://www.iso.org/iso-31000-risk-management.html (accessed on 12 February 2023).
- ISO 9001 and Related Standards in Quality Management. Available online: https://www.iso.org/iso-9001-quality-management.html (accessed on 12 February 2023).
- Li, Y.; Yeddanapudi, S.; McCalley, J.; Chowdhury, A.; Jewell, W. Resource Management for Distribution System Maintenance Using Optimized Risk Reduction. In Proceedings of the 2006 International Conference on Probabilistic Methods Applied to Power Systems, Stockholm, Sweden, 11–15 June 2006. [Google Scholar] [CrossRef]
- Khan, F.I.; Haddara, M.M. Risk-based maintenance (RBM): A quantitative approach for maintenance/inspection scheduling and planning. J. Loss Prev. Process Ind. 2003, 16, 561–573. [Google Scholar] [CrossRef]
- Georgiou, A.D. An Introduction to Time Series Forecasting. 2021. Available online: https://www.infoworld.com/article/3622246/an-introduction-to-time-series-forecasting.html (accessed on 12 February 2023).
- Jain, A.; Gadia, H.; Sukhdeve, T.; Sahu, S.P.; Verma, S. COVID19 Prediction using Time Series Analysis. In Proceedings of the 2021 International Conference on Artificial Intelligence and Smart Systems (ICAIS), Pichanur, India, 25–27 March 2021; pp. 1599–1606. [Google Scholar] [CrossRef]
- Introduction to Time Series Analysis. Available online: https://www.itl.nist.gov/div898/handbook/pmc/section4/pmc4.html (accessed on 12 February 2023).
- Yin, R.K. Case Study Research and Applications Design and Methods; Sage Publications, Inc.: Thousand Oaks, CA, USA, 2018. [Google Scholar]
- Lucas, J.R.; Udayakanthi, M.V.P.G. Identification of Causes of Distribution Transformer Failures and Introduction of Measures to Minimize Failures; Department of Electrical Engineering, University of Moratuwa: Moratuwa, Sri Lanka, 2015. [Google Scholar]
- Operating Manual Area Electrical Engineer; Ceylon Electricity Board: Colombo, Sri Lanka, 2016.
- Jacob, S. Time Series Forecast: A Basic Introduction Using Python. 2017. Available online: https://medium.com/@stallonejacob/time-series-forecast-a-basic-introduction-using-python-414fcb963000#:~:text=Time%20series%20forecasting%20is%20basically,Handling%20Ti.me%20Series%20in%20Pandas (accessed on 2 January 2023).
- Peixeiro, M. The Complete Guide to Time Series Analysis and Forecasting. 2019. Available online: https://towardsdatascience.com/the-complete-guide-to-time-series-analysis-and-forecasting-70d476bfe775 (accessed on 2 January 2023).
- Li, S. An End-to-End Project on Time Series Analysis and Forecasting with Python. 2018. Available online: https://towardsdatascience.com/an-end-to-end-project-on-time-series-analysis-and-forecasting-with-python-4835e6bf050b (accessed on 2 January 2023).
- Box, G.E.P.; Jenkins, G.M.; Reinsel, G.C.; Ljung, G.M. Time Series Analysis: Forecasting and Control, 5th ed.; John Wiley & Sons Incorporated: New York, NY, USA, 2015. [Google Scholar]


Disclaimer/Publisher’s Note: The statements, opinions and data contained in all publications are solely those of the individual author(s) and contributor(s) and not of MDPI and/or the editor(s). MDPI and/or the editor(s) disclaim responsibility for any injury to people or property resulting from any ideas, methods, instructions or products referred to in the content. |
© 2023 by the authors. Licensee MDPI, Basel, Switzerland. This article is an open access article distributed under the terms and conditions of the Creative Commons Attribution (CC BY) license (https://creativecommons.org/licenses/by/4.0/).