Proceeding Paper

Modeling Energy Transition in US Commercial Real Estate: A Diffusion Comparison with the Industrial Sector †

Steers Center for Global Real Estate, McDonough School of Business, Georgetown University, Washington, DC 20057, USA
Presented at the 9th International Conference on Time Series and Forecasting, Gran Canaria, Spain, 12–14 July 2023.
Eng. Proc. 2023, 39(1), 15; https://doi.org/10.3390/engproc2023039015
Published: 29 June 2023
(This article belongs to the Proceedings of The 9th International Conference on Time Series and Forecasting)

Abstract

:
This paper proposes a refinement of the multivariate diffusion UCTT model to explore the energy transition in the US commercial sector. The model analyzes the electricity market’s interdependencies between coal, gas, and biomass, allowing a deeper understanding of the system. In addition, the comparison with the industrial sector electric system provides a valuable indication of how the US commercial sector has solid grounds for a more ready and suitable environment to accelerate the energy transition.

1. Introduction

An extensive structural transformation in energy systems is denoted by the term energy transition.This transition is often referred to as the decarbonization of the energy sector and aims to shift the system to renewable energy technologies (RETs), implying a change from centralized to decentralized energy production [1]. According to the International Renewable Energy Agency [2], the use of appropriate technology and regulations in all sectors, including real estate, may potentially reduce carbon emissions from the energy sector by 90%. In recent years, many studies have been conducted on the causal relationships between green energy consumption and economic growth in the US [3,4,5,6], emphasizing how institutional and political policies have impacted on the diffusion of US renewable energy and the decrease in fossil fuels [7]. In this context, the US commercial real estate industry has made significant strides in energy efficiency [8] and sustainability [9] using green energy sources. Many policies and initiatives have been put in place to encourage and facilitate the adoption of more environmentally friendly practices in this sector [10,11,12]. In this context, the Energy Performance of Buildings Directive requires all new real estate construction beginning after 2021 to adhere to the “virtually zero-energy buildings” standard in order to combat the property industry’s GHG emissions’ slow decline [13]. Incentives, technological advancements, and cost reductions all contribute to reducing barriers that hinder renewable energy development [14], paving the way to continue expanding the use of green energy in the future [15]. Energy efficiency and sustainability are becoming increasingly valued in the commercial sector not only for the environmental benefit aspects but also for investing in energy-efficient technologies, and infrastructure is becoming a sliding door for constructors and property managers to increase the market value of their properties [16].
Based on these premises, this project aims to analyze in depth how the energy transition path is developing in the commercial real estate sector. This study compares this green energy diffusion scenario with the one of another exemplary and significant US sector, the industrial one, focusing on examining the relationships between renewable and carbon fossil energy diffusion. Energy policies for the commercial and industrial sectors in the US are similar in many ways, as both sectors are subject to the same national- and state-level policies regarding energy efficiency and sustainability [17]. However, the specifics of these policies and regulations may differ based on several factors, such as the scale, energy intensity, and operational differences between the two sectors [18].
In the literature, diffusion models have been extremely valuable for defining and forecasting the development of an energy source, considering it as a technology that must be accepted in a market [19]. This well-established area of study [19,20,21,22,23] allows for analysis of the temporal dynamics of energy sources in order to comprehend the intricate dynamics of energy systems. Understanding how products or technologies compete or collaborate is essential for describing the trend of diffusion processes. Depending on the situation, the presence of competition can act both as a barrier to the growth of the innovation under consideration and as a stimulus for its development [24]. From this perspective, this project studies and compares commercial and industrial sectors’ energy transitions in order to comprehend the intricate dynamics of energy systems through a refinement of the UCTT multivariate diffusion model presented in [25]. This paper examines the temporal diffusion of coal, gas, and biomass in the two sectors to identify peculiarities, similarities, and differences that characterize each energy system since the development and diffusion among different sectors can play a role in establishing technological innovation systems [26].
The rest of this paper is organized as follows. Section 2 clarifies the methodological approach based on the UCTT model refinement and presents the data of interest. In Section 3, the model is applied to the commercial and industrial sector cases, and the main outcomes are illustrated. Section 4 is left for concluding discussion about the findings. Furthermore, Appendix A reports a detailed explanation of the refinement method applied, while Appendix B discusses similarities and differences between the old and new UCTT model versions.

2. Materials and Methods

The data on the energy transition in the US commercial and industrial sectors were retrieved from the US Energy Information Administration [27] and refer to the energy consumption (billion Btus) for electricity generation and useful thermal output from 2003 to 2021 (2003, from which biomass data are available, is considered the starting date, even if the data for the other energy sources are available from 2001). The analysis focuses on three primary energy sources: coal (coal, petroleum liquids, petroleum coke), gas (natural gas), and biomass (wood waste biomass, landfill gas, biogenic municipal solid waste, other waste biomass). Figure 1 illustrates the observed time series for each sector separately.
Grounded on the diffusion model literature, the analysis has been implemented through a refinement of the synchronic form of the ODE multivariate diffusion model called Unbalanced Competition for Three Technologies (UCTT) [25] (for the industrial case, the constraint assumption ( ζ = ρ + ξ ) has been considered on the model). The model is a system of differential equations in which z i ( t ) , i = 1 , 2 , 3 reflects the instantaneous consumption of the first, second, and third technologies, respectively, and z i ( t ) , i = 1 , 2 , 3 indicates the cumulative consumption of each technology i.
z 1 ( t ) = m { [ p 1 d + ( q 1 d + ζ ) z 1 ( t ) m + q 1 d z 2 ( t ) + z 3 ( t ) m ] } [ 1 z ( t ) m ] z 2 ( t ) = m { [ p 2 d + q 2 d z 2 ( t ) m + ( q 2 d ρ ) z 1 ( t ) + z 3 ( t ) m ] } [ 1 z ( t ) m ] z 3 ( t ) = m { [ p 3 d + q 3 d z 3 ( t ) m + ( q 3 d ξ ) z 1 ( t ) + z 2 ( t ) m ] } [ 1 z ( t ) m ] m = m 1 d + m 2 d + m 3 d z ( t ) = z 1 ( t ) + z 2 ( t ) + z 3 ( t )
The description of the parameters is summarized in Table 1 (see [25] for a more extensive discussion of the model’s parameters). The crucial feature of this model is its ability to capture and compare the interplay of different energy sources using the same modeling approach, testing the nature and significance of the relationship between technologies that may be in competition (when the cross-influence parameter estimate is negative) or collaboration (when this parameter estimate is positive).
The refinement proposed in this paper has been implemented on the z ( t ) i components. The previous version of the model presented in [25] considered z ( t ) i to be the observed cumulative series of each i series in the phase where all the three sources compete in the market, assuming an initial condition of z ( 0 ) i = 0 . Instead, following the lead of [28], in this work, the model implementation has been progressed by introducing an initial condition in which the first value z ( 0 ) i of the cumulative series z ( t ) i has to be ideally as close as possible to the cumulative historical value of the series examined at the time before the competition begins. From the standpoint of the multivariate diffusion model world, this new assumption plays a crucial role in introducing additional knowledge on the life cycle of the energy sources. This is fundamental for better estimating the parameters that reflect the scale of the process and identifying more precisely the factors that determine the trends during the competition phase. So, in this analysis, these initial conditions have been introduced to this new version of the UCTT model, considerably changing the z ( t ) i values. Consequently, the m i d values that are initialized as the Bass model market potential of each z ( t ) i are also different from the previous version of the model (see [29] for a detailed description of the parameter).
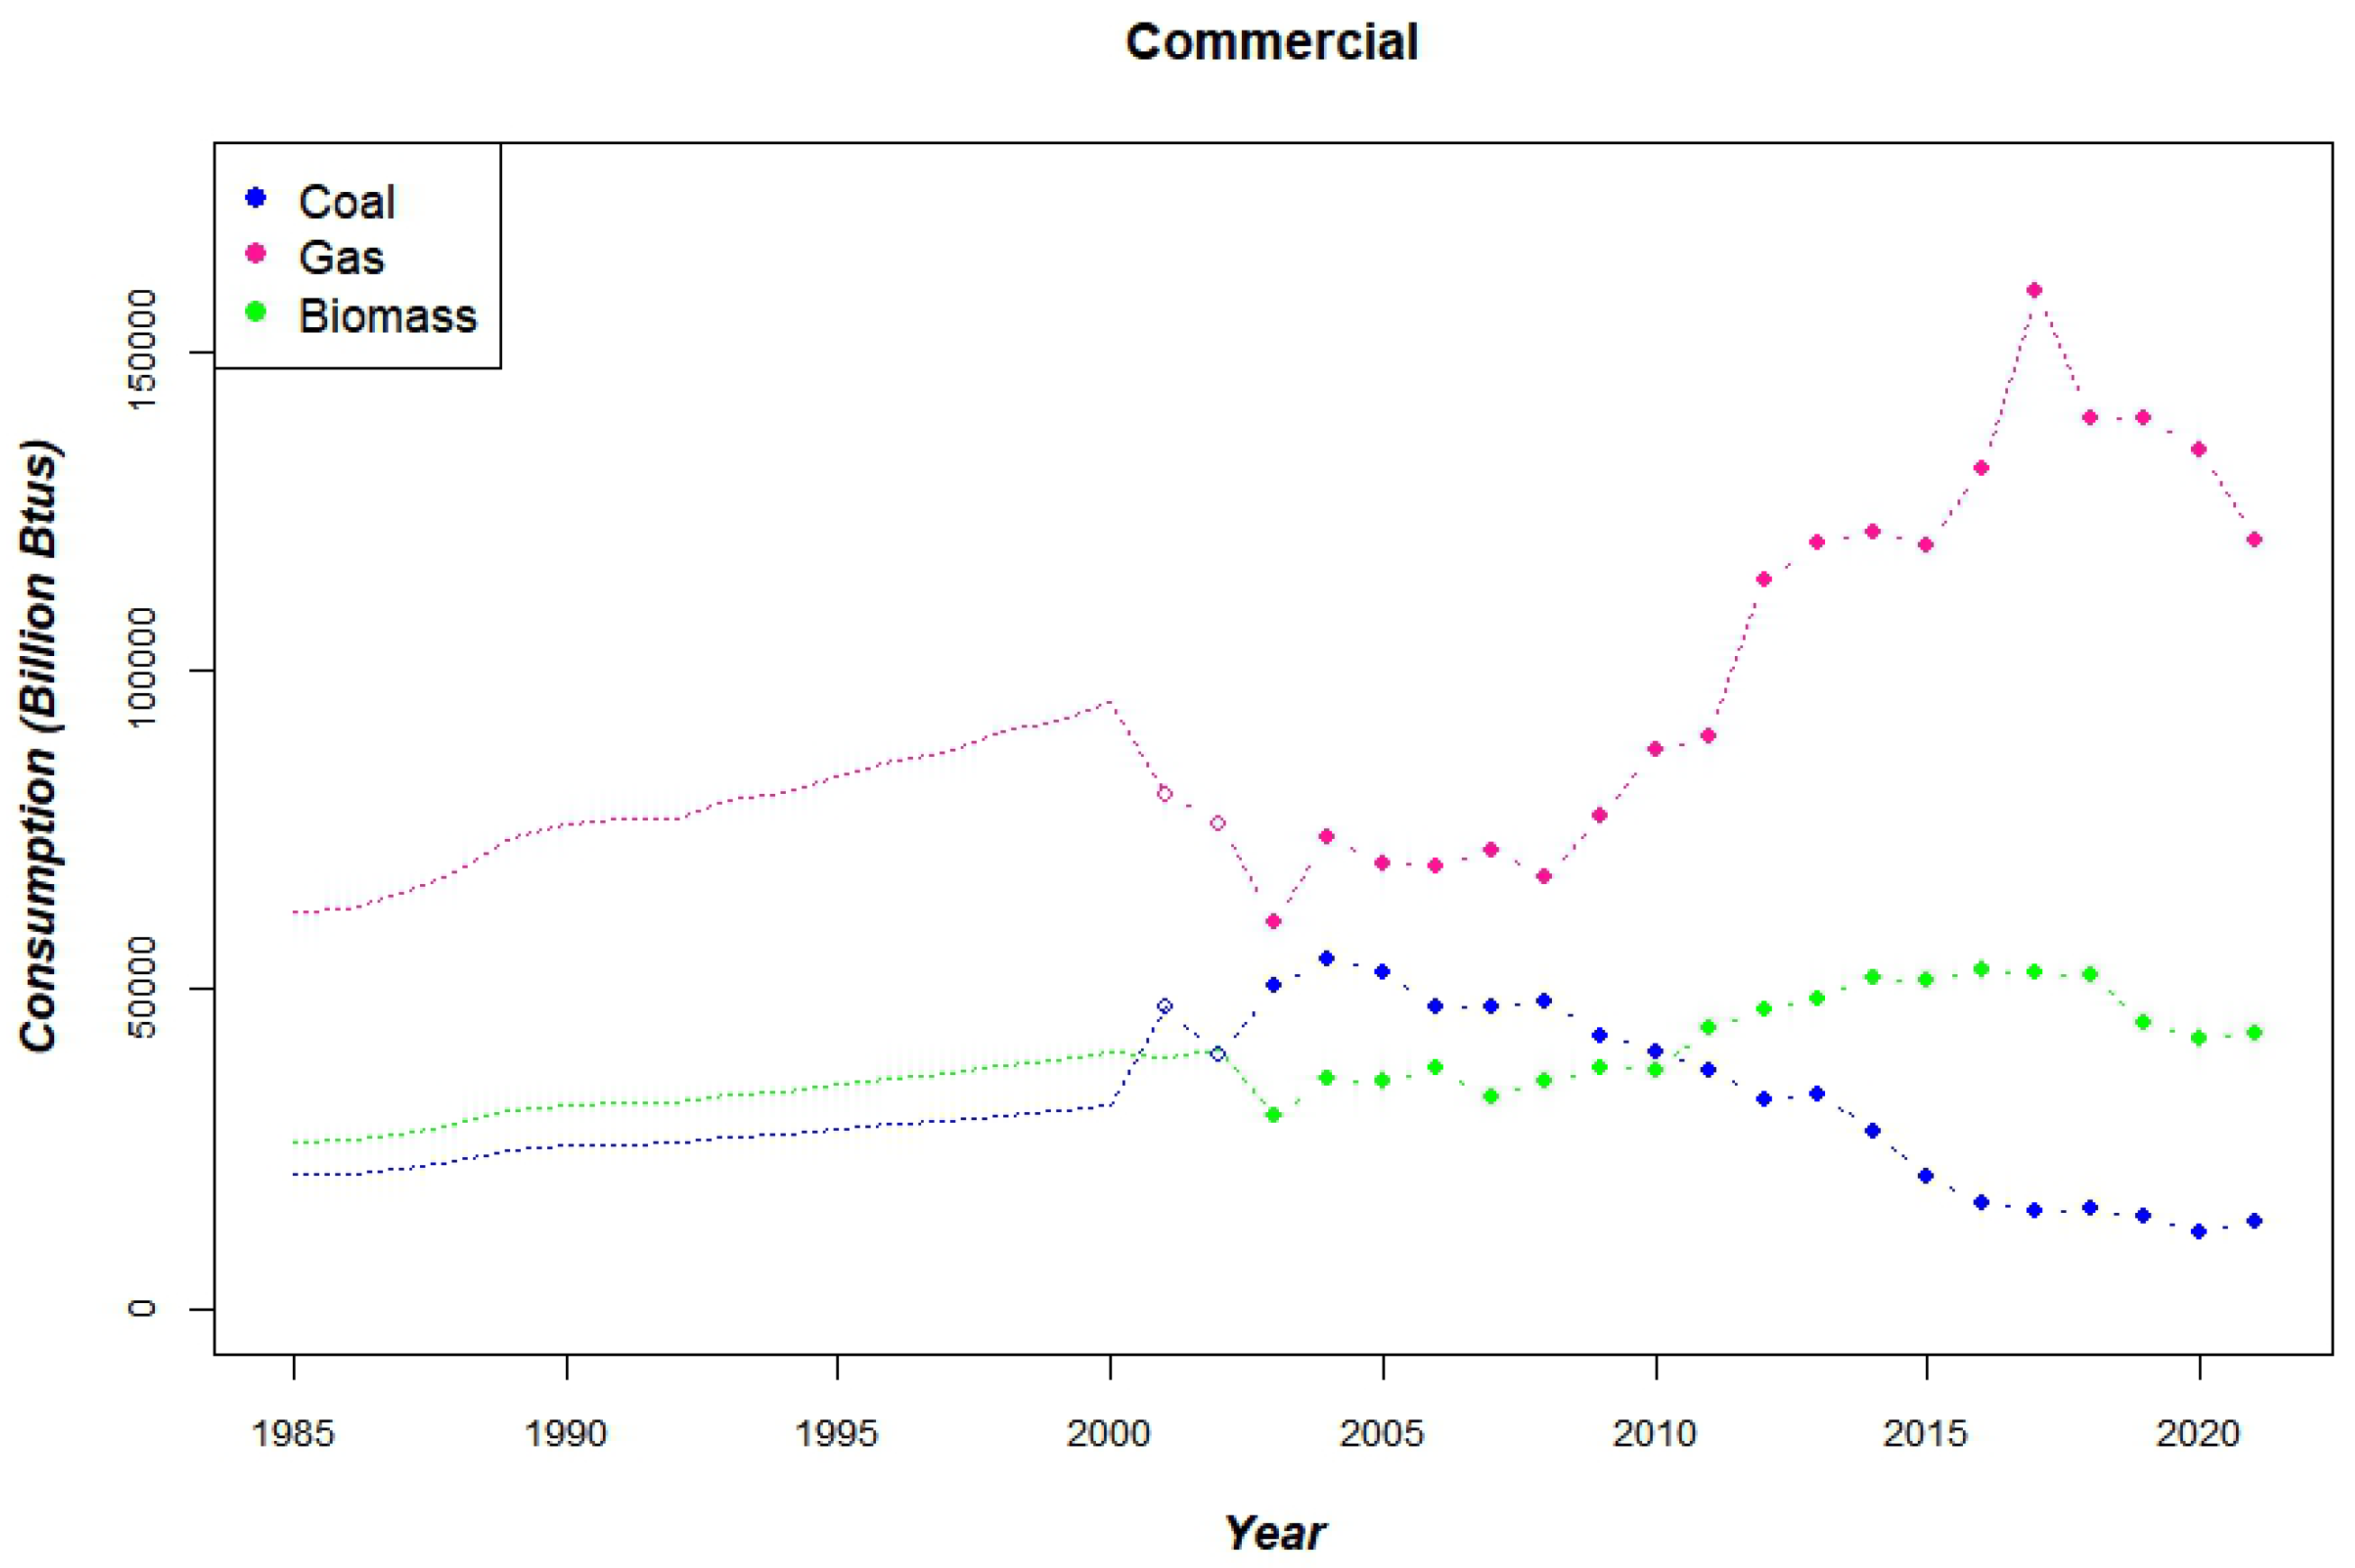
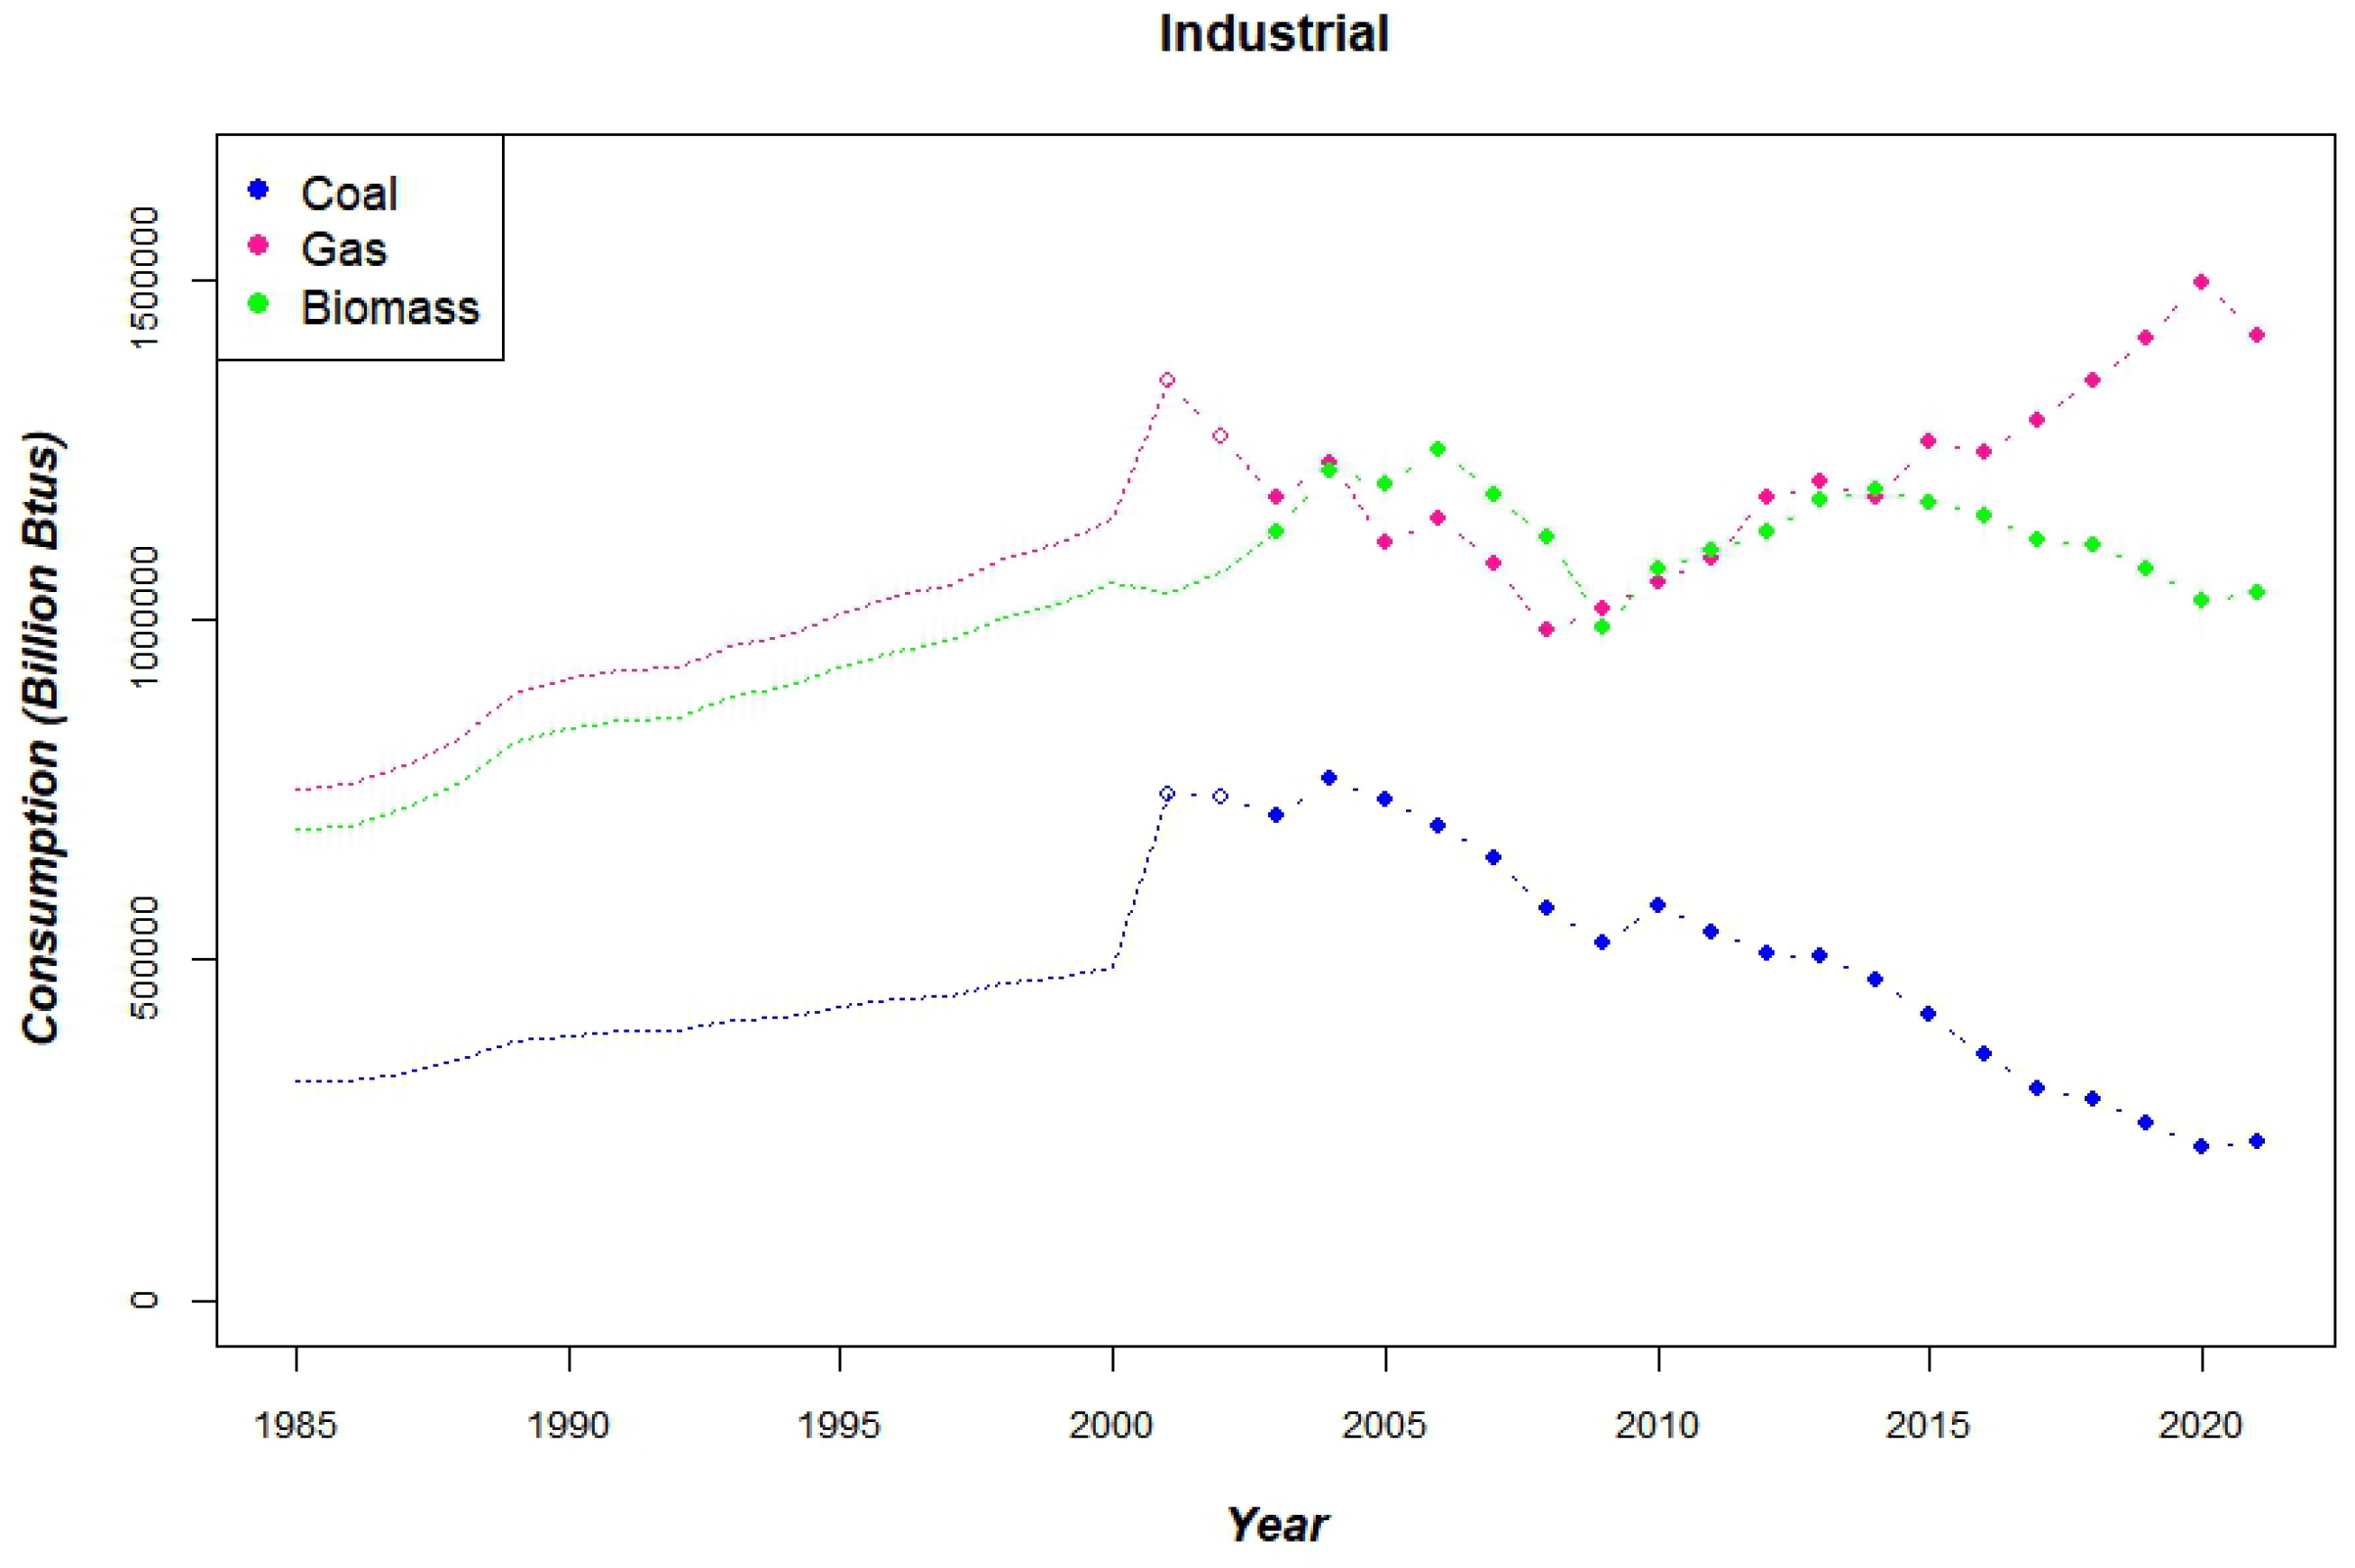
The data analyzed are accessible from 2001 (coal and gas) and 2003 (biomass); however, it is known that these sources were employed for generation power prior to these dates [30]. To take into account this crucial information and set up the initial condition of the model, the series of US total electricity generation (billion Btus) from 1985 to 2021 has been utilized to calculate an estimation of the initial value z ( 0 ) i for the three series analyzed (source: BP Statistical Review of World Energy [31]). Since the BP series includes all energy sources, the average proportion of electricity generated via each of the three series of interest has been calculated from 2001 (or 2003, respectively) to 2021. Based on these averages, approximations of the series from 1985 to 2001 (or 2003, respectively) have been generated. The initial condition of each source was set as the cumulative value of the new approximated series in 2002 (for coal and gas, the values of 2001 and 2002 were retrieved for the EIA’s available ones to be more precise in the z ( 0 ) i definition). The specification of the method utilized to calculate the estimation of the initial value z ( 0 ) i and illustrations of the approximative historical series for both sectors are reported in Appendix A.

3. Model Application and Results

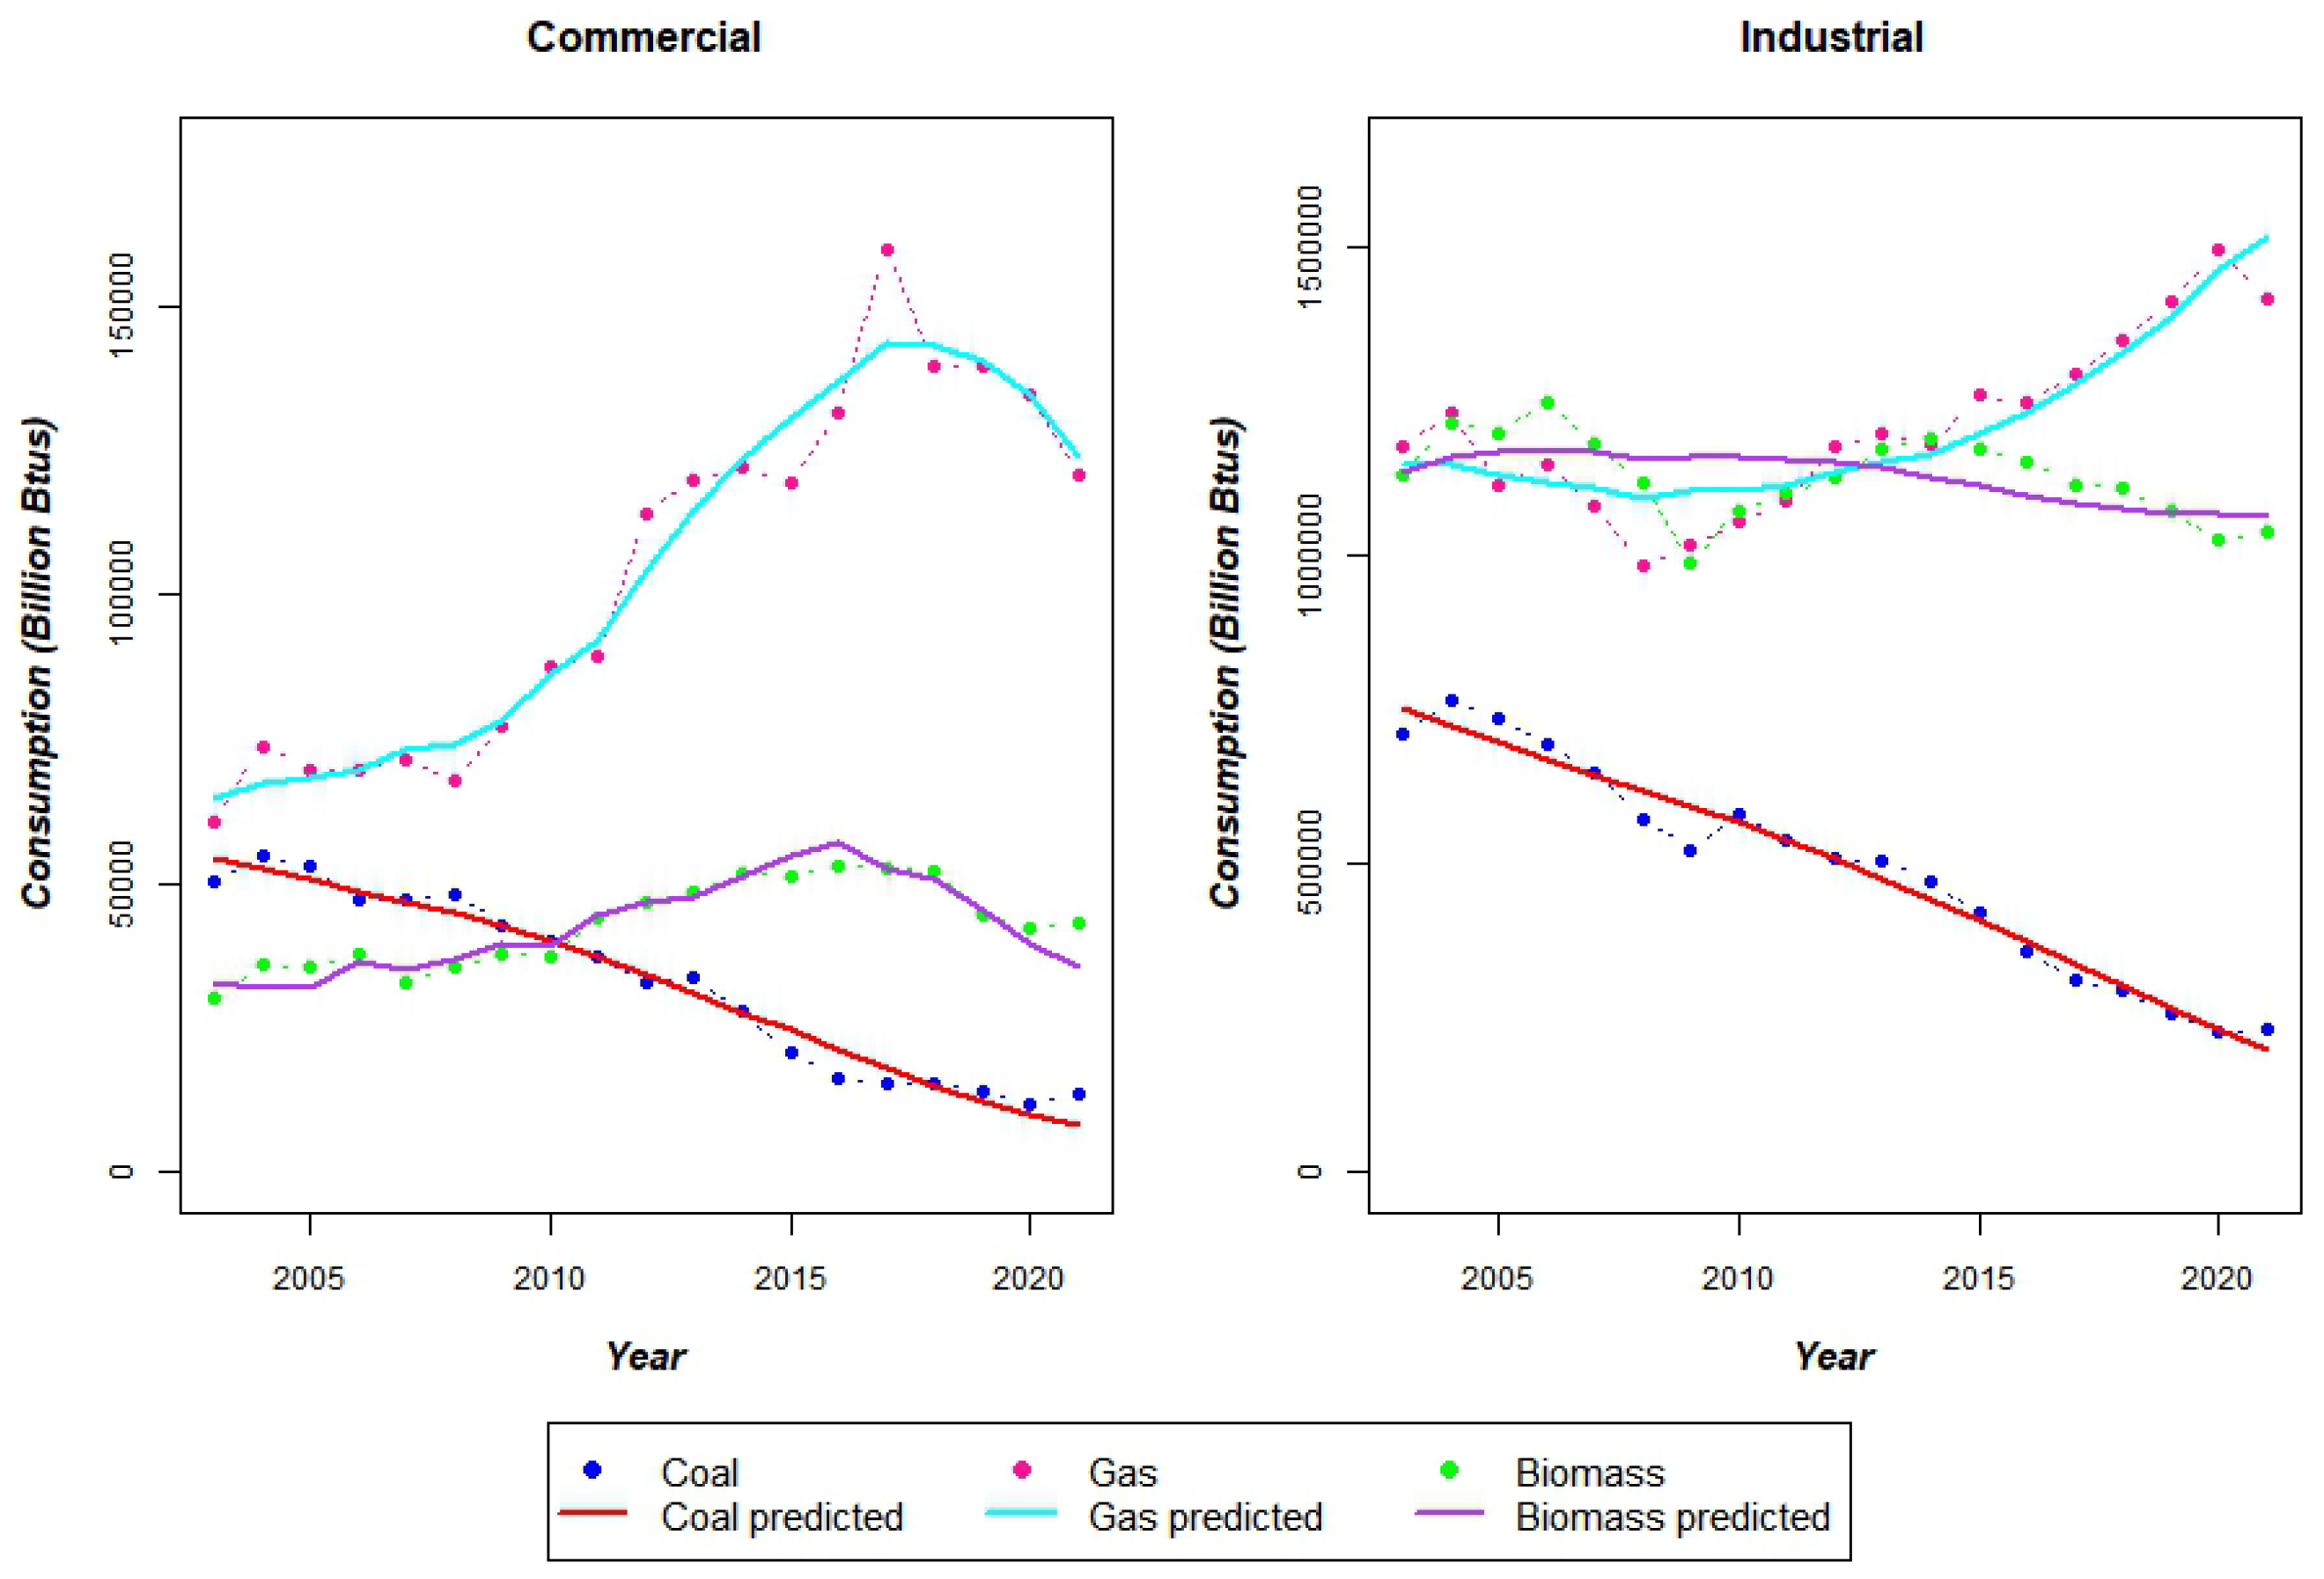
Figure 2 shows that the model can account for the energy transitions in both sectors. The models present a satisfactory result in terms of the goodness-of-fit and significance of parameters (see Table A1 and Table A2 in Appendix B), and the relationships between the three competitors take a clear meaning. Critical parameter estimates are summarized in Table 2 and denote that coal and gas have similar parameter estimation values, whereas the different patterns for biomass emphasize a distinct evolution of the energy transition in the two sectors. The estimates for coal’s internal influence are positive and relatively weak (in the commercial case, the parameter ζ is not significant, which is a reasonable outcome given its stable trend in the last years evaluated) and the cross-influence ones are negative and powerless, which is coherent with the declining direction of both series determined by the contenders’ competition and coal’s own weak strength on the market due to the more intense restrictions on its utilization. The gas results highlight solid internal growth and a significant competition. Competitors (especially biomass) seem to be able to wield a mighty competitive force; in the commercial sector, this is more emphasized by the highest value of cross-influence, which reflects the gas series trend decline in the last years observed. Besides this competition, the strong and positive internal coefficients show the importance of this energy source in both markets. For the green energy source, the sectors present different results. The negative internal influence estimate for the industrial one contemplates the difficulty of developing the consumption of green energy sources, which is fluctuating around an evident stable trend. The collaborative support highlighted from the cross-influence corresponds to the necessary push promoted by competitors, who, by reducing their use, force the continued pursuit of green source development. On the contrary, the commercial sector presents a strong internal influence, emphasizing the force of the incentives promoted to stimulate renewable diffusion and a negative cross-influence driven by the strong gas development within the market, which has limited biomass expansion.

4. Discussion

The efficacy and distributional implications of policies and initiatives on the energy transition of the US commercial sector are still broadly open questions to date. Answering these questions with sound analyses is crucial to the future design of policies as well as the implementation of ESG regulations by private-sector operators. The analysis conducted in this paper does not consider specific policy implementation; still, it may provide a useful means to describe and explore, in a relatively simplified way, the dynamics occurring between the studied critical energy sources in the US commercial sector.
The UCTT model indicated that the grounds for the energy transition in the US commercial sector are strong: biomass is growing and sustained by a widespread internal belief towards sustainability pursuits. Still, it also suggested a significantly negative effect played by gas and coal, limiting their expansion due to their higher efficiency to date and presence in the market. On the contrary, the model identifies a negative internal component in the industrial sector that outlines biomass consumption’s complex and slow diffusion. It also accounts for a positive influence of competitors that describes the need to make up for reducing fossil fuel consumption to undergo the tight CO2 emission levels and pursue environmental policies.
From this perspective, how different policies may affect the relationships among energy sources in this market remains an open question. According to [7], renewable energy policies are important tools in stimulating the deployment capacity of green energy sources for electricity, although their effectiveness varies depending on the type of policy instrument. From this standpoint, a possible future development benefit from diffusion models is to study each individual policy’s impact within the relationships identified by the UCTT model; this could be a first step toward a more quantitative analysis of policy effects on the energy transition.
In conclusion, compared to the industrial sector, the US commercial sector has a more ready and suitable environment to accelerate the energy transition to renewables. In the industrial sector, progress is occurring slowly; more excellent material and energy efficiency, a more rapid uptake of renewable fuels, and a faster development and deployment of low-carbon production processes are all critical requirements. Instead, the commercial sector’s trend towards adopting green energy solutions is expected to persist as policy initiatives, private sector action, and market forces continue to decrease the cost of renewable energy technologies and improve sustainability and energy efficiency in the real estate market.

Funding

This research was funded by the Steers Center for Global Real Estate, McDonough School of Business, Georgetown University, Washington, DC, USA.

Institutional Review Board Statement

Not applicable.

Informed Consent Statement

Not applicable.

Data Availability Statement

All the data used in this analysis are public. As reported in Section 2, the source is: the US Energy Information Administration [27] and refer to the energy consumption (billion Btus) for electricity generation and useful thermal output from 2003 to 2021.

Conflicts of Interest

The authors declare no conflict of interest.

Abbreviations

The following abbreviations are used in this manuscript:
BtuBritish thermal unit
EIAEnergy Information Administration
GDPGross Domestic Product
ODEsOrdinary Differential Equations
RETRenewable Energy Technology
UCTTUnbalanced Competition for Three Technologies

Appendix A

This appendix illustrates the approximate reconstruction of the coal, gas, and biomass time series in both the commercial and industrial sectors. As mentioned in Section 2, the series of US total electricity generation ( T O T ) [31] from 1985 to 2021 has been utilized to calculate an estimate of the initial conditions z ( 0 ) i for the three series analyzed in both sectors considered. This series aggregates all the US electricity generation, without distinctions of sectors or technology types.
For each technology series in each sector ( T E C i ), the approximate series from 1985 to 2001 has been reconstructed with the basic method described below (for simplicity, the year 2001 is used to define the time division between approximate and observed series, but for biomass it is implied to be 2003 instead of 2001: see Section 2 for details).
-
Calculate the average of the observed yearly proportion:
A V i = m e a n ( T E C ( j ) i T O T ( j ) ) , for j = 2001, …, 2021.
-
Calculate the yearly approximate series:
T E C ( j ) i = T O T ( j ) * A V i , for j = 1985, …, 2001.
It is recognized that the approximate series obtained with this basic method are different from the real ones; still, since the real series are not available, this study aims to provide only an estimate of the cumulative series before 2001, and this method has been considered a sufficient starting point. Especially for the coal series, it is known from the literature that the series should be characterized by a strong decreasing trend instead of the flat ones presented in the graphs below. Still, though the scope of this work is not to replicate the real series of coal, gas, and biomass in the two sectors, this reconstruction has been used as an instrument to estimate the values to initialize the initial conditions of the model (this approximate reconstruction could be improved through a more sophisticated method, but this is not the focus of this work. Some tests were run by changing the initial conditions, and the model returned similar estimates that do not modify the interpretation of the results of this paper).
Figure A1. Approximate reconstruction through the basic method described in Appendix A of coal, gas, and biomass time series for the US commercial sector.
Engproc 39 00015 g0a1
Figure A2. Approximate reconstruction through the basic method described in Appendix A of coal, gas, and biomass time series for the US industrial sector.
Engproc 39 00015 g0a2

Appendix B

The parameter estimate results from the new versions of the UCTT model implementation on the data analyzed are reported in this Appendix.
Table A1. Parameter estimates of new version of the UCTT model for the commercial sector.
EstimateStd.ErrorLowerUpperp-Value
m d 6,973,17991,0916,794,6447,151,7140.0000
p 1 d 0.01560.00170.01230.01900.0000
p 2 d −0.05390.0042−0.0622−0.04560.0000
p 3 d −0.01320.0022−0.0175−0.00890.0000
q 1 d −0.02340.0123−0.04760.00080.0642
q 2 d 0.75080.06740.61880.88280.0000
q 3 d 2.03320.45491.14162.92470.0000
ζ 0.07480.0569−0.03660.18620.1950
ρ 1.27200.13171.01391.53010.0000
ξ 2.60070.59791.42883.77260.0001
Table A2. Parameter estimates of the new version of the constrained UCTT model for the industrial sector.
EstimateStd.ErrorLowerUpperp-Value
m d 187,205,02040,593,547107,643,130266,766,9100.0000
p 1 d 0.00750.00180.00400.01100.0001
p 2 d 0.00120.0018−0.00240.00470.5270
p 3 d 0.00340.00130.00090.00600.0107
q 1 d −0.02910.0099−0.0485−0.00960.0051
q 2 d 0.28010.09600.09190.46830.0054
q 3 d −0.18610.0753−0.3336−0.03850.0170
ρ 0.43540.14890.14370.72720.0052
ξ −0.33270.1362−0.5996−0.06580.0183

References

  1. Jäger, J.; O’Riordan, T. The history of climate change science and politics. In Politics of Climate Change; Routledge: London, UK, 2019; pp. 1–31. [Google Scholar]
  2. Energy Transition. Available online: https://www.irena.org/energytransition (accessed on 8 February 2023).
  3. Alola, A.A.; Yildirim, H. The renewable energy consumption by sectors and household income growth in the United States. Int. J. Green Energy 2019, 16, 1414–1421. [Google Scholar] [CrossRef]
  4. Carmona, M.; Feria, J.; Golpe, A.A.; Iglesias, J. Energy consumption in the US reconsidered. Evidence across sources and economic sectors. Renew. Sustain. Energy Rev. 2017, 77, 1055–1068. [Google Scholar] [CrossRef]
  5. Omri, A. An international literature survey on energy-economic growth nexus: Evidence from country-specific studies. Renew. Sustain. Energy Rev. 2014, 38, 951–959. [Google Scholar] [CrossRef] [Green Version]
  6. Payne, J.E. On biomass energy consumption and real output in the US. Energy Sources Part B Econ. Plan. Policy 2011, 6, 47–52. [Google Scholar] [CrossRef]
  7. Kilinc-Ata, N. The evaluation of renewable energy policies across EU countries and US states: An econometric approach. Energy Sustain. Dev. 2016, 31, 83–90. [Google Scholar] [CrossRef]
  8. Ionescu, C.; Baracu, T.; Vlad, G.E.; Necula, H.; Badea, A. The historical evolution of the energy efficient buildings. Renew. Sustain. Energy Rev. 2015, 49, 243–253. [Google Scholar] [CrossRef]
  9. Starr, C.W.; Saginor, J.; Worzala, E. The rise of PropTech: Emerging industrial technologies and their impact on real estate. J. Prop. Invest. Financ. 2021, 39, 157–169. [Google Scholar] [CrossRef]
  10. Robinson, S.; McIntosh, M.G. A Literature Review of Environmental, Social, and Governance (ESG) in Commercial Real Estate. J. Real Estate Lit. 2022, 30, 54–67. [Google Scholar] [CrossRef]
  11. Basher, S.A.; Masini, A.; Aflaki, S. Time series properties of the renewable energy diffusion process: Implications for energy policy design and assessment. Renew. Sustain. Energy Rev. 2015, 52, 1680–1692. [Google Scholar] [CrossRef] [Green Version]
  12. Popp, D.; Hascic, I.; Medhi, N. Technology and the diffusion of renewable energy. Energy Econ. 2011, 33, 648–662. [Google Scholar] [CrossRef]
  13. Hirsch, J.; Spanner, M.; Bienert, S. The carbon risk real estate monitor—Developing a framework for science-based decarbonizing and reducing stranding risks within the commercial real estate sector. J. Sustain. Real Estate 2019, 11, 174–190. [Google Scholar] [CrossRef]
  14. Eleftheriadis, I.M.; Anagnostopoulou, E.G. Identifying barriers in the diffusion of renewable energy sources. Energy Policy 2015, 80, 153–164. [Google Scholar] [CrossRef]
  15. Norberg-Bohm, V. Creating incentives for environmentally enhancing technological change: Lessons from 30 years of US energy technology policy. Technol. Forecast. Soc. Chang. 2000, 65, 125–148. [Google Scholar] [CrossRef]
  16. Leskinen, N.; Vimpari, J.; Junnila, S. The impact of renewable on-site energy production on property values. J. Eur. Real Estate Res. 2020, 13, 337–356. [Google Scholar] [CrossRef]
  17. Bagheri, M.; Delbari, S.H.; Pakzadmanesh, M.; Kennedy, C.A. City-integrated renewable energy design for low-carbon and climate-resilient communities. Appl. Energy 2019, 239, 1212–1225. [Google Scholar] [CrossRef]
  18. Kiliccote, S.; Olsen, D.; Sohn, M.D.; Piette, M.A. Characterization of demand response in the commercial, industrial, and residential sectors in the United States. Adv. Energy Syst. Large-Scale Renew. Energy Integr. Chall. 2019, 425–443. [Google Scholar] [CrossRef] [Green Version]
  19. Bunea, A.M.; Guidolin, M.; Manfredi, P.; Della Posta, P. Diffusion of Solar PV Energy in the UK: A Comparison of Sectoral Patterns. Forecasting 2022, 4, 456–476. [Google Scholar] [CrossRef]
  20. Guidolin, M.; Manfredi, P. Innovation Diffusion Processes: Concepts, Models, and Predictions. Annu. Rev. Stat. Its Appl. 2023, 10. [Google Scholar] [CrossRef]
  21. Bessi, A.; Guidolin, M.; Manfredi, P. Diffusion of Renewable Energy for Electricity: An Analysis for Leading Countries. In Theory and Applications of Time Series Analysis and Forecasting: Selected Contributions from ITISE 2021; Springer International Publishing: Cham, Switzerland, 2022; pp. 291–305. [Google Scholar]
  22. Savio, A.; Ferrari, G.; Marinello, F.; Pezzuolo, A.; Lavagnolo, M.C.; Guidolin, M. Developments in Bioelectricity and Perspectives in Italy: An Analysis of Regional Production Patterns. Sustainability 2022, 14, 15030. [Google Scholar] [CrossRef]
  23. Bessi, A.; Guidolin, M.; Manfredi, P. The role of gas on future perspectives of renewable energy diffusion: Bridging technology or lock-in? Renew. Sustain. Energy Rev. 2021, 152, 111673. [Google Scholar] [CrossRef]
  24. Guidolin, M.; Alpcan, T. Transition to sustainable energy generation in Australia: Interplay between coal, gas and renewables. Renew. Energy 2019, 139, 359–367. [Google Scholar] [CrossRef]
  25. Savio, A.; De Giovanni, L.; Guidolin, M. Modelling energy transition in Germany: An analysis through Ordinary Differential Equations and System Dynamics. Forecasting 2022, 4, 438–455. [Google Scholar] [CrossRef]
  26. Malhotra, A.; Schmidt, T.S.; Huenteler, J. The role of inter-sectoral learning in knowledge development and diffusion: Case studies on three clean energy technologies. Technol. Forecast. Soc. Chang. 2019, 146, 464–487. [Google Scholar] [CrossRef]
  27. US Energy Information Admnistration: Electricity Power Annual 2021. 2013. Available online: https://www.eia.gov/electricity/annual/Last (accessed on 6 February 2023).
  28. Guseo, R.; Mortarino, C. Within-brand and cross-brand word-of-mouth for sequential multi-innovation diffusions. IMA J. Manag. Math. 2014, 25, 287–311. [Google Scholar] [CrossRef] [Green Version]
  29. Bass, F.M. A new product growth for model consumer durables. In Management Science 15-5; INFORMS: Catonsville, MD, USA, 1969; pp. 215–227. [Google Scholar]
  30. Pérez-Lombard, L.; Ortiz, J.; Pout, C. A review on buildings energy consumption information. Energy Build. 2008, 40, 394–398. [Google Scholar] [CrossRef]
  31. British Petroleum, Statistical Review of World Energy Full Report 2022. 2022. Available online: https://www.bp.com/en/global/corporate/energy-economics/statistical-review-of-world-energy/primary-energy.html (accessed on 1 April 2023).
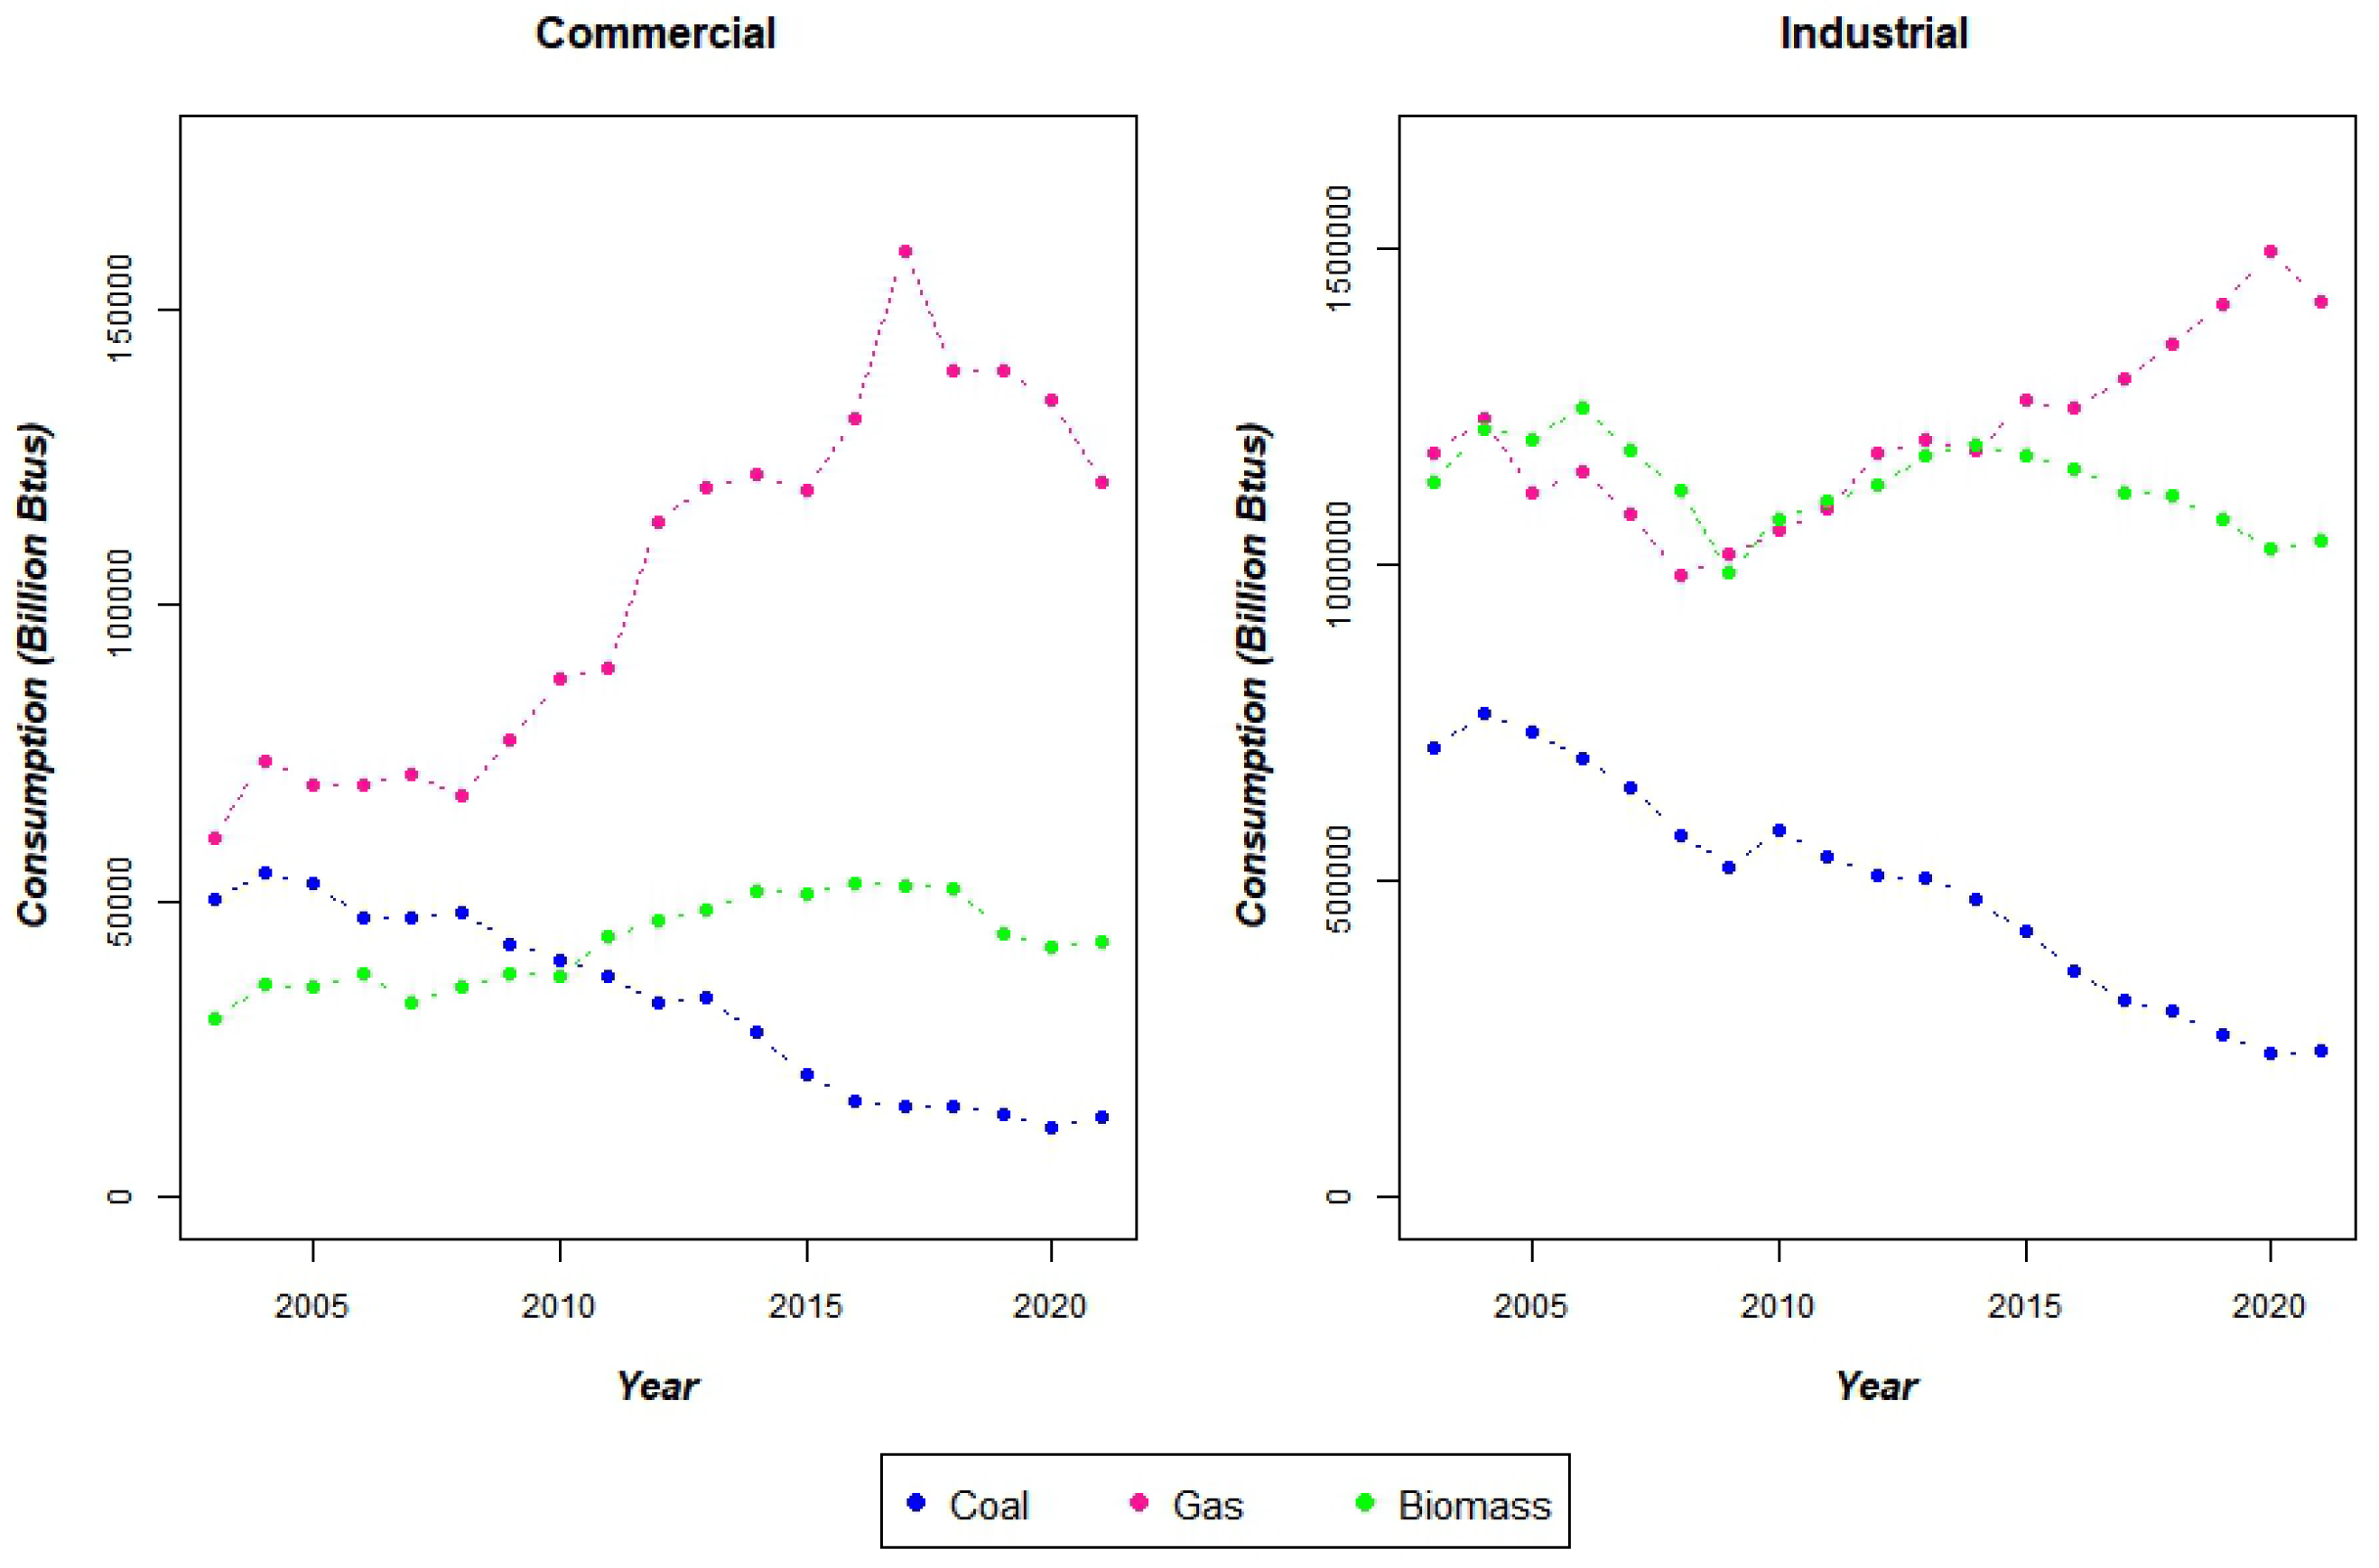
Figure 1. Observed time series of energy consumption for electricity generation and useful thermal output of coal, gas, and biomass in the US commercial and industrial sectors (2003–2021).
Engproc 39 00015 g001
Figure 2. Observed and predicted time series of energy consumption for electricity generation and useful thermal output of coal, gas, and biomass in the US commercial and industrial sectors (2003–2021).
Engproc 39 00015 g002
Table 1. Description of the UCTT model’s parameters.
m = m 1 d + m 2 d + m 3 d Market potential:
max. consumption level in that market for the analyzed technologies
p 1 d , p 2 d , p 3 d Seed coefficient of each technology:
initial dissemination of the technology
q 1 d + ζ , q 2 d , q 3 d Internal influence of each technology:
technology-specific growth after the innovation phase
q 1 d , q 2 d ρ , q 3 d ξ Cross-influence of each technologies:
competitors’ effect on the considered technology
Table 2. UCTT internal and cross-influence parameter estimates by sector.
InfluenceCommercialIndustrial
CoalInternal0.05140.0737
Cross−0.0234−0.0291
GasInternal0.75080.2801
Cross−0.5212−0.1553
BiomassInternal2.0332−0.1861
Cross−0.56750.1466
Disclaimer/Publisher’s Note: The statements, opinions and data contained in all publications are solely those of the individual author(s) and contributor(s) and not of MDPI and/or the editor(s). MDPI and/or the editor(s) disclaim responsibility for any injury to people or property resulting from any ideas, methods, instructions or products referred to in the content.