Abstract
Black-liquor-thickening in an integrated multi-effect evaporation plant consumes substantial amounts of steam produced in pulp and paper mills, and its efficient operation is, thus, crucial. Industrial applications of heat pumps in the pulp and paper industry, especially in black liquor evaporation, show promise in terms of cutting energy consumption and in decarbonizing this industrial branch. Modelling of such a plant includes momentum, heat and mass transfer issues, enriched with black liquor material specification. An existing black liquor evaporation plant which thickens inlet black liquor from 17% to 75% wt. dry solids with a dry solid flow of 2500 tonnes per day is considered. It already includes a MVR (mechanical vapor recompression) pre-evaporator as well as water-condensate stripping columns. A mathematical model of this plant is created in a Matlab environment and, after verification of obtained results, it serves for analyses of possible plant modifications. Among the modification options, installation of a second MVR is modeled and its impact on the whole plant is examined. As a result, a differential (marginal) change in steam and electricity consumed in the plant is obtained. Model results indicate the possibility of a reduction of process steam consumption of around 10 tonnes per hour and an increase in electricity consumption of 600 kW. A favorable simple payback period of 2.5 years can be expected for the considered investment.
1. Introduction
Human society is facing climate change and its consequences, and suitable actions need to be undertaken quickly to prevent it from becoming disastrous. Industry belongs to sectors where, despite the progress already achieved, a large improvement can still be achieved by reducing the use of fossil fuels, by switching to renewable energies and by increasing energy and material efficiency [1]. Among the most energy-intensive industry sectors, chemicals and refining, iron and steel and pulp and paper [2] can be named as, taken together, they stand for the majority of industrial fuel and energy consumed as well as for greenhouse gases released to the atmosphere [3,4].
Most of today’s paper is made by the sulphite process. During the paper production process, significant amounts of valuable side products are produced. Their reuse lowers costs for purchasing chemicals and energies. The main substance considered is black liquor (BL)—dark, liquid residual material from wood chips cooking, containing inorganic cooking chemicals and dissolved organics [5]. Inorganic compounds (namely Na2CO3 and Na2SO4) present in black liquor can be recovered by suitable methods, yielding an aqueous solution mixture of sodium sulphite (Na2S) and sodium hydroxide (NaOH) termed white liquor (WL). Organic compounds (lignin, polysaccharides, low molecular weight carboxylic acids, methanol…) can be easily combusted, and the released heat represents a major part of the heat produced for a paper mill’s needs [6]. The Kraft recovery process incorporates these two approaches into one process unit. The first step of the process is diluted BL thickening in a multiple-effect evaporator train. During the stepwise BL thickening, volatile organic compounds (methanol and non-condensable organic gases) are released from BL and are concentrated and separated as side streams of the evaporator [7].
Multiple-effect evaporators are used in various industrial spheres, such as dairy, sugar production, paper mills, inorganic brine concentration and water desalination [8,9]. It is heat-powered separation equipment, supplying cascading heat in the form of low- or middle-pressure steam down to lower pressures and to vacuum, ending with the lowest-pressure steam being condensed in a condenser and heat being rejected to the environment. As an alternative, electricity-powered evaporation can be considered, recompressing the evaporated water to serve as a heating medium. Such an arrangement is termed Mechanical Vapor Recompression (MVR); being a kind of heat pump, it is gradually being applied in distillation processes [10,11] and evaporators [12,13]. It can facilitate both evaporation operation cost decreases and unit capacity increases, both effects being desired in industrial conditions [14,15].
The present study aims at analyzing the current performance of a highly integrated black liquor evaporator in a large-scale paper mill, already equipped with an MVR unit processing half of the black liquor delivered to the evaporator. A mathematical model is developed and verified, serving for future evaporator operation assessment with a second MVR unit installed. The resulting energy consumption change is assessed, and primary energy consumption change is calculated. The simple payback period of such an investment is estimated and its dependence on energy prices and other factors is estimated. Thereby, a contribution to industrial energy efficiency in pulp and paper mills is targeted.
2. Materials and Methods
2.1. Case Study Characterization
The considered evaporator consists of seven pressure levels and evaporator effects plus a MVR pre-evaporator (mechanical vapor recompression system).
The evaporator processes 15 to 15.5 kt of diluted BL per day (2500 t of dry solids per day) at full load. The diluted BL is split into two parts; half of it is fed to the MVR, while the remainder bypasses it. The MVR system both secures additional pre-evaporation before entering the evaporation cascade and financial savings, based on lowering the amount of fresh steam consumed in the evaporation plant. The diluted black liquor from the cooking section of the pulp mill contains circa 16% dry solids (BLDS) by mass. Further processing of thickened black liquor in a recovery boiler required the BLDS to be increased in the evaporator train to at least 70% by mass. A schematic depiction of the evaporator is provided in Figure 1.
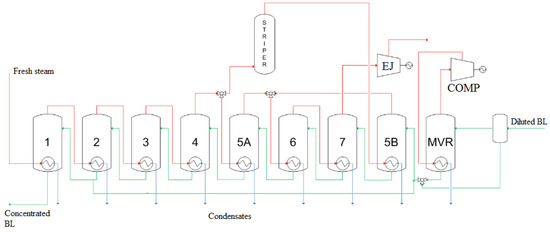
Figure 1.
Schematic depiction of material streams considered in the evaporator train model, including black liquor streams (green), water steam streams (red) and steam condensates (blue). BL—black liquor, COMP—compressor, EJ—ejector, MVR—mechanical vapor recompression. Numbers 1 to 7 denote evaporator effects. Source: Own elaboration.
2.2. Model Description
Model input data consist of a BLDS profile, inlet liquor flow, its temperature, corresponding dry solids amount and desired thickening level, driving forces in each effect, the ratio of black liquor mass flow thickened in MVR to total black liquor mass flow, and MVR conditions (effect temperature and compression adiabatic efficiency). Model outputs include temperature and pressure profile. Model is based on mass and energy balances of the evaporator train and includes exchanged heat calculation in each heat exchanger. The BL exhibits a boiling point rise (BPR) compared to pure water, meaning its boiling temperature is higher than that of pure water at the same pressure. Clay’s equation [16], Equation (1), was adopted to calculate the BPRs in all effects.
with DS denoting dry solids mass fraction. To reach the desired output (=calculate temperature profile), the following mathematical criterion, f(i), was used, in Equation (2)
with i denoting individual evaporator effects and ∆Qi represents the difference between the calculated heat flux and the heat flux resulting from heat balance of the given evaporator effect. Once the temperature profile was estimated, a pressure profile was calculated using steam tables [17] and considering the BPRs. The calculation evolution diagram is provided in Figure 2.
BPR (°C) = 7.4 × 9.1 × DS/(8.1 − 7.1 × DS)
f(i) = ∑i (∆Qi)2 = min
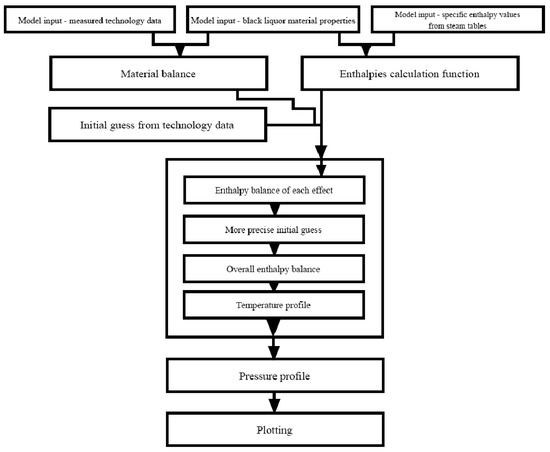
Figure 2.
Computation development diagram. Source: Own elaboration.
Considering the results of mass and energy balance of the evaporator, its coefficient of performance (COP) can be defined, in Equation (3):
COP = (Water evaporation rate excluding water evaporated in MVR)/(Fresh
steam consumption)
steam consumption)
Considering the evaporator’s operation in two states, A and B, differing in throughput, and, thus, in water evaporation rates and fresh steam consumption, the marginal COP, COPm, can be defined, in Equation (4):
COPm = (Difference in water evaporation rates excluding water evaporated
in MVR)/(Difference in fresh steam consumption)
in MVR)/(Difference in fresh steam consumption)
A future operational state, C, is derived from A by adding an identical MVR to the existing one to be operated in parallel. This plant layout modification yields a decrease in fresh steam consumption and an increase in electricity consumption. The resulting change in energy efficiency of the evaporator can be assessed by evaluating the Differential Primary energy savings (DPES), in Equation (5):
where the difference in fresh steam consumption is expressed in t/day, Δcondh stands for latent heat of fresh steam condensation and amounts to 2080 MJ/t (0.578 MWh/t) [18] and the difference in power consumption amounts to 14.4 MWh/day (0.6 MW). ηref,heat stands for the thermal efficiency of steam production from fuel and its value of 0.85 is assumed for a steam boiler fired by black liquor. ηref,e denotes the thermal efficiency of a fossil fuel-based power plant deemed to provide extra power needed to drive the new MVR compressors with a value of 0.4. A negative DPES value indicates that primary energy (fossil fuel) is saved because of new MVR implementation.
DPES = (Difference in fresh steam consumption) × Δcondh/ηref,heat +
(Difference in power consumption)/ηref,e
(Difference in power consumption)/ηref,e
2.3. Model Inputs
Model inputs for two current operational states, A and B, are summed up in Table 1.

Table 1.
Characterization of model inputs for two operational states, A and B. BL—black liquor, BLDS—Black liquor dry solids content, MVR—mechanical vapor recompression unit.
Further model inputs included the following parameters, based on real evaporator operation: ratio of BL thickened in MVR of 0.5; temperature in MVR effect of 80 °C; condensing temperature of recompressed steam in MVR effect heater of 85 °C; isentropic steam compression efficiency of MVR compressor of 80%. According to equipment documentation, the MVR compressor consumes 600 kW of electricity at full load operation.
Economic evaluation of a second MVR unit incorporated in the existing evaporator, being operated in parallel with the first one, is based on the following assumptions: fresh steam cost of 25 EUR/t, electricity cost of 150 EUR/MWh, 7000 h of operation per year. Total MVR capital cost estimate for second MVR unit commissioning of 3.2 million EUR resulted from consultations with the plant’s managers and reviewing capital costs associated with the first MVR unit commissioned a few years ago.
3. Results
3.1. Temperature and Pressure Profiles
A comparison of obtained and measured temperature profiles along with calculated pressure profiles is provided in Figure 3.
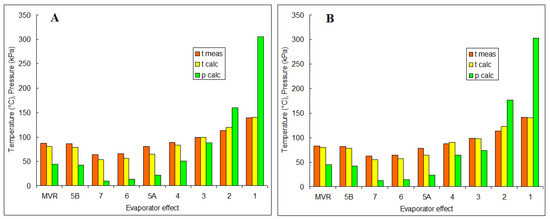
Figure 3.
Temperature (t) and pressure (p) profiles for operational states (A) (left hand) and (B) (right hand). Calc—calculated, meas—measured. Source: Own elaboration.
A comparison of obtained and measured temperature profiles along with calculated pressure profiles is provided in Figure 3. Differences between calculated and measured values are acceptable, mostly below 10 °C, and the temperature trends are similar. Considering the pressures, one sees that except effect 1 and 2, the evaporator operates in a vacuum. Pressure measurement in vacuum evaporators with risk of foaming, solid crystallization and droplet entrainment in steam flows can be troublesome, and decreased accuracy can be expected. No reliable measured data could be provided for this study by the plant’s operators, and thus, a pressure profile comparison is not possible.
3.2. Mass and Heat Balance
Obtained mass and heat balance results are summed up in Table 2. As can be seen, state B is characterized by a total water evaporation rate of around 10% compared to state A. However, there is just a modest decrease in water evaporation in the MVR unit. Measured and calculated steam consumption agree very well in both states, proving the developed evaporator model to be suitable for further calculations. In combination with the previous results shown in Figure 3, it can be stated that the model verification was successful. It is worth noting that the COP value lowers with decreasing throughput, reflecting the well-known fact that evaporators operate most efficiently at full throughput. The marginal COP value is significantly higher, exceeding 6, corroborating the previous finding. Thus, a fresh-steam saving due to the second MVR implementation will be lower than expected if the simple COP values are considered.
Table 2.
Summary of mass and heat balance of the evaporator in two current operational states, A and B, and after second MVR effect implementation, state C. COP—Coefficient of performance.
State C is derived from state A in terms of BL throughput by modifying the equipment by a new MVR addition. The fraction of diluted BL delivered to the evaporator and processed in MVRs rises, as a result, to 100%. As a consequence, a larger fraction of water is evaporated in the MVRs, followed by lower fresh steam consumption compared to state A by 263 t/day. The evaporator COP in this state is visibly lower than in state A and is even lower than in state B.
DPES criterion, Equation (5), evaluated from the difference in fresh steam and power consumption in states C and A, yields a value of −142.8 MWh/day. Primary energy consumption in state A, obtained by Equation (5), substituting the differences in energy consumption by their absolute values in state A, is 1921 MWh/day. This indicates that new MVR implementation in the evaporator can lower its primary energy consumption by more than 7%, making it more energy-efficient and more environmentally friendly.
A comparison of states C and A allows for calculating the saving of operational expenses associated with the second MVR unit operation: Decrease in steam consumption yields a 6575 EUR/day saving, while the increase in power consumption amounts to 2160 EUR/day extra expenses. Thus, 4415 EUR/day or 1.29 million EUR per year can be saved. The resulting simple payback period (PBP) is 2.5 years, which highlights the feasibility of new MVR commissioning. However, PBP is very sensitive to steam price: a decrease by 50% prolongs the PBP to almost 10 years. An electricity price increase by 50% yields only a modest PBP increase to 3.3 years.
4. Discussion
The presented energy-saving measure goes hand-in-hand with industry electrification that should result in greenhouse gas emission reductions from switching from fossil fuel- to renewable energy source (RES)-based electricity. In the particular case of the pulp and paper industry, most of the consumed energy comes from black liquor combustion and the resulting heat and power cogeneration on steam turbines. Implementing electrification measures, such as MVR installation, reducing fresh steam consumption, might not lead to fuel saving in the end; the decisive fact is whether the paper mill’s marginal steam source is fossil-based (natural gas) or RES-based (black liquor, bark, wood chips) [19]. Black liquor is not a tradable fuel; it must be combusted in the paper mill to ensure cooking chemical recovery. Thus, fresh steam consumption reduction in the paper mill can result either in excess steam venting or in an increase in condensing electricity production, provided spare capacity is available in the condensing part of the steam turbines installed in the paper mill. Thus, actual and planned future steam balances should be carefully reviewed on site to correctly assess the energy and economy impact of electrification measures in industry in general.
Fresh steam consumed in a paper mill’s evaporators has a pressure of 4 to 6 atmospheres, while that of live steam produced in large paper mills can range between 4 and 10 MPa [9,20]. The pressure difference between produced steam and steam demand in the mill is utilized in steam turbines, cogenerating electricity. This makes the DPES estimation less straightforward and, eventually, a more complex method of calculating it than in this study should be adopted. First, steam consumption reduction is associated with an in-house decrease in electricity production that might exceed 100 kWh/t, as shown in a similar study devoted to electricity-driven heat pump installation in a refinery [21]. Second, the resulting fuel consumption change would include more heat per ton of steam than just the evaporation heat, as a significant boiler feedwater subcooling and a significant steam superheat (both of the order of 0.1 MWh/t) should be considered. These two effects counteract each other in energy and economy impact estimation, so, under certain circumstances, the simplified approach adopted in this study can be adopted.
The black liquor processing capacity of the evaporator deserves attention as well. Following the general trends of production capacity increases, including those of paper mills, an evaporator can eventually become a bottleneck in production. For a highly integrated multiple-effect evaporator, such as in this study, a further evaporation capacity extension via evaporator refurbishment might be very costly. An MVR-based pre-evaporator addition or its intensification can be a simpler and less costly option in such a situation and might represent an additional incentive for plant managers to choose this option.
5. Conclusions
This study analyzes the energy and economy aspects of integrating an additional MVR into an existing highly integrated black liquor evaporator, already equipped with an MVR. The incentive for such a study can be found in industry decarbonization efforts which can be partly achieved by electrification of energy-intensive industries. For this purpose, a model of the existing evaporator (15.5 kt/day diluted black liquor processing rate) is developed and verified using two sets (state A and B) of operational data. As states A and B differ in processes BL mass flow, their modeling and comparison provides an insight into how the evaporator performs at lower evaporation rates. The obtained coefficient of performance values of 3.44 and 3.29, respectively, (excluding the MVR contribution) indicate worsened evaporator efficiency at lower throughputs.
The developed evaporator model is able to describe the temperature profile sufficiently, which, coupled with very good agreement between calculated and measured fresh steam consumption rates in states A and B, allows for claiming the model is verified and ready to be used for future state modeling. State C is derived from state A by adding the second MVR unit, identical to the first one, while leaving the black liquor processing rate unchanged. As a result, the evaporator’s coefficient of performance in state C reaches just 3.09. Despite this, the fresh steam consumption rate is decreased by over 260 t/day in exchange for a power consumption increase by over 14 MWh/day. The resulting differential primary energy saving in state C, compared to A, yields a decrease in primary energy use of over 7%.
The economic parameters of the second MVR unit installation are very sensitive to the fresh steam price and less sensitive to electricity prices. With a basic set of prices (steam: 25 EUR/t, electricity: 150 EUR/MWh) an attractive simple payback period of 2.5 years with an expected total investment of 3.2 mil. EUR is obtained. Attention should be paid to steam price variations; it can be derived from natural gas price fluctuations in the last few years, provided that natural gas is a marginal fuel for steam production in the paper mill. The marginal fuel may change along with the season of the year as a result of changing space heating requirements and heat losses to the surroundings; therefore, a more detailed assessment of any investment proposal impacting the steam and electricity balance of any industrial enterprise is recommended as a future extension of this study.
Funding
This work was supported by the Slovak Research and Development Agency, Grant No. APVV-18-0134.
Institutional Review Board Statement
Not applicable.
Informed Consent Statement
Not applicable.
Data Availability Statement
All data obtained by calculations are included in this contribution.
Conflicts of Interest
The author declares no conflict of interest. The funders had no role in the design of the study; in the collection, analyses, or interpretation of data; in the writing of the manuscript; or in the decision to publish the results.
References
- Rehfeldt, M.; Worrell, E.; Eichhammer, W.; Fleiter, T. A review of the emission reduction potential of fuel switch towards biomass and electricity in European basic materials industry until 2030. Renew. Sustain. Energy Rev. 2020, 120, 109672. [Google Scholar] [CrossRef]
- Rissman, J.; Bataille, C.; Masanet, E.; Aden, N.; Morrow, W.R.; Zhou, N.; Elliott, N.; Dell, R.; Heeren, N.; Huckestein, B.; et al. Technologies and policies to decarbonize global industry: Review and assessment of mitigation drivers through 2070. Appl. Energy 2020, 266, 114848. [Google Scholar] [CrossRef]
- Griffin, P.W.; Hammond, G.P.; Norman, J.B. Industrial decarbonisation of the pulp and paper sector: A UK perspective. Appl. Therm. Eng. 2018, 134, 152–162. [Google Scholar] [CrossRef]
- Gerres, T.; Chaves Ávila, J.P.; Llamas, P.L.; San Román, T.G. A review of cross-sector decarbonisation potentials in the European energy intensive industry. J. Clean. Prod. 2019, 210, 585–601. [Google Scholar] [CrossRef]
- Niemelä, K.; Tamminen, T.; Ohra-Aho, T. Characterisation of Black Liquor Constituents. Åbo Akademi University Official Website. Available online: http://web.abo.fi/fak/tkf/spk/costfp0901/Vienna_2010/2_07_Vienna_Niemela.pdf (accessed on 4 April 2023).
- Hruška, M.; Variny, M.; Haydary, J.; Janošovský, J. Sulfur Recovery from Syngas in Pulp Mills with Integrated Black Liquor Gasification. Forests 2020, 11, 1173. [Google Scholar] [CrossRef]
- Sixta, H.; Potthast, A.; Krotschek, A.W. Chemical Pulping Processes. Handbook of Pulp, 1st ed.; Wiley-VCH Verlag GmbH & Co.: Weinheim, Germany, 2006; pp. 169–170. [Google Scholar]
- Thabit, Q.; Nassour, A.; Nelles, M. Water Desalination Using the Once-through Multi-Stage Flash Concept: Design and Modeling. Materials 2022, 15, 6131. [Google Scholar] [CrossRef] [PubMed]
- Park, J.; Kim, Y.; Lim, J.; Cho, H.; Kim, J. Optimal operation of the evaporator and combustion air distribution system in a pulp mill to maximize biomass recycling and energy efficiency. J. Clean. Prod. 2022, 367, 133048. [Google Scholar] [CrossRef]
- Feng, Z.; Shen, W.; Rangaiah, G.P.; Dong, L. Design and control of vapor recompression assisted extractive distillation for separating n-hexane and ethyl acetate. Sep. Purif. Technol. 2020, 240, 116655. [Google Scholar] [CrossRef]
- Van Duc Long, N.; Han, T.H.; Lee, D.Y.; Park, S.Y.; Hwang, B.B.; Lee, M. Enhancement of a R-410A reclamation process using various heat-pump-assisted distillation configurations. Energies 2019, 12, 3776. [Google Scholar] [CrossRef]
- Lincoln, B.J.; Kong, L.; Pineda, A.M.; Walmsley, T.G. Process integration and electrification for efficient milk evaporation systems. Energy 2022, 258, 124885. [Google Scholar] [CrossRef]
- U.S. Department of Energy. Industrial Heat Pumps for Steam and Fuel Savings. A Best Practice Steam Technical Brief. Available online: https://www.energy.gov/sites/prod/files/2014/05/f15/heatpump.pdf (accessed on 12 March 2023).
- Kiss, A.A.; Ferreira, C.A.I. Chapter 10. Case studies. In Heat Pumps in Chemical Process Industry; CRC Press, Taylor & Francis Group: Boca Raton, FL, USA, 2017. [Google Scholar]
- Kim, Y.; Lim, J.; Cho, H.; Kim, J. Novel mechanical vapor recompression-assisted evaporation process for improving energy efficiency in pulp and paper industry. Int. J. Energy Res. 2022, 46, 3409–3427. [Google Scholar] [CrossRef]
- Clay, T.D. Evaporation Principles and Black Liquor Properties. TAPPI—Technical Association of the Pulp and Paper Industry. 2008. Available online: http://www.tappi.org/content/events/08kros/handouts/3-1.pdf (accessed on 5 April 2023).
- The International Association for the Properties of Water and Steam. The IAPWS Industrial Formulation 1997 for the Thermodynamic Properties of Water and Steam; IAPWS: Eflangen, Germany, 1997. [Google Scholar]
- Friend, D.G. Physical and Chemical Data. In Perry’s Chemical Engineers’ Handbook, 7th ed.; Perry, R.H., Ed.; McGraw-Hill Professional: London, UK, 1997. [Google Scholar]
- Rehfeldt, M.; Globisch, J.; Fleiter, T. Fuel choice in industrial steam generation: Empirical evidence reveals technology preferences. Energy Strategy Rev. 2019, 26, 100407. [Google Scholar] [CrossRef]
- Variny, M.; Blahušiak, M.; Janošovský, J.; Hruška, M.; Mierka, O. Optimization study on a modern regeneration boiler cold end operation and its feedwater system integration into energy system of a paper mill. Energy Effic. 2019, 12, 1595–1617. [Google Scholar] [CrossRef]
- Variny, M.; Furda, P.; Švistun, L.; Rimár, M.; Kizek, J.; Kováč, N.; Illés, P.; Janošovský, J.; Váhovský, J.; Mierka, O. Novel Concept of Cogeneration-Integrated Heat Pump-Assisted Fractionation of Alkylation Reactor Effluent for Increased Power Production and Overall CO2 Emissions Decrease. Processes 2020, 8, 183. [Google Scholar] [CrossRef]
Disclaimer/Publisher’s Note: The statements, opinions and data contained in all publications are solely those of the individual author(s) and contributor(s) and not of MDPI and/or the editor(s). MDPI and/or the editor(s) disclaim responsibility for any injury to people or property resulting from any ideas, methods, instructions or products referred to in the content. |
© 2023 by the author. Licensee MDPI, Basel, Switzerland. This article is an open access article distributed under the terms and conditions of the Creative Commons Attribution (CC BY) license (https://creativecommons.org/licenses/by/4.0/).