1. Introduction
Gases evaporate from manure, and mass exchange takes place between the liquid on the manure surface and the surrounding air flow. This evaporation process corresponds to the general structure of all evaporation processes, and the basis of its structure is convective mass exchange, wherein the gas flow varies depending on the convective mass transfer coefficient and the gas concentration gradient on the surface of the manure layer and on the surface of the manure [
1]. When choosing methods for the study of GHG emissions, it is necessary to evaluate the technology and technical solutions of keeping animals in the barn. When modernizing animal husbandry technologies, it is very important to reduce their impact on environmental pollution. Gas emissions must be reduced at all stages of manure management: in barns, manure pits, and during transport and the incorporation of manure into soil [
2,
3,
4]. In order to account for the modelling of greenhouse gas (GHG) emissions at farm level, it is necessary to define the main farm components from a farm-wide perspective [
5].
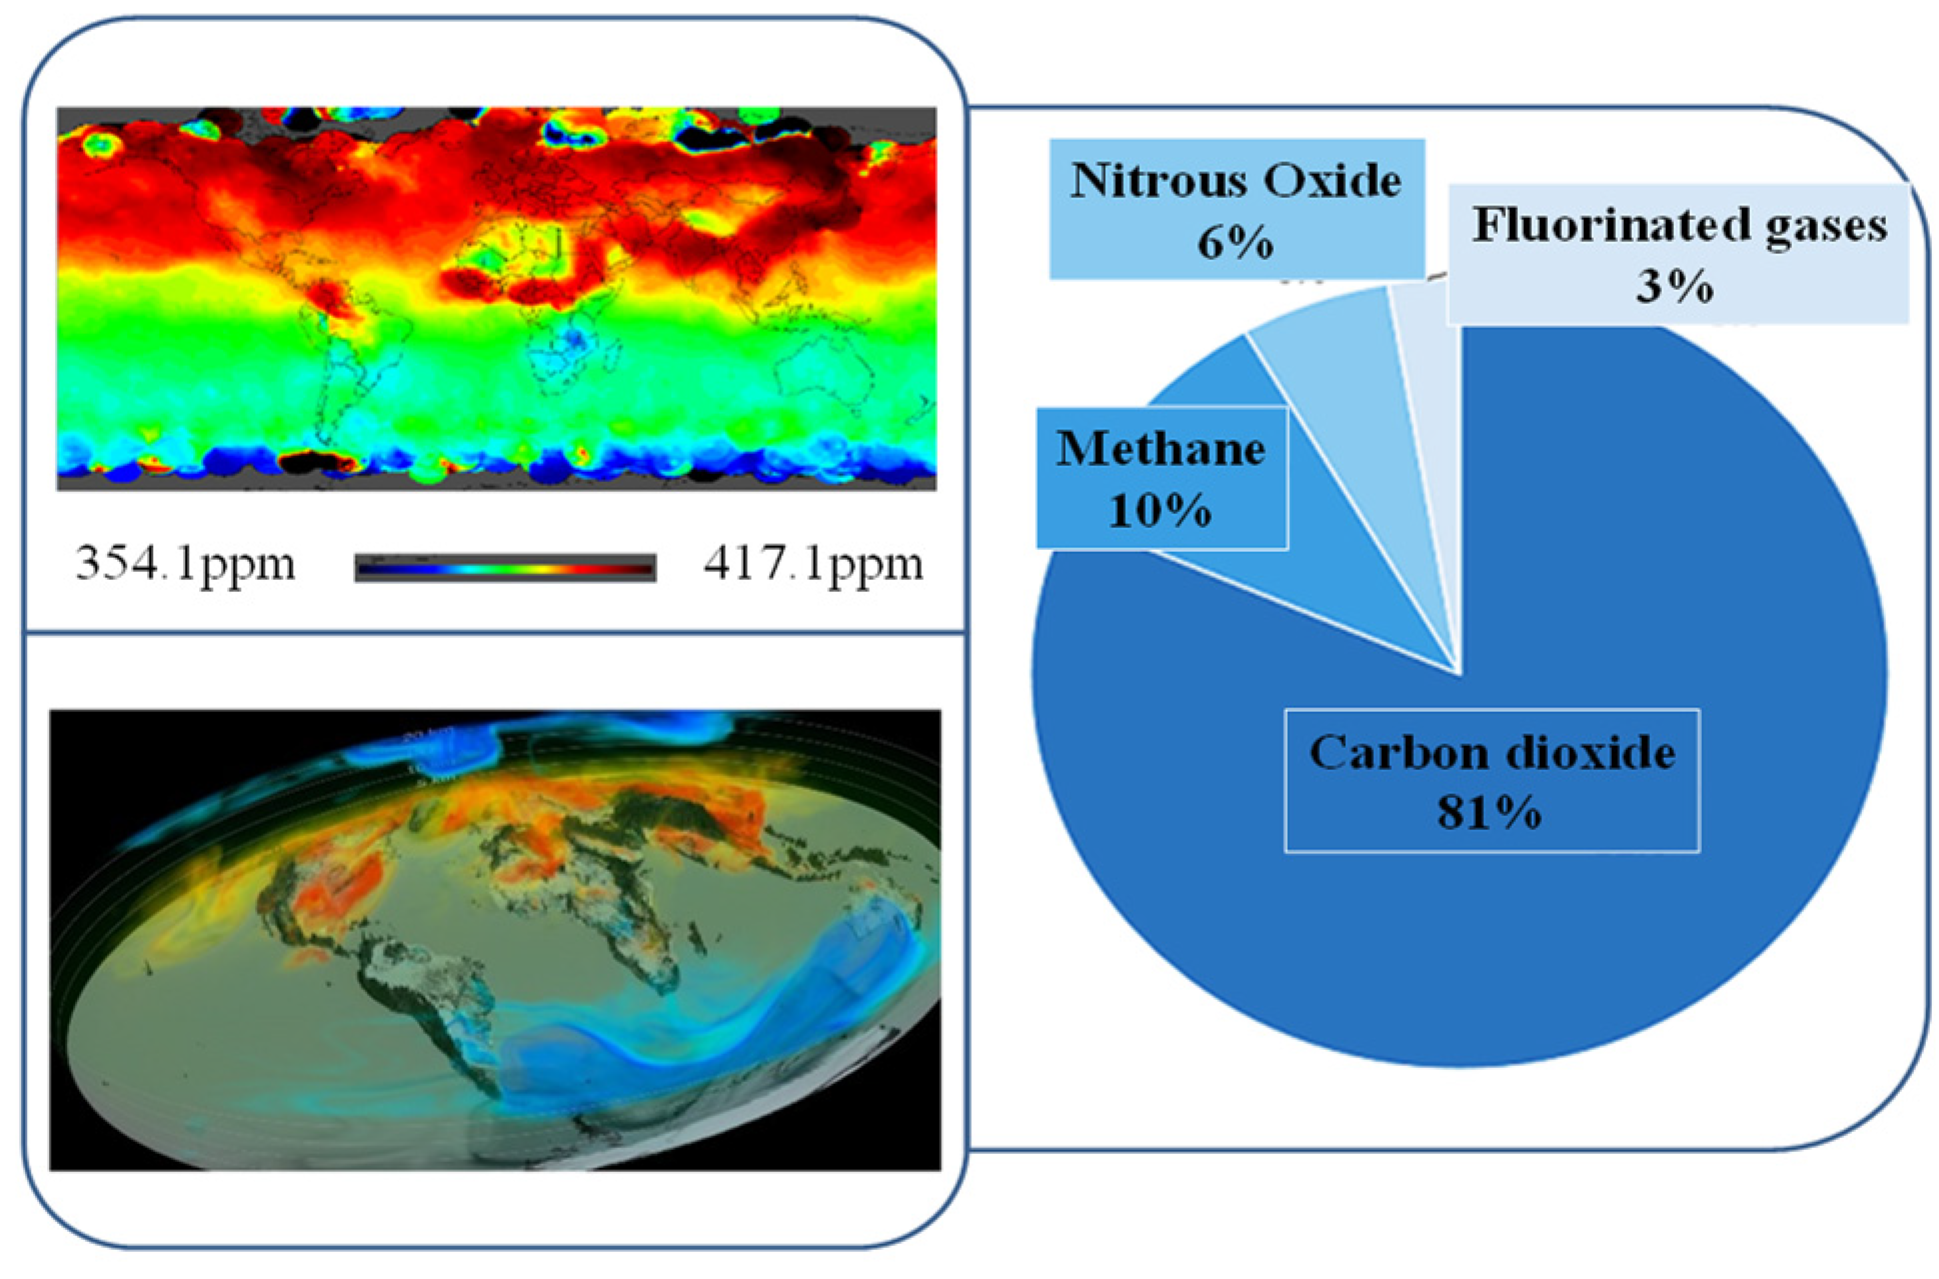
In animal husbandry, the most GHG emission into the environment is CH
4 gas, which accounts for as much as 91% of GHG emissions in animal husbandry; 79.0% evaporates from animal digestion processes, and 11.6% from manure management systems. Most methane evaporates from the digestive systems of cows (55.6%), from other cattle (39.2%), and from sheep (3.0%). In order to determine GHG emissions in animal husbandry, it is necessary to estimate emissions of the following gases: methane (CH
4) and nitrous oxide (N
2O). Understanding the carbon cycle is important for developing strategies to reduce CO
2 (
Figure 1).
2. Method
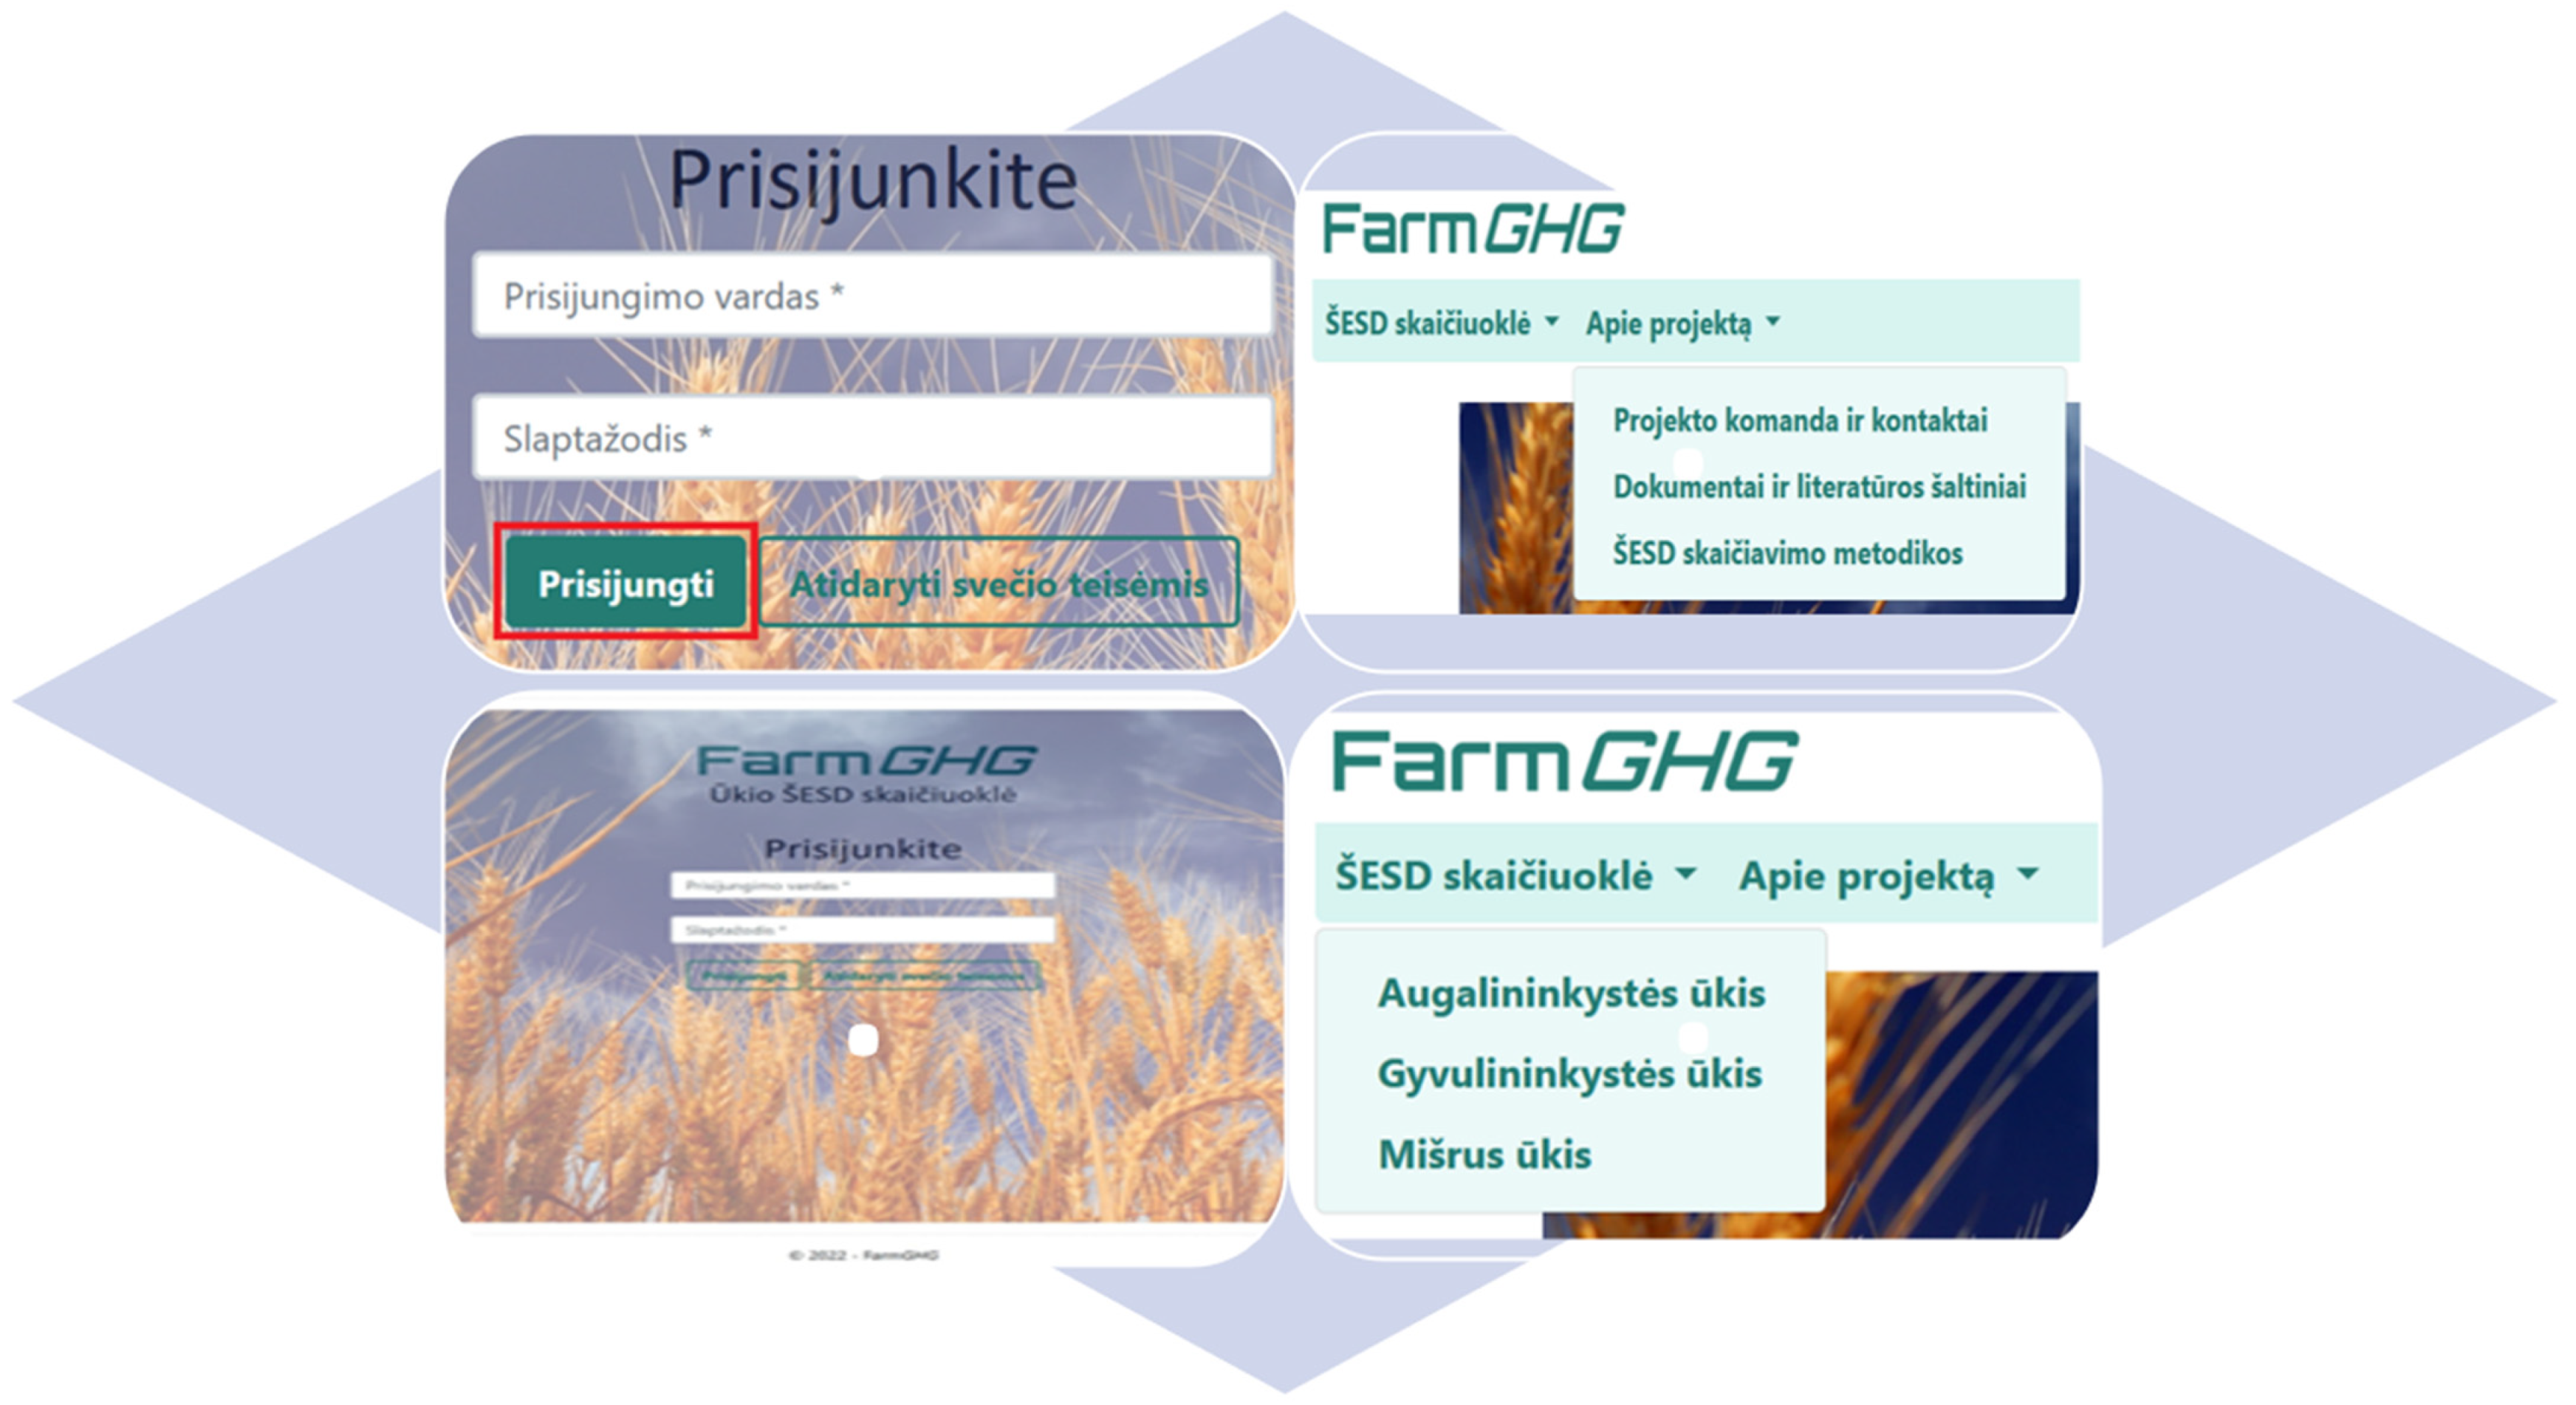
The accounting system for GHG emissions and CO2 absorptions at farm level is an IT tool created according to specially prepared GHG calculation methodologies and adapted formulas with selected variables and parameters. The prototype of the created accounting system is intended for use in the accounting of national greenhouse gas emissions and in “green” certification for providing consulting services. By applying the GHG emissions accounting system, the main aspects of the activities of mixed, animal husbandry, and crop farms that influence GHG can be evaluated.
It is mandatory to use the GHG accounting methodology of the Intergovernmental Panel on Climate Change [
7]. According to the IPCC methodology, based on the experience of other countries, a spectrum of GHG emission sources has been determined at farm level, including criteria defining the sustainability of the farm, and a methodology and system for accounting for GHG emissions at farm level has been created. The developed model system for calculating GHG emissions is calculated in three stages. The animal population is divided into subgroups, and each of them is described. The emission coefficients of each subgroup in kilograms per animal per year and the number of animals in the subgroup are evaluated. Three methods and levels (Tier 1, Tier 2, Tier 3) of detail and complexity were used for calculation. The accounting system for GHG emissions at farm level was created according to specially prepared GHG calculation methodologies, and adapted formulas with selected variables and parameters. It calculates the main parameters: enteric fermentation, CH
4, direct and indirect N
2O emissions, recalculated CO
2 emissions, and total emissions from manure management (
Figure 2).
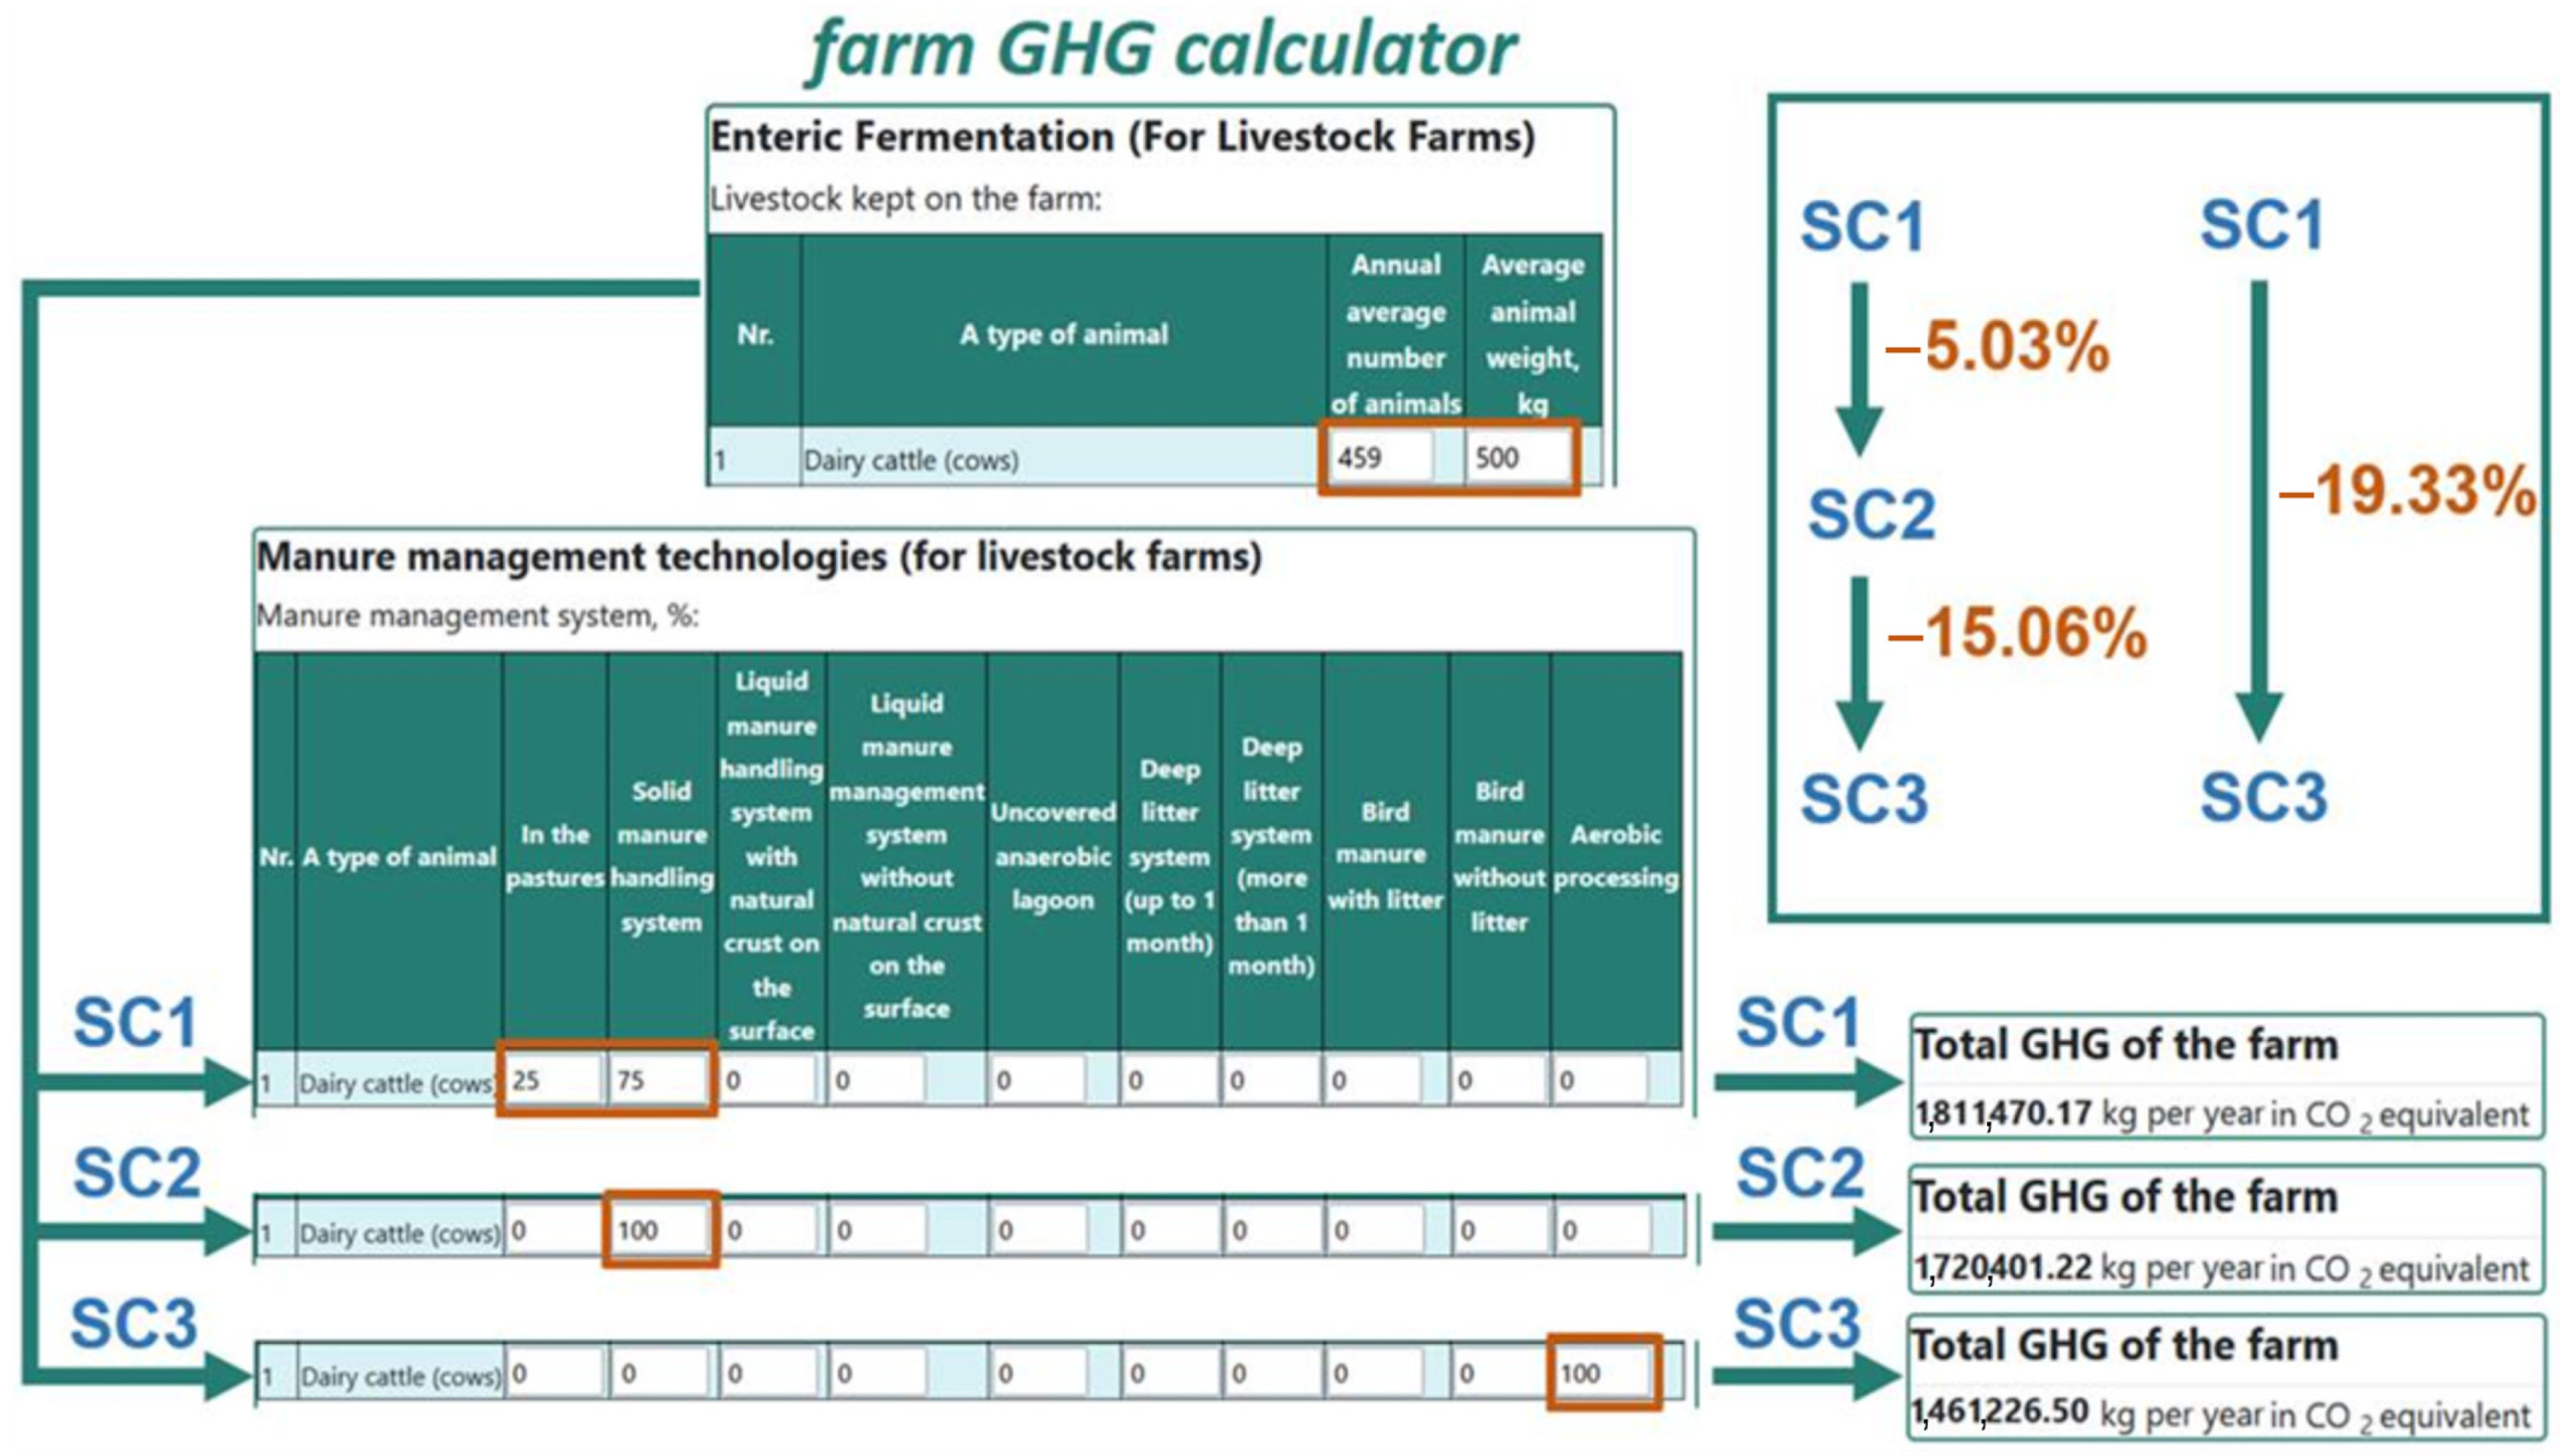
The calculation platform was tested using three scenarios: SC1—pasture 25%, solid manure management system 75%; SC2—pasture 0%, solid manure management system 100%; and SC3—aerobic recycling 100%.
Methane gas emissions are determined from animal digestion processes and manure management technologies, and direct and indirect emissions of nitrous oxide from manure. When calculating or experimentally determining the emission coefficients of methane and nitrous oxide gases, it is necessary to evaluate the conditions of keeping animals, the applied modern manure management technologies (manure removal from the barn, manure pits, manure incorporation into the soil), applied bio measures to optimize fermentation and microbiological processes, and temperature changes. A methodically based GHG accounting system that records more accurate data collection in specific farms would enable the state to identify problem areas to which measures aimed at reducing GHG emissions could be directed more appropriately, to carry out monitoring, and to analyze the benefits provided by the support.
3. Results and Discussion
After assessment of the calculation platform of different scenarios when simulating different manure management techniques, we identified effective measures for GHG reduction. It was evaluated that scenario SC1 (pasture 25%, solid manure management system 75%), with an average number of animals of 459 and an average animal weight of 500 kg, could reduce CO
2 eq by 5% per year. Scenario SC2 (pasture 0%, solid manure management system 100%) was more effective, and could reduce CO
2 eq by 15% per year. The most effective was scenario SC3 (aerobic recycling 100%), which could reduce CO
2 eq by more than 19% per year (
Figure 3).
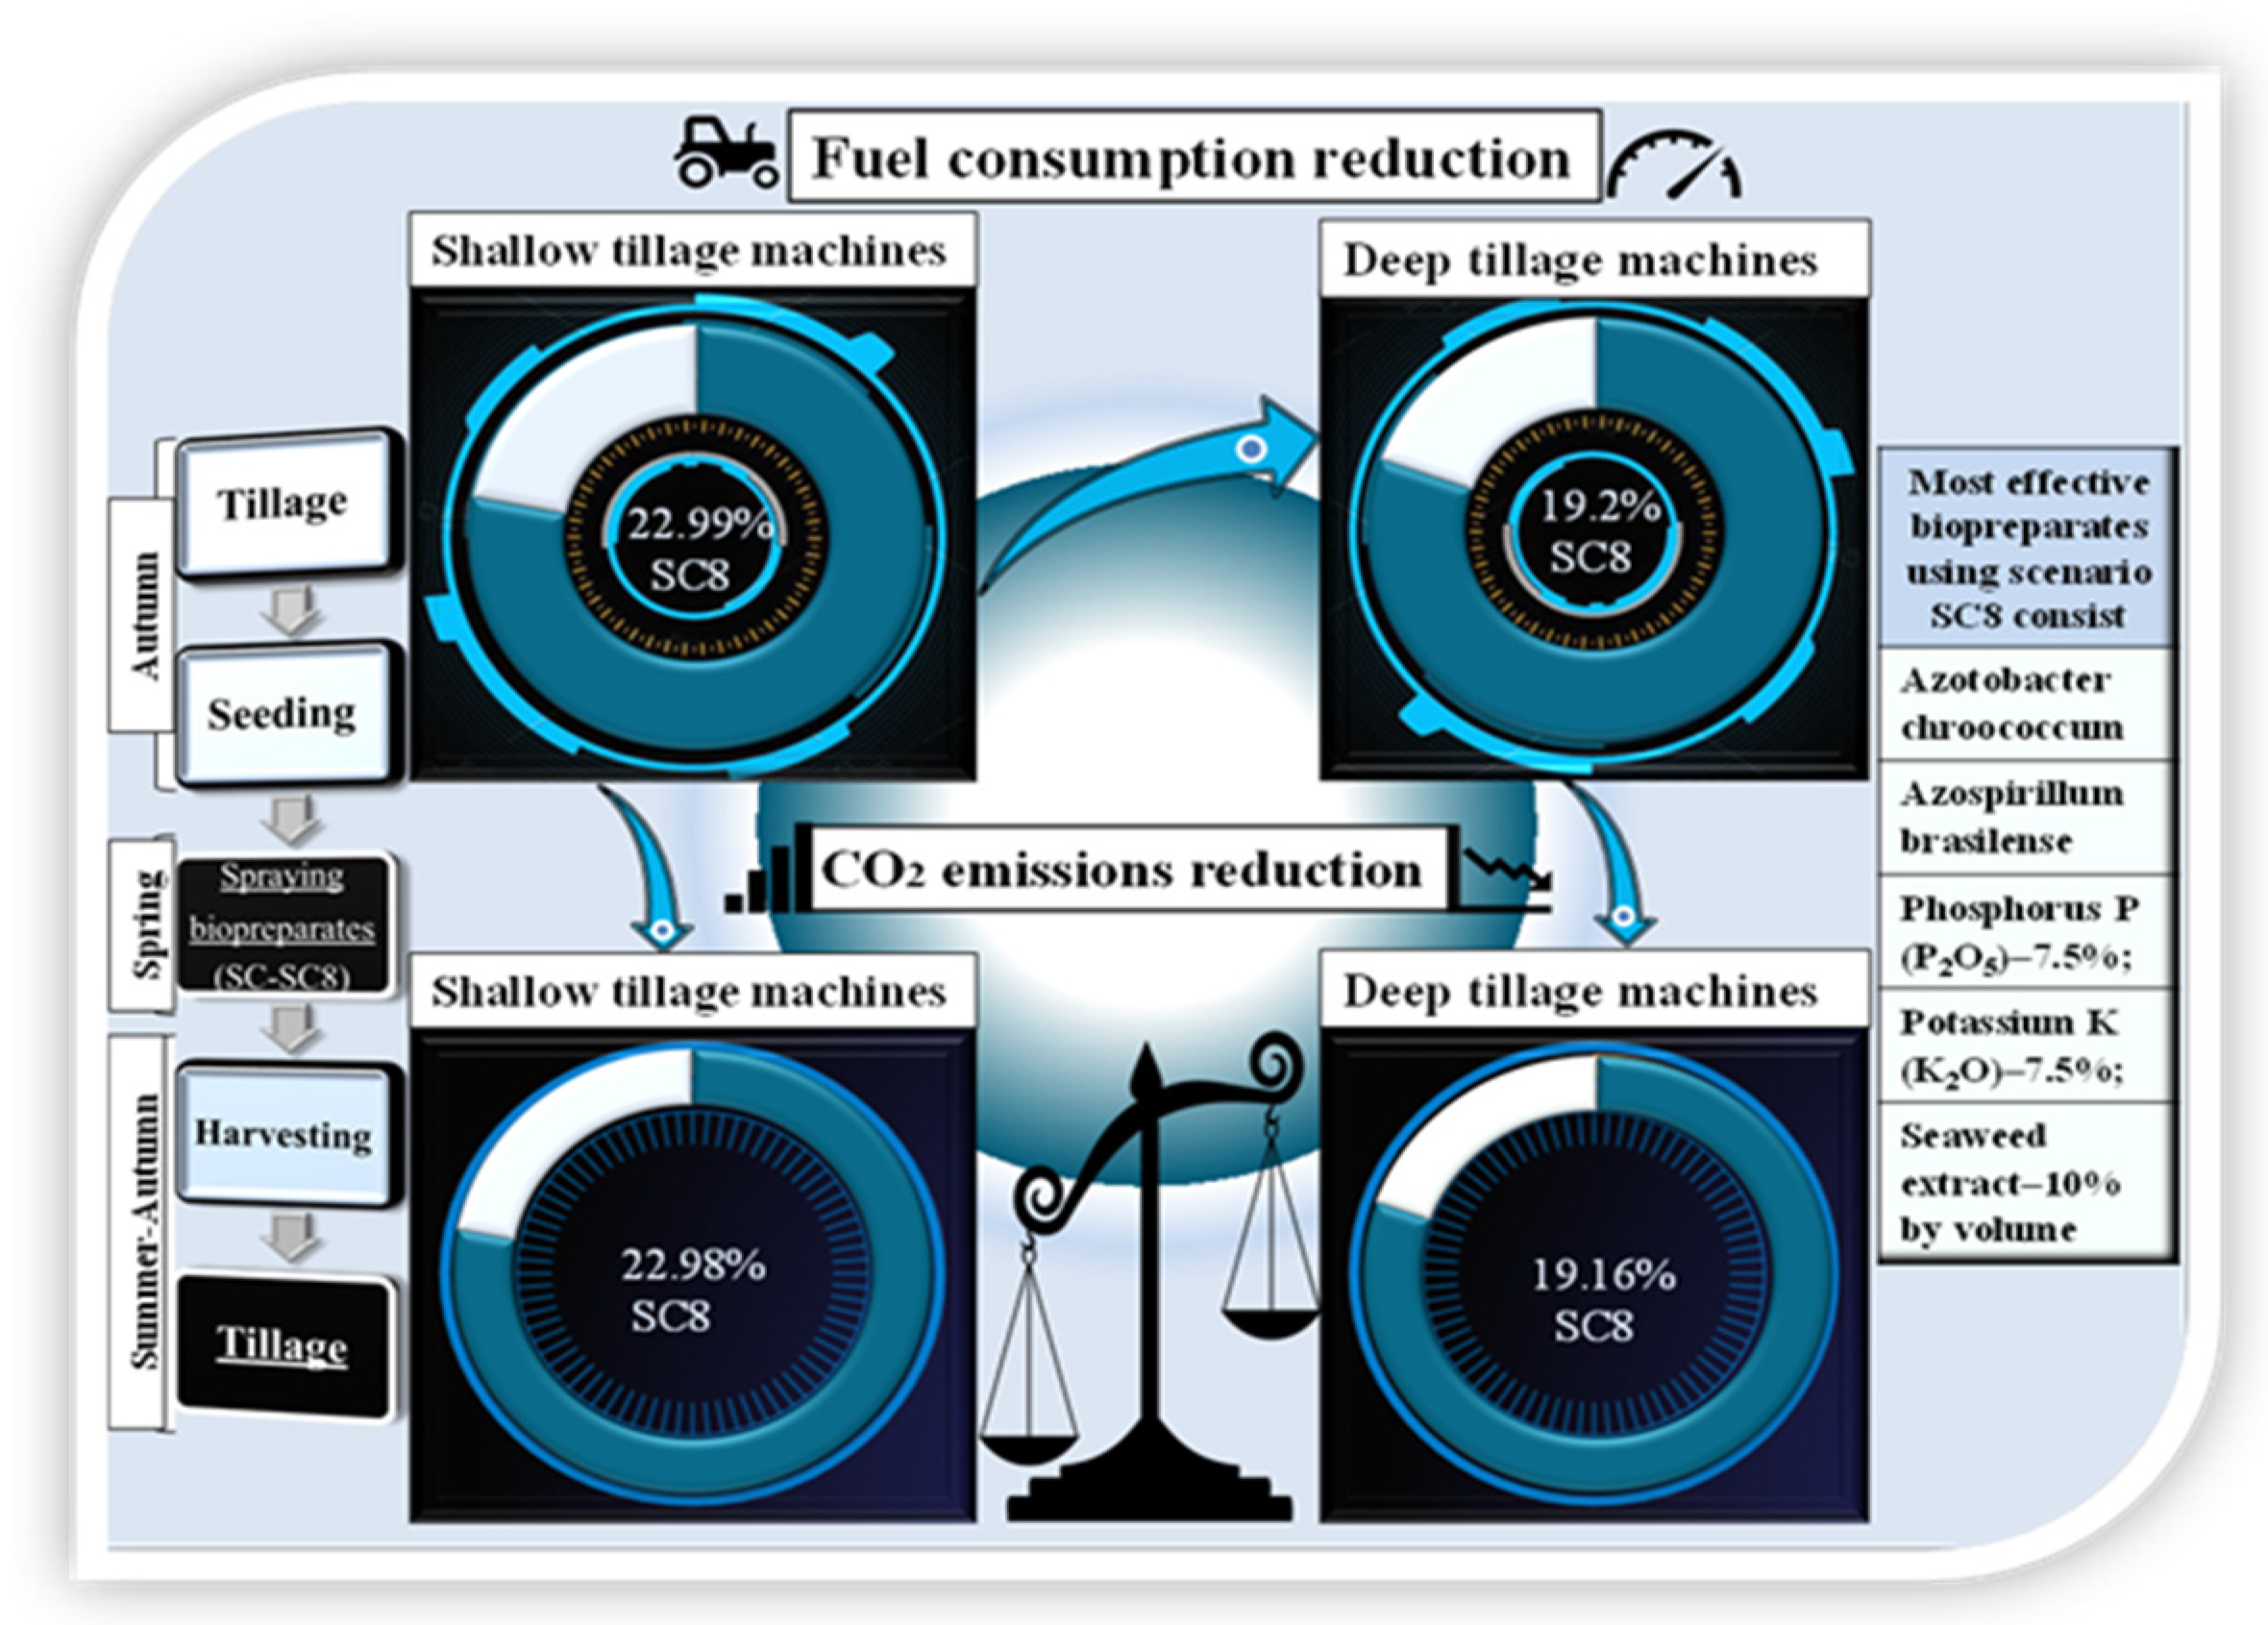
Various researchers are searching and testing different methods and measurements to reduce GHG emissions from agriculture. Some scientific studies have determined the effectiveness of using bio-measures in reducing GHG emissions (
Figure 4).
A CO
2 reduction of 19 to 23% was achieved by measuring plowing fuel consumption with gas analyzers, after the use of biological preparations in spring, when winter wheat vegetation is restored [
8].
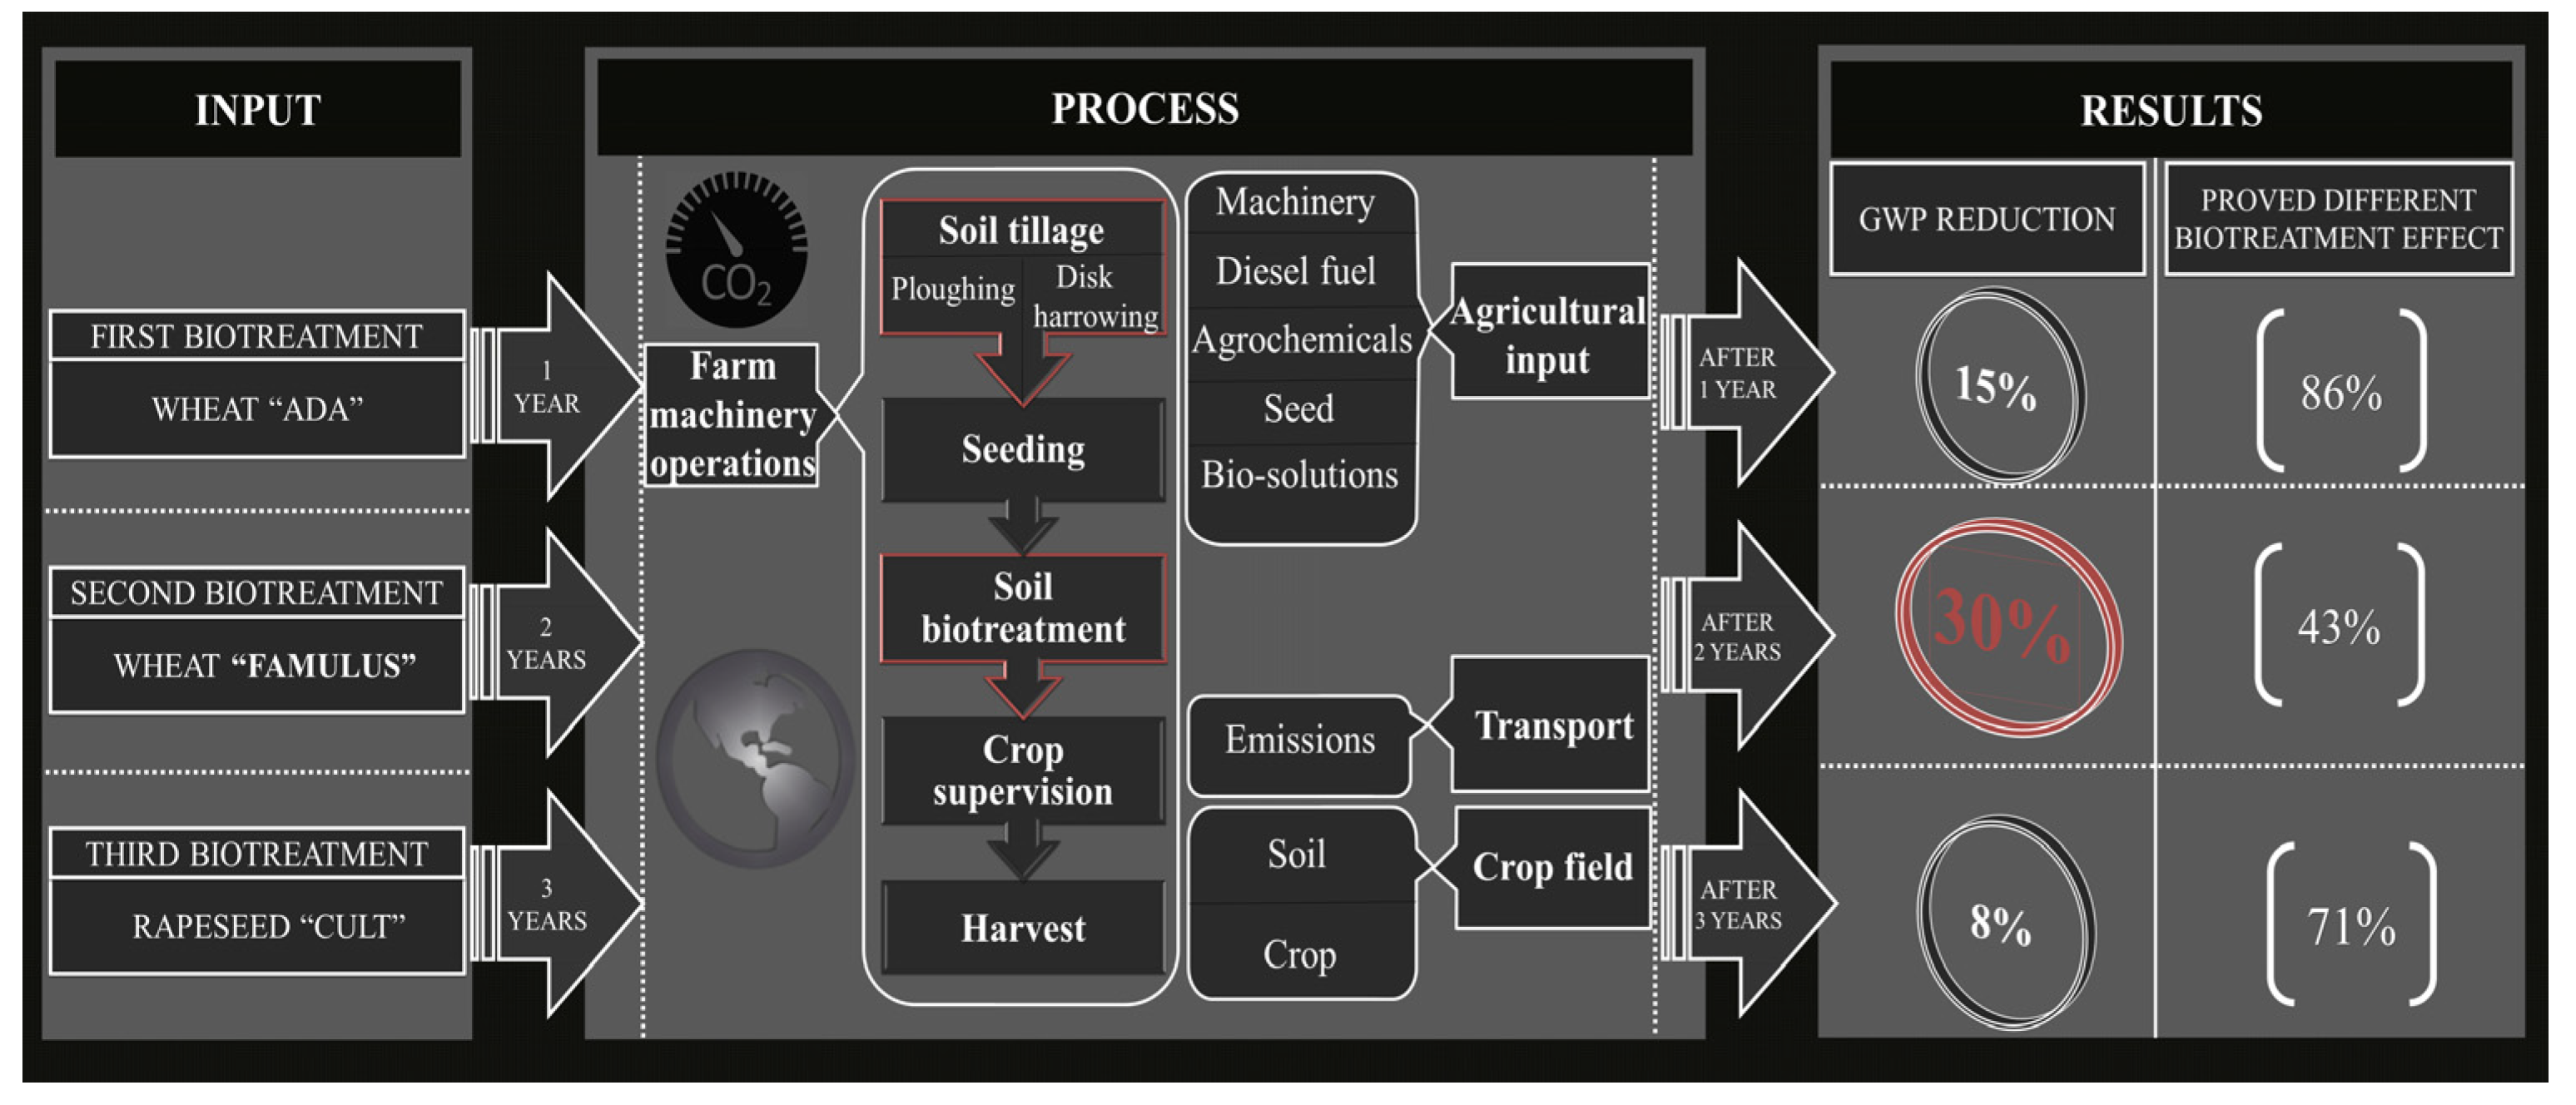
Efforts are also being made to find methods and tools to calculate GHG emissions, and one such method is life cycle analysis. The maximum effectiveness of biopreparations for CO
2 eq reduction during the LCA phase via fixed soil tillage was approximately 15% for the mixed biopreparation variant in first year, approximately 8% for the mixed biopreparation variant in the second year, and approximately 30% for the mixed biopreparation variant in the third year (
Figure 5) [
9]. Other researchers have also developed similar platforms for GHG calculation, but their basis was a questionnaire assessment, which is not always attractive and methodologically efficient; some examples of this methodology are the assessment of production-induced GHG pollution via survey [
10], as well as software-based assessment of the specific GHG emissions of olive farms [
11].
4. Conclusions
After analyzing all the factors that shape emissions at farm level and correctly reflecting sustainable farm actions that ensure the principles of circularity and sustainable resource use, the FarmGHG calculation tool will help determine the emission sources of technologies and tools applied on the farm, according to the IPCC methodology.
A methodically based GHG accounting system that records more accurate data collection on specific farms would enable the state to identify the problem areas to which support measures aimed at reducing GHG emissions could be directed more appropriately, to carry out monitoring, and to analyze the benefits provided by the support.
The FarmGHG assessment system is an effective tool for consultants providing consulting services, preparing farm sustainability plans, and monitoring the results of the implementation of measures. Additionally, more detailed farm-level data will allow farmers to make individual decisions related to reducing greenhouse gas emissions, optimizing their farms, and increasing productivity.
Author Contributions
Conceptualization, V.N. and R.B.; methodology, V.N.; software, D.S.; validation, V.N., R.B. and K.L.; formal analysis, K.L.; investigation, V.N. and D.S.; data curation, D.S. and V.N.; writing—original draft preparation, V.N.; writing—review and editing, K.L.; visualization, V.N. and D.S.; supervision, V.N. All authors have read and agreed to the published version of the manuscript.
Funding
This research received no external funding.
Institutional Review Board Statement
Not applicable.
Informed Consent Statement
Not applicable.
Data Availability Statement
Conflicts of Interest
The authors declare no conflict of interest.
References
- Rong, L.; Nielsen, P.V.; Zhang, G. Effects of airflow and liquid temperature on ammonia mass transfer above an emission surface: Experimental study on emission rate. Bioresour. Technol. 2009, 100, 4654–4661. [Google Scholar] [CrossRef] [PubMed]
- Rzeźnik, W.; Mielcarek, P. Greenhouse Gases and Ammonia Emission Factors from Livestock Buildings for Pigs and Dairy Cows. Pol. J. Environ. Stud. 2016, 25, 1813–1821. [Google Scholar] [CrossRef] [PubMed]
- Wu, W.; Zhang, G.; Kai, P. Ammonia and methane emissions from two naturally ventilated dairy cattle buildings and the influence of climatic factors on ammonia emissions. Atmos. Environ. 2012, 61, 232–243. [Google Scholar] [CrossRef]
- Zhang, G.; Strom, J.S.; Li, B.; Rom, H.B.; Morsing, S.; Dahl, P.; Wang, C. Emission of ammonia and other contaminant gases from naturally ventilated dairy cattle buildings. Biosyst. Eng. 2005, 92, 355–364. [Google Scholar] [CrossRef]
- Schils, R.L.; Olesen, J.E.; del Prado, A.; Soussana, J.F. A review of farm level modelling approaches for mitigating greenhouse gas emissions from ruminant livestock systems. Livest. Sci. 2007, 112, 240–251. [Google Scholar] [CrossRef]
- IPCC. Climate Change 2014: Mitigation of Climate Change—Contribution of Working Group III to the Fifth Assessment Report of the Intergovernmental Panel on Climate Change; Edenhofer, O.R., Pichs-Madruga, Y., Sokona, E., Farahani, S., Kadner, K., Seyboth, A., Adler, I., Baum, S., Brunner, P., Eickemeier, B., et al., Eds.; University Press: Cambridge, UK; New York, NY, USA, 2014. [Google Scholar]
- U.S. EPA. Inventory of U.S. Greenhouse Gas Emissions and Sinks: 1990–2016; U.S. EPA: Washington, DC, USA, 2018.
- Naujokienė, V.; Šarauskis, E.; Lekavičienė, K.; Adamavičienė, A.; Buragienė, S.; Kriaučiūnienė, Z. The influence of biopreparations on the reduction of energy consumption and CO2 emissions in shallow and deep soil tillage. Sci. Total Environ. 2018, 626, 1402–1413. [Google Scholar] [CrossRef] [PubMed]
- Naujokienė, V.; Šarauskis, E.; Bleizgys, R.; Sasnauskienė, J. Soil biotreatment effectiveness for reducing global warming potential from main polluting tillage operations in life cycle assessment phase. Sci. Total Environ. 2019, 671, 805–817. [Google Scholar] [CrossRef] [PubMed]
- Tongwane, M.; Mdlambuzi, T.; Moeletsi, M.; Tsubo, M.; Mliswa, V.; Grootboom, L. Greenhouse gas emissions from different crop production and management practices in South Africa. Environ. Dev. 2016, 19, 23–35. [Google Scholar] [CrossRef]
- Gkisakis, V.D.; Volakakis, N.; Kosmas, E.; Kabourakis, E.M. Developing a decision support tool for evaluating the environmental performance of olive production in terms of energy use and greenhouse gas emissions. Sustain. Prod. Consum. 2020, 24, 156–168. [Google Scholar] [CrossRef]
| Disclaimer/Publisher’s Note: The statements, opinions and data contained in all publications are solely those of the individual author(s) and contributor(s) and not of MDPI and/or the editor(s). MDPI and/or the editor(s) disclaim responsibility for any injury to people or property resulting from any ideas, methods, instructions or products referred to in the content. |
© 2023 by the authors. Licensee MDPI, Basel, Switzerland. This article is an open access article distributed under the terms and conditions of the Creative Commons Attribution (CC BY) license (https://creativecommons.org/licenses/by/4.0/).


