1. Introduction
For several decades, one of the challenges in the energy and climate context has been the use of renewable energy sources, with the aim of reducing dependence of fossil fuels. Among the technologies developed for this purpose, photovoltaic (PV) generators, capable of supplying electricity from incident irradiance, stand out. These generators are characterised by their ease of implementation and high scalability thanks to their modular panel structure, making them highly versatile for applications in any type of sector.
Regarding the operation of PV generators, the resulting electricity generation depends on several factors. Firstly, the components and technical specifications, as well as the materials from which the panels are made. On the other hand, external factors, such as dust accumulation [
1,
2], shading effect [
3] and temperature, affect the performance of the panels. The latter is a key factor in their operation, significantly decreasing their performance through increases in the operating temperature. The relevance of this parameter is justified by a review of the associated literature, where there are several papers focusing on the study of its associated effects, measurement and control.
The work of Hasan et al. [
4] presents a PV system with temperature control by water cooling, providing a comparative study of the performance and operating temperature achieved with and without cooling. In [
5], a PV panel temperature control system is proposed using a buried cooling system in a high ambient temperature environment. Bhavani et al. [
6] studies the effects produced by variations in irradiance and operating temperature on the power generation of an inverter connected to a grid. The relationship between the temperature of a single-crystalline single cell and its thermodynamic and electrical properties and efficiencies is discussed in [
7].
This article presents a system for the sensing, visualisation and analysis of the operating temperature of an array of PV panels using IoT software (Grafana). For this purpose, two data acquisition structures are used, one using digital sensors and the other one using analog sensors, to acquire the real-time values of the operating temperature of the panels in specific areas. This information is stored in a cloud-hosted database and visualised using Grafana. The experimental measurements are compared with simulated values from a model capable of determining the operating temperature from other related measurements, such as irradiance and ambient temperature.
The structure of the rest of the document is as follows.
Section 2 describes the set of devices and equipment that constitute the proposed installation, the interconnection between them and each of the functions developed. Additionally, the operation of Grafana and its implementation in the system are defined.
Section 3 shows the results obtained after the implementation of the system described. Finally, the main conclusions of the work are detailed.
2. Materials and Methods
This section describes the various pieces of equipment deployed, focusing on their layout, functionalities and communications. In addition, the operation of the IoT software used is explained.
2.1. Installation and Equipment
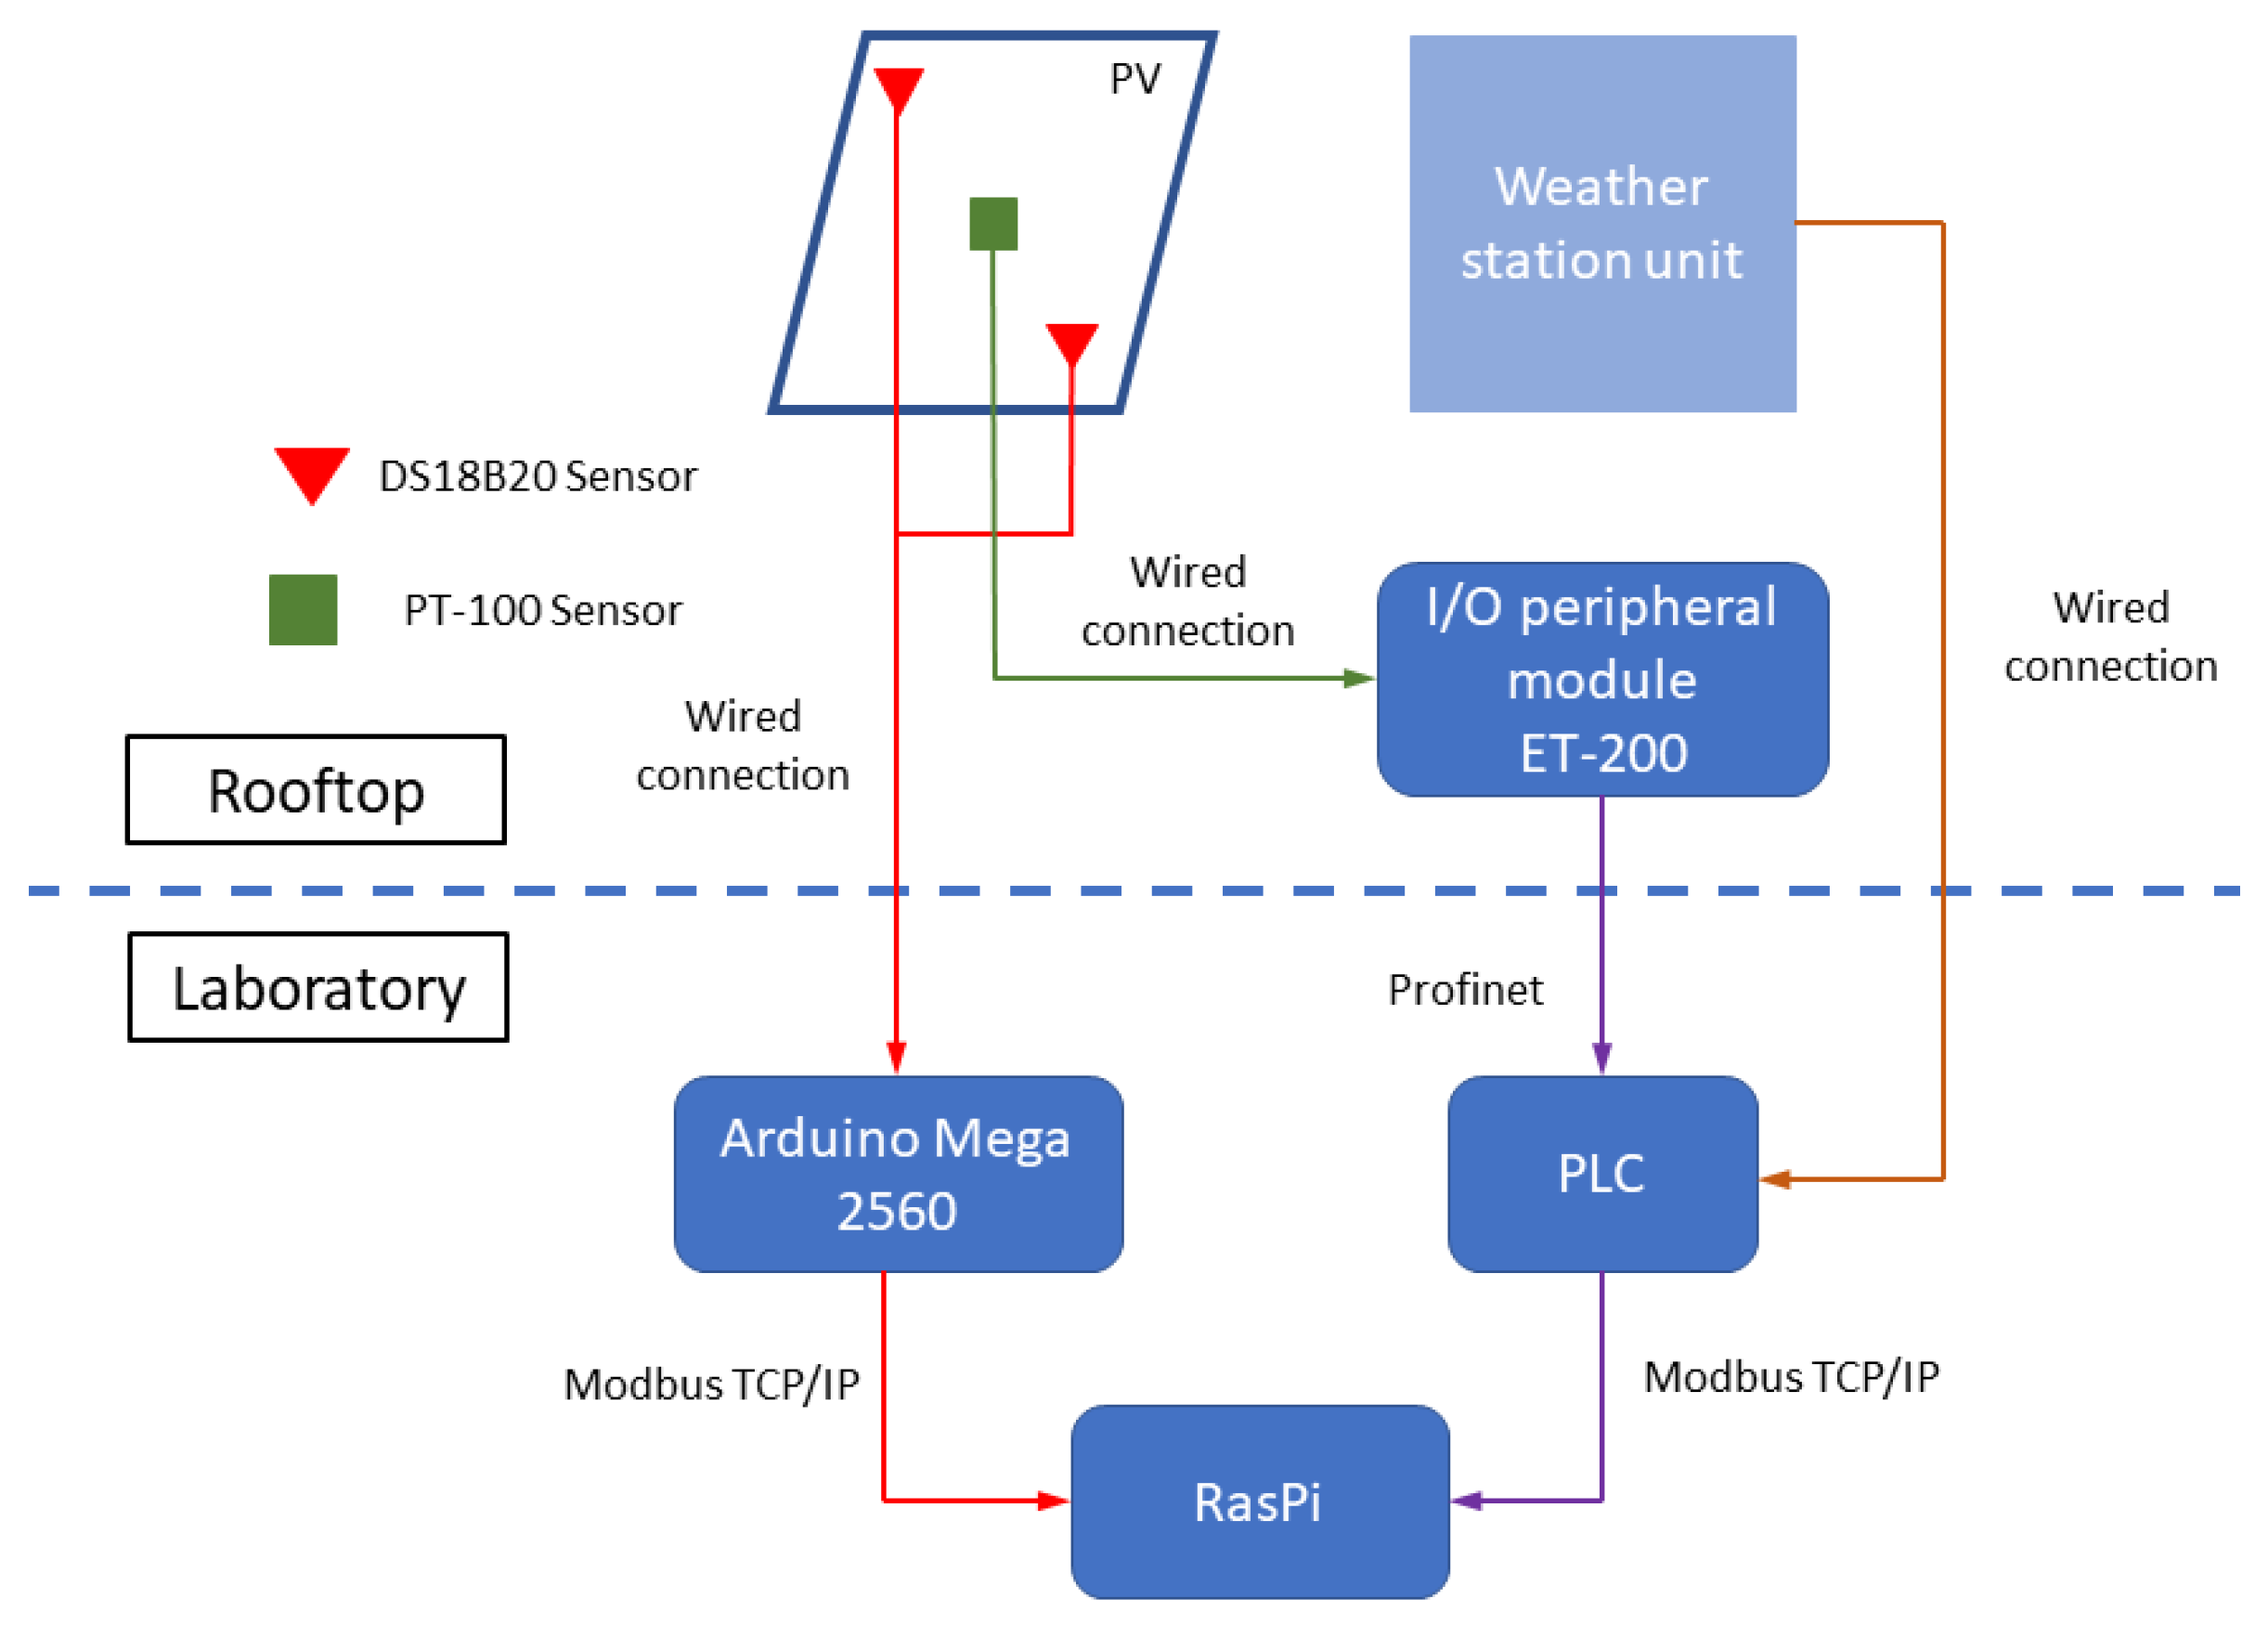
Due to the nature of the PV generators, a distributed equipment installation has been applied, where the panels under study and the sensors used for this purpose are located outdoors on a rooftop. On the other hand, the equipment dedicated to data acquisition, monitoring and supervision is located in a nearby laboratory.
On the rooftop there is an array of monocrystalline PV panels arranged in a single row. To measure their operating temperature, two DS18B20 digital temperature sensors and a PT-100 analogue temperature sensor are installed on the back of the panels. The duplicity of temperature sensors is justified in terms of their arrangement and subsequent data processing. The PT-100 sensor is located in the central part of the panel, taking a global measurement of the panel temperature, avoiding possible edge effects. The DS18B20 sensors are positioned at the ends of the panel, forming a diagonal with the analogue sensor. The data from the digital sensors are averaged and contrasted with the values from the analogue sensor to analyse the homogeneity of the temperature over the entire surface of the panel.
In order to gather readings on external factors relevant to the operation of the panels, a weather station unit is attached to the PV installation. This unit consists of a PT-100 ambient temperature sensor, an anemometer and an irradiance sensor oriented at the same inclination as the panels.
The laboratory houses the equipment dedicated to the acquisition and management of data from the sensors and equipment installed on the rooftop. For this purpose, a programmable logic controller (PLC) reads the temperatures taken by the analogue sensors through the use of a peripheral input/output module ET-200 located on the rooftop. Communication between the ET-200 module and the PLC is established via Profinet fieldbus. The data from the weather station unit is captured directly by the PLC through a wired connection. The digital sensors are managed by an Arduino Mega 2560 (Arduino LLC, New York, NY, USA), which reads each sensor through its unique identification code and transcribes the temperature information by means of a script. Finally, a Raspberry Pi (RasPi) (Raspberry Pi Fundation, Cambridge, UK) system stores all the system information in a database and runs the Grafana server. For this purpose, the RasPi maintains a connection with the Arduino and the PLC via Modbus TCP/IP protocol.
Figure 1 shows the equipment described above, indicating their physical location, as well as the connections and intercommunication between them.
2.2. Data Storage and Visualisation
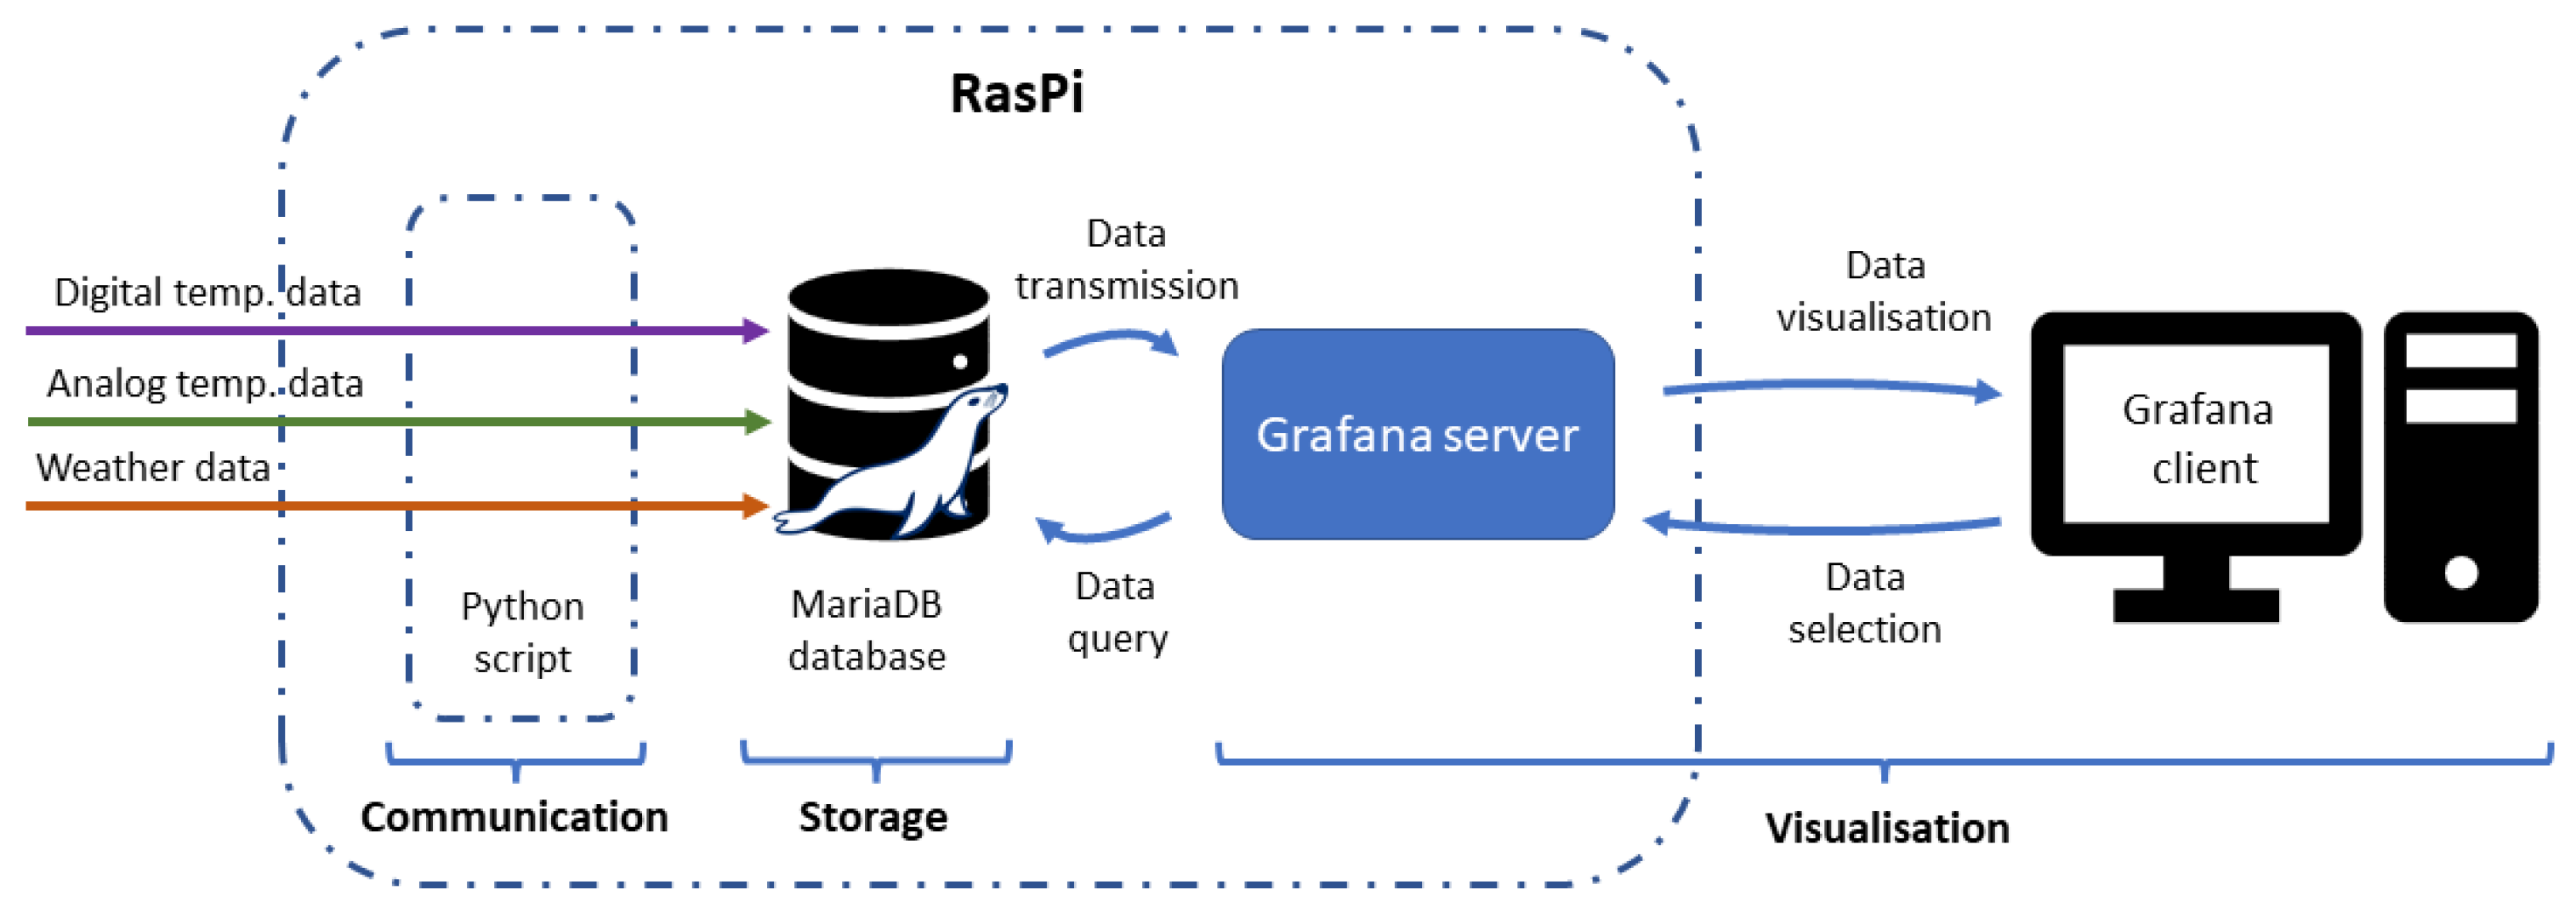
The RasPi is a low-cost and open-source device, characterised by its versatility due to its cross-platform connectivity and its considerable computational features. Therefore, the RasPi implemented in the system performs the function of data storage and visualisation.
The data storage is achieved through a Python script in charge of the Modbus communication and data reading from the Arduino and the PLC. After that, the data is stored in MariaDB.
For the display of the data, Grafana has been used, an IoT software dedicated to the monitoring and visualisation of stored data by means of graphical screens or dashboards configurable by the user [
8]. This software is distinguished by its low computational requirements and its client–server architecture, which combined translates into ease of access through any type of device within the server network. The operation of Grafana is based on database queries, where the user indicates the range of data to be displayed and the server manages the request with the database and displays the required information on the dashboard.
Figure 2 shows the functions carried out by the RasPi installed in the system, as well as the operation and functionalities of Grafana.
2.3. Model Simulation
Another functionality of Grafana is its ability to operate with the data from the databases, performing arithmetic operations, functions and equations. This feature is used together with the irradiance (
G) and ambient temperature (
Ta) data collected in the weather station unit to estimate the operating temperature of the panels by means of Equation (1). This model is described in [
9,
10] and uses the parameter known as nominal operating cell temperature (
NOCT), a value indicated by the manufacturer for nominal operating conditions (
T = 25 °C,
G = 800 W/m
2).
3. Implementation and Results
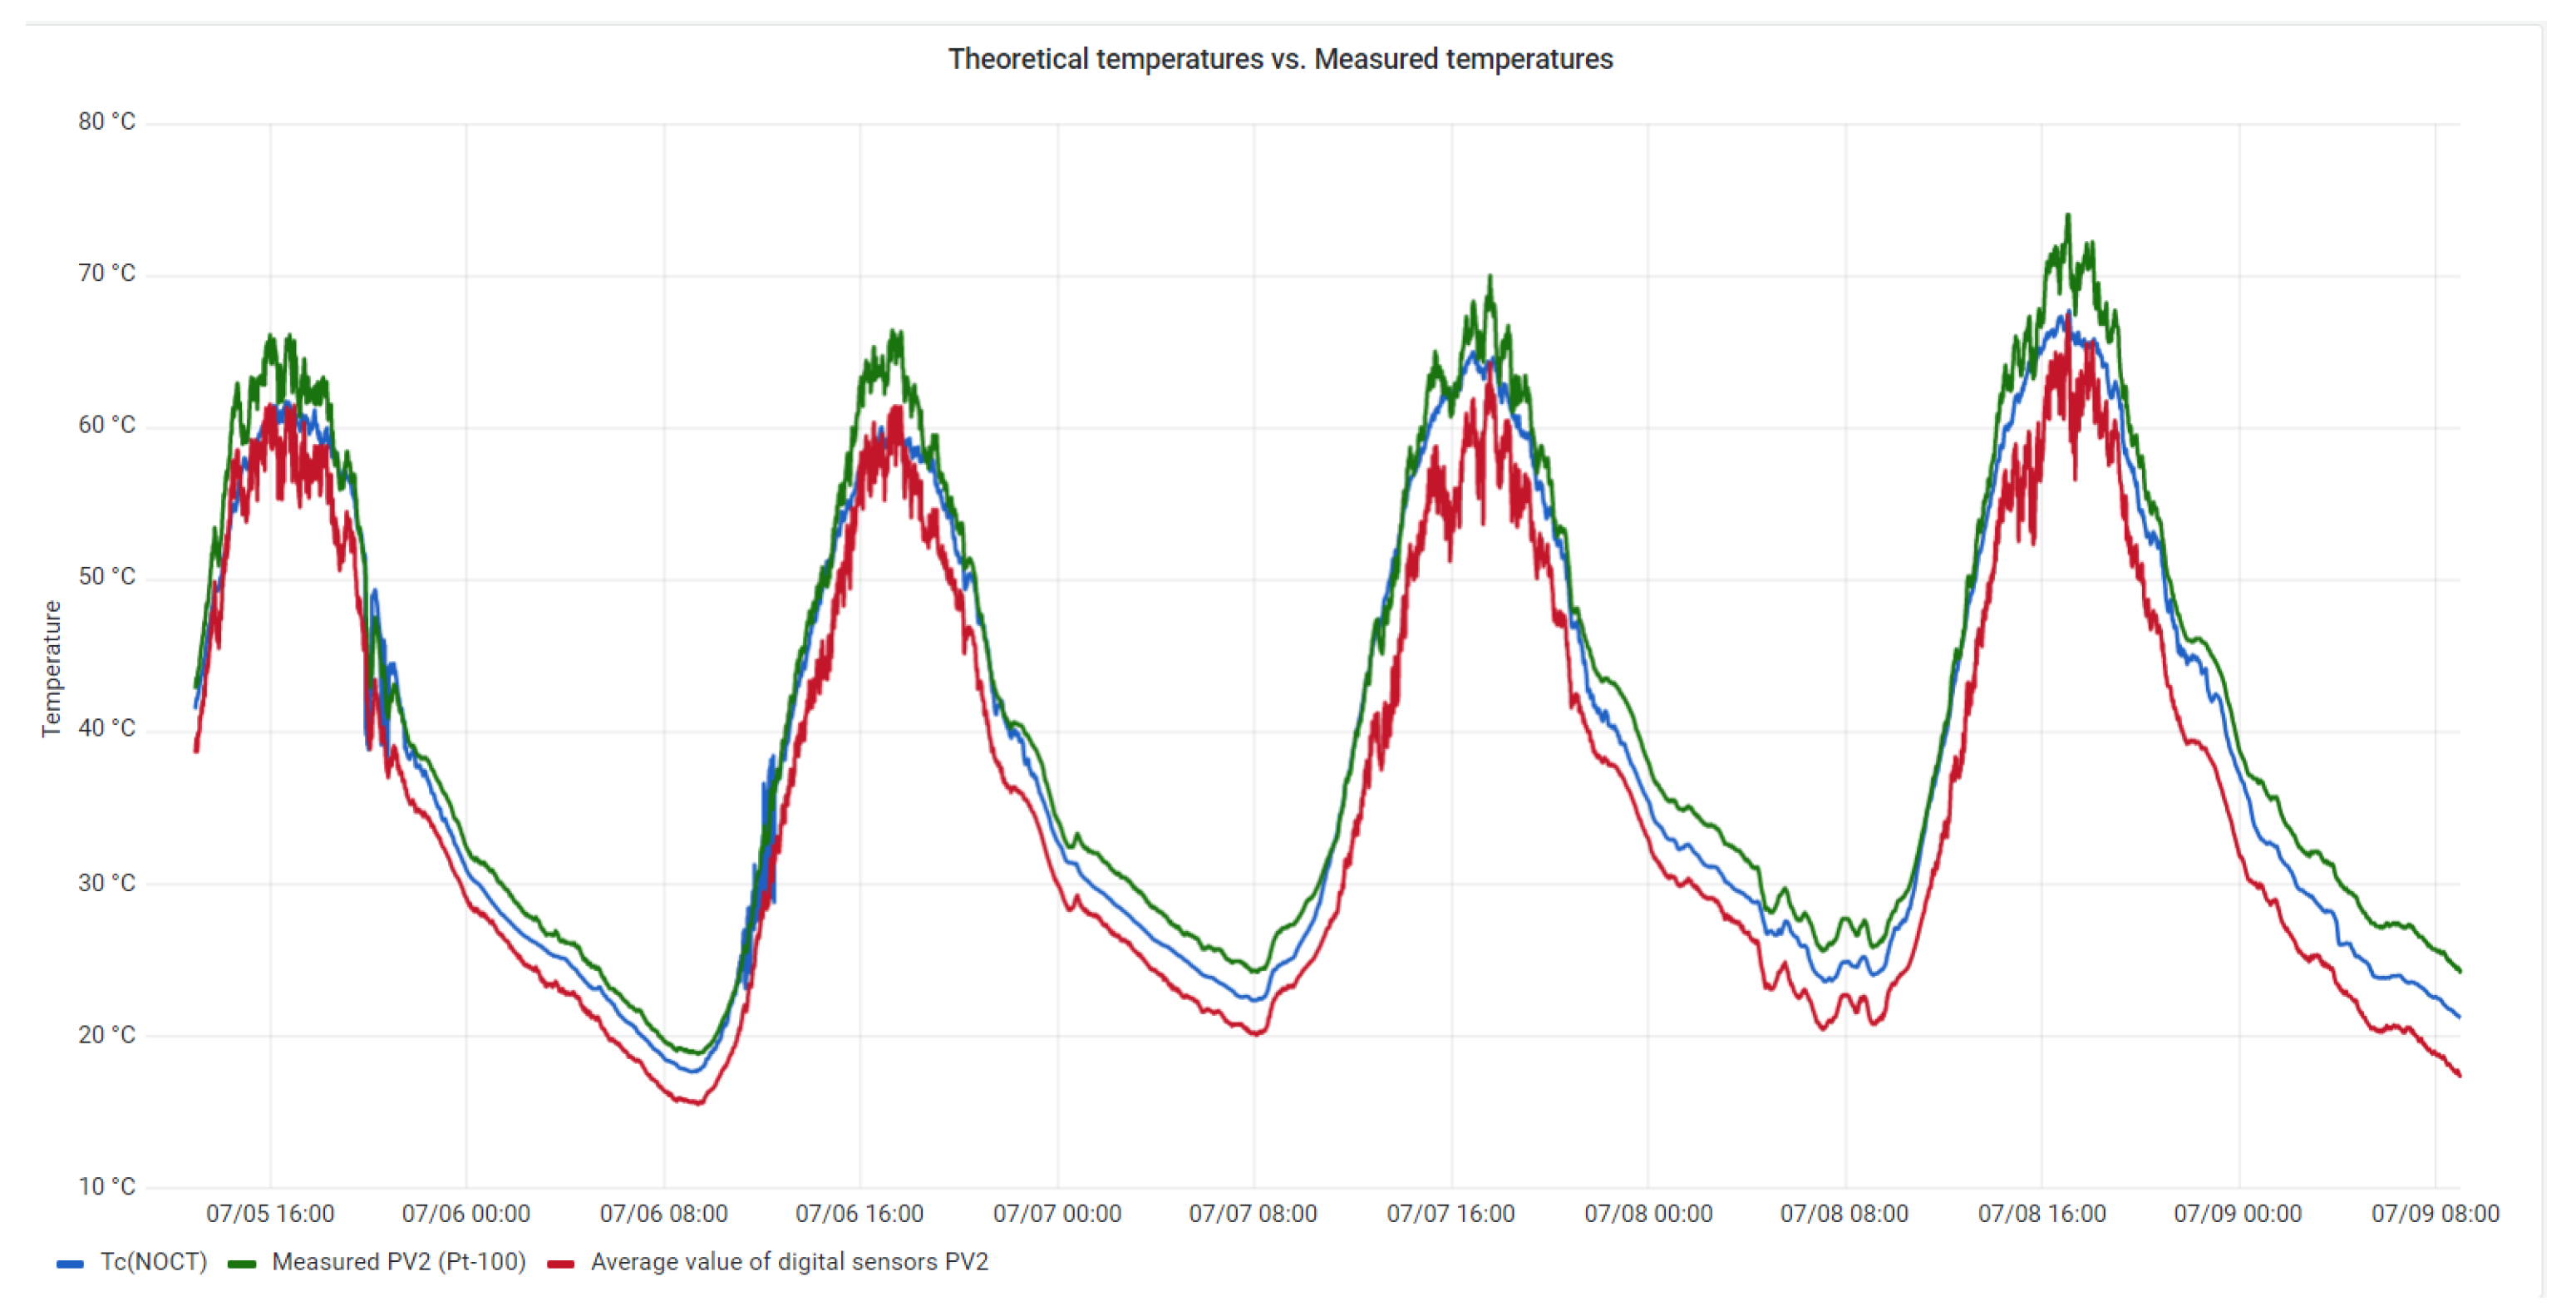
Regarding the visualisation of the data collected from the installation, a dashboard has been developed in Grafana for the representation of the operating temperatures of the panels. For each panel of the PV array, the temperature value of the analogue sensor, the average value of the two digital sensors and the value estimated by the model are shown simultaneously in a graph. As an example of this dashboard,
Figure 3 shows the graph of the second panel of the array for a time interval of five days.
As can be seen in the figure, the three curves show similar trends over time. Regarding the curves from the digital and analogue sensors, their shapes are parallel, with discrepancies in their instantaneous values due to the distribution of each sensor on the surface of the panel. On the other hand, the curve resulting from the model estimations presents intermediate values to those collected by the sensors, verifying the accuracy and reliability of the model for this application.
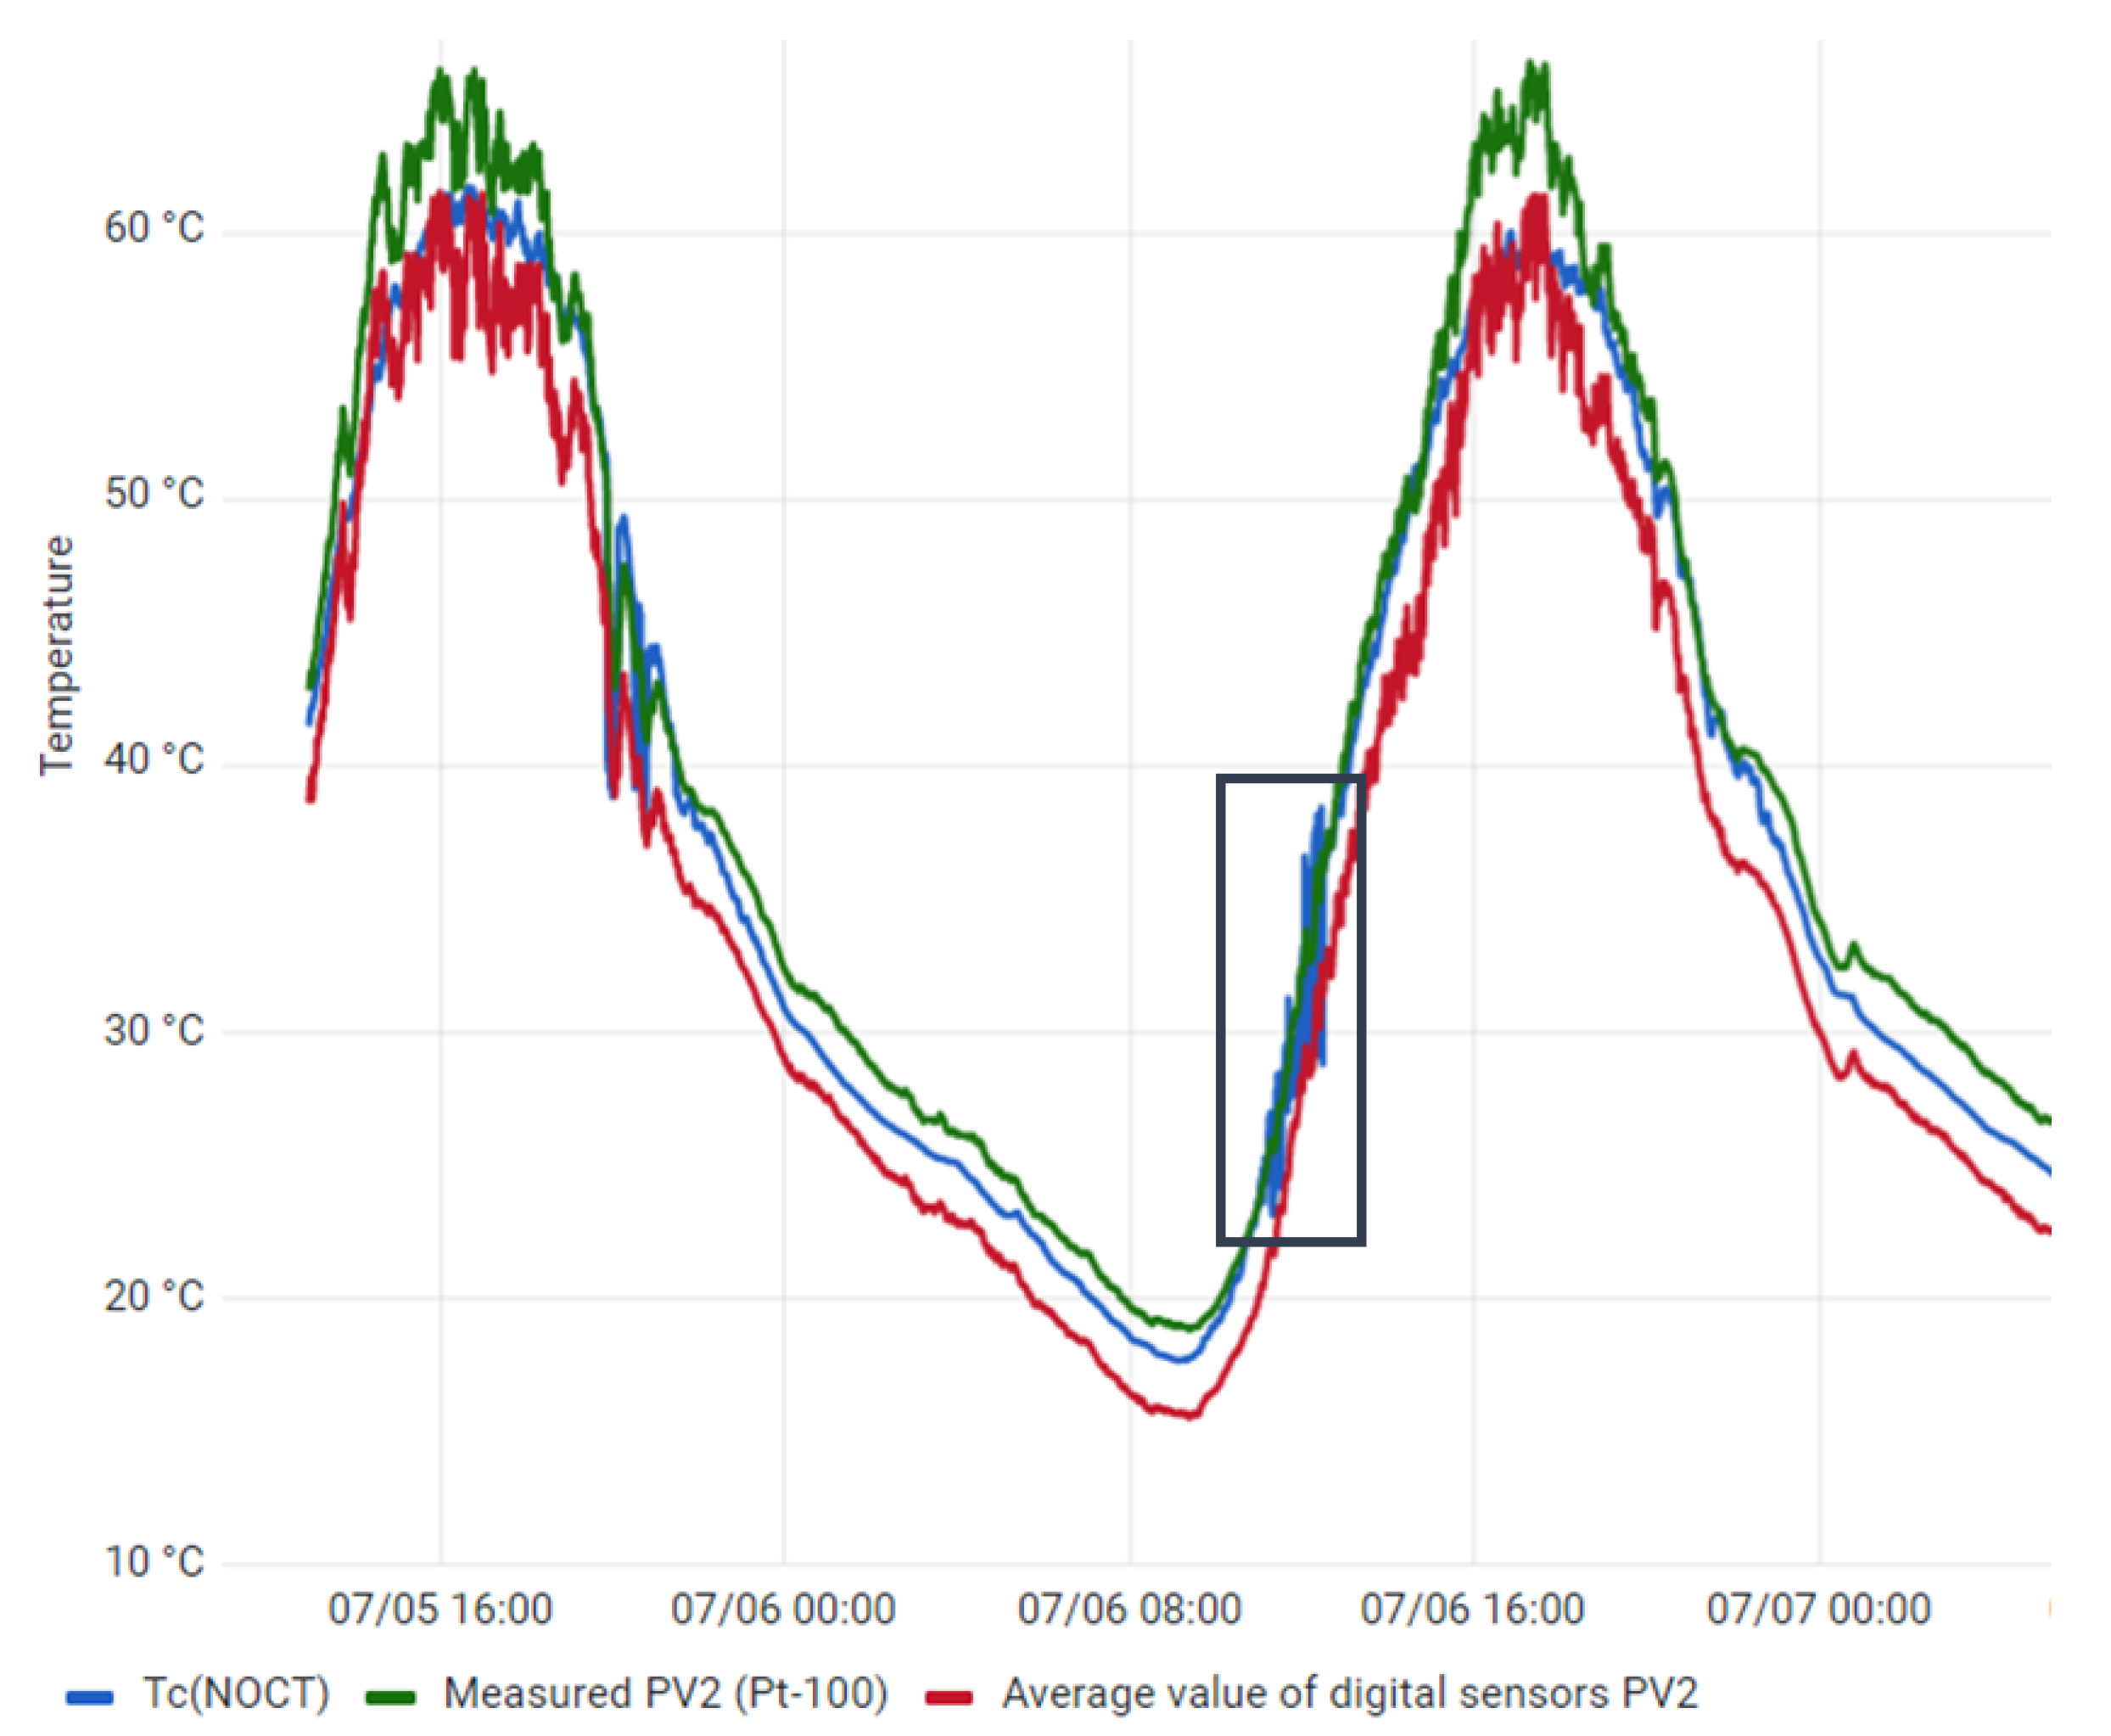
As described above, the model estimates the temperature of the panel in real time with the measurements taken by the weather station unit, without considering other internal parameters of the panel. This simplification of the operation of the panel results in an expression that fluctuates abruptly in situations where there is an instantaneous variation in irradiance, such as in the case of a shading effect due to clouds. These variations in the model are highlighted in
Figure 4.
As described in
Section 2, the temperature data represented in Grafana are obtained from three different structures. Observing the similarity between the data shown in
Figure 3 and
Figure 4, it is relevant to highlight the different advantages and disadvantages of the use of the different structures used in the described installation.
On the one hand, the PT-100 analogue sensors are low-cost and well-known devices, whose data acquisition through the ET-200 and the PLC results in an immediate reading of the temperature value. As a disadvantage, the connection with the ET-200 stands out, where two channels per sensor are required for data reading. This feature limits the number of connections in the device, as well as the acquisition of information from other sensors. The use of this peripheral module results in higher costs for additional sensor modules.
On the other hand, the DS18B20 digital sensors have a unique and individual identification system, which considerably reduces the number of digital inputs required for data reading. Another positive aspect is the use of a low-cost, open-source device, such as the Arduino Mega 2560, for data acquisition. The disadvantage of this structure lies in the need to process the signal received from the sensors to obtain the temperature reading using a script developed in Arduino IDE.
Finally, the estimations made by the model present an adequate precision in relation to the measurements obtained by the sensors. As a negative aspect, the simplicity of the model in certain situations, such as sudden variations in irradiance, is highlighted, ignoring the dynamics of operation and key internal parameters, such as its thermal coefficient or inertia.
4. Conclusions
This article presents a sensing, visualisation and analysis system of the operating temperature of a PV generator through the use of IoT software. The set of devices and equipment used in the sensing and data acquisition process has been described, highlighting the simultaneous use of PT-100 analogue sensors and DS18B20 digital sensors for temperature reading for the same panel. At the same time, data has been collected from a weather station unit that provides information on ambient temperature, irradiance and wind speed in order to estimate the operating temperature of the panel indirectly. The data acquisition is differentiated for each type of sensor, using an open-source device, such as the Arduino Mega 2560, for the DS18B20 and a commercial PLC for the PT-100 and the weather station unit. A RasPi is in charge of storing and visualising data through an internal database and running the Grafana server to provide the user with the dashboard where the temperature curves are represented. The comparison of these curves shows similar results, differing in aspects such as the arrangement of the sensors on the surface of the panel or the parameters involved in the simulated model.
As lines of future work, it is proposed to increase the number of sensors used as well as their arrangement on the back surface of the panel, comparing results to obtain a relationship between the number of sensors and accuracy in the overall operating temperature of the panel. At the same time, new models will be implemented in Grafana for temperature estimation, thus increasing the number of curves represented and enriching their comparative study.


