1. Introduction
Phenolic compounds, such as catechol, bisphenol A, etc., are very dangerous molecules that enter the environment in different ways and are produced in various processes: waste from paper manufacturing, agriculture (pesticides, insecticides, and herbicides), pharmaceuticals, and other processes [
1]. Chromatographic techniques are the most used methods for the determination of phenolic compounds, but they require expensive equipment, and specialized operators and do not allow for in situ measurements [
2].
There is, therefore, an interest in the development of simple, sensitive, specific, accurate sensing methods for the determination of phenolic compounds. In this frame, optical sensing methods are very promising.
Laccase (
Trametes Versicolor) is an enzyme belonging to the class of oxidoreductases and has very peculiar optical properties due to the presence of copper atoms in the catalytic centre [
2]. They are characterized by low substrate specificity, a characteristic that makes them a key element of numerous biotechnological applications.
The catalytic property of the enzyme consists of the oxidation of phenolic substrates, transforming them into less carcinogenic and mutagenic compounds, the corresponding quinones. Simultaneously, with oxidation, the reduction of O
2 to water takes place. Laccase enzyme has been used for developing a certain number of optical biosensors [
1,
3], but further investigation on laccase optical properties can offer new approaches for developing innovative sensing schemes.
As a first step to further evaluate the potential of using the peculiar properties of laccase in realizing biosensors for catechol monitoring, in this work we report on an experimental study of this enzyme’s optical absorption and fluorescence properties in the absence and presence of pollutants of environmental interest.
2. Materials and Methods
All chemicals and commercial laccase were purchased from Sigma (Sigma Italia, Milan, Italy). Solutions of free laccase at a concentration of 8 μg/mL were obtained using 0.1 M acetate buffer at pH 5.0. The catechol was dissolved in the same buffer at a concentration equal to 0.4 mM.
The absorption spectra were acquired in the 200–900 nm range using a JASCO 630 V spectrophotometer, equipped with a UV Winlab software package. The scan speed was set at 200 nm/min, while the slit was at 5 nm.
Fluorescence emission spectra were acquired in the 350–500 nm range by a PerkinElmer LS55 spectrofluorometer with an excitation wavelength of 320 nm. The slits were set at 5 nm, while the scan speed was at 200 nm/min.
Data analysis was performed with the Origin Pro 7.5 software (OriginLab, Northampton, MA, USA).
3. Results and Discussion
The absorption spectrum of the enzyme laccase Trametes Versicolor in the UV-visible region (
Figure 1) shows a peak at 310 nm along with weak features at 330 nm and around 650 nm.
According to the literature [
3,
4], the peak at 310 nm can be attributed to the absorption of tryptophan, the weak structure at 330 nm relating to the absorption of pairs of copper atoms of type T3 and relating to the structure at 630 nm with regards to the T1-type copper atom.
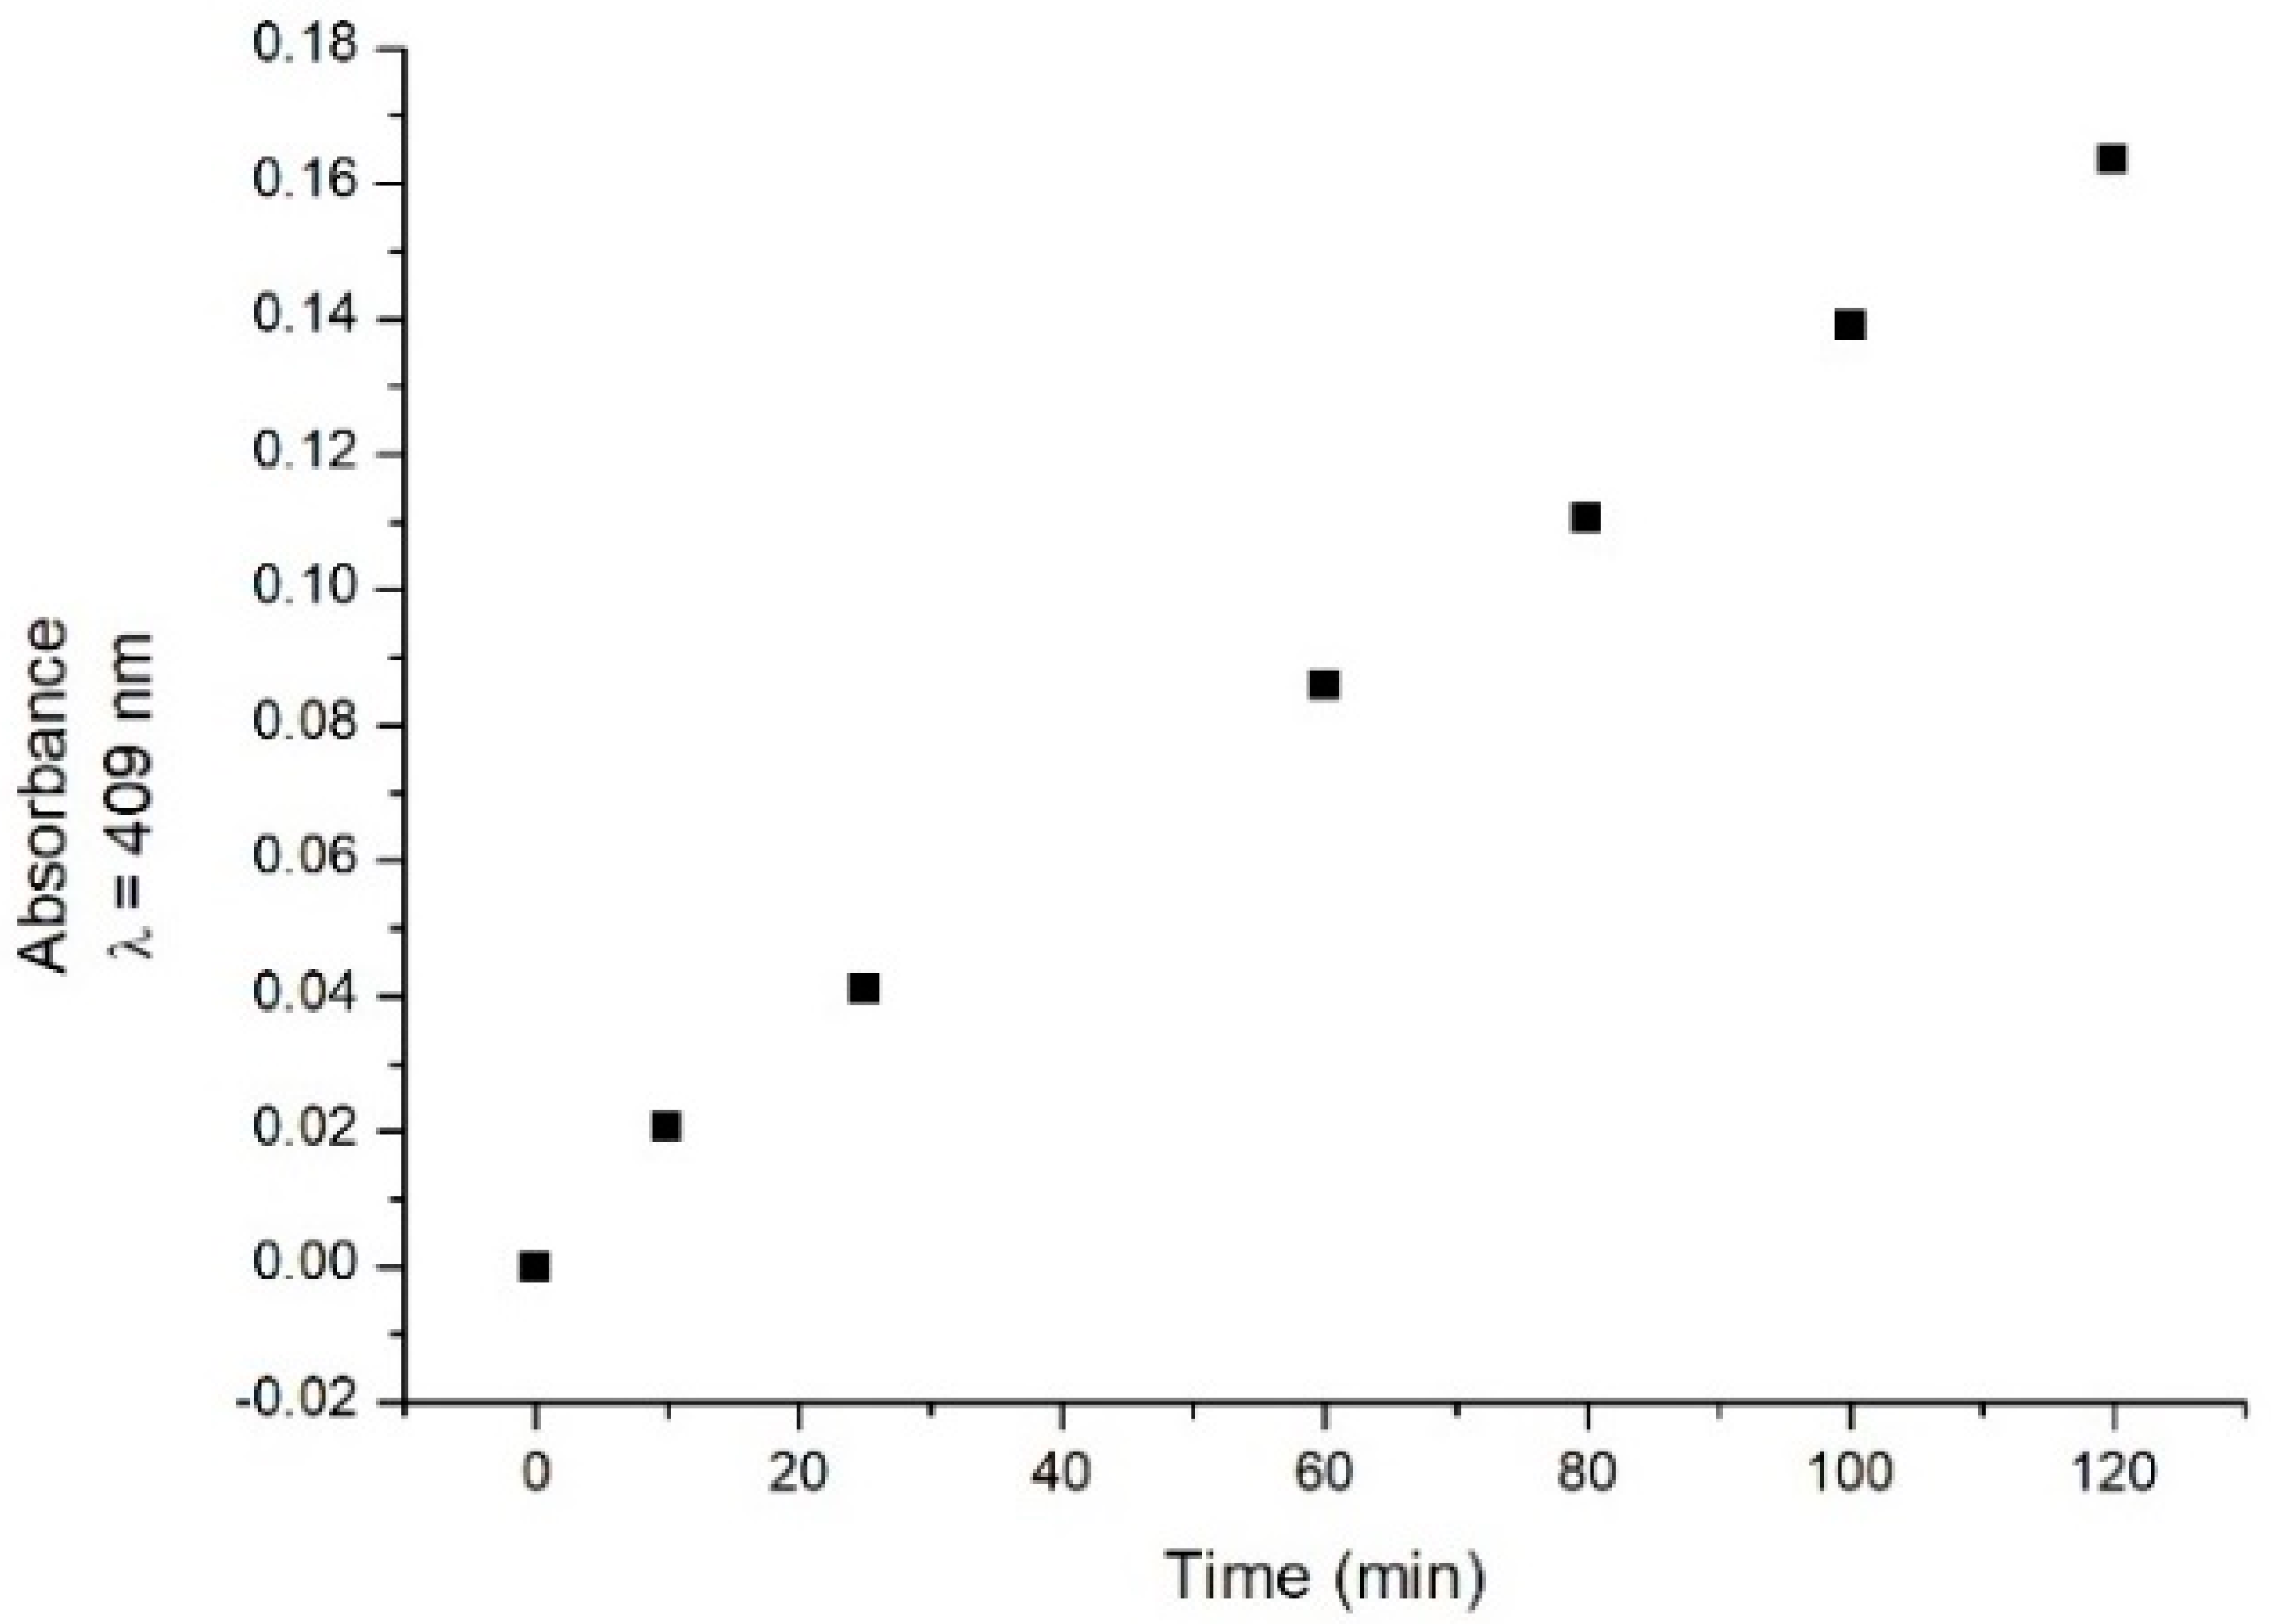
The absorption spectrum of the laccase samples was then recorded in the presence of catechol at a fixed concentration (0.4 mM) at different times (t0 = 0 min, 10 min, 25 min, 1 h, 80 min, 100 min, and 2 h after catechol addition). Changes in the absorption spectrum are observed during the time. An increased absorbance is observed in the 300–500 nm range (data not shown). As representative behaviour, the absorbance values detected at 409 nm (where a signal possibly related to a reaction intermediate could be present) extracted from the recorded spectra are shown in
Figure 2 as a function of incubation time. The data show that the absorbance increases with time in the considered time interval.
Such modifications could be used to monitor the presence of catechol [
5], since they are thought to be related to the laccase–catechol interaction [
6].
After measuring the emission spectrum of laccase, we investigated whether the presence of catechol in the solution also produces changes in the fluorescence signal. The fluorescence emission after several incubation periods was detected (
Figure 3).
An increase in the fluorescence emission intensity is observed in the range of 330–420 nm, the most significant effect being detected after 50 min. As an example, we show in
Figure 4 the time course behaviour of fluorescence emission intensity at a specific wavelength (360 nm). After 50 min, the fluorescence intensity reaches its saturation level.
4. Conclusions
The results confirm that the use of absorption and fluorescence properties of laccase is promising to build new optical detection methods for the determination of phenol compounds of ecological interest.
Author Contributions
Conceptualization, M.L. and I.D.; investigation, P.C., F.M., and M.P.; writing—review and editing, P.C., M.L., and I.D. All authors have read and agreed to the published version of the manuscript.
Funding
This research received no external funding.
Institutional Review Board Statement
Not applicable.
Informed Consent Statement
Not applicable.
Data Availability Statement
The data presented in this study are available upon request from the corresponding author.
Conflicts of Interest
The authors declare no conflict of interest.
References
- Delfino, I.; Diano, N.; Lepore, M. Advanced Optical Sensing of Phenolic Compounds for Environmental Applications. Sensors 2021, 21, 7563. [Google Scholar] [CrossRef] [PubMed]
- Riva, S. Laccases: Blue enzymes for green chemistry. Trends Biotechnol. 2006, 24, 219–226. [Google Scholar] [CrossRef] [PubMed]
- Lepore, M.; Portaccio, M. Optical detection of different phenolic compounds by means of a novel biosensor based on sol-gel immobilized laccase. Biotechnol. Appl. Biochem. 2017, 64, 782–792. [Google Scholar] [CrossRef]
- Delfino, I.; Viola, D.; Cerullo, G.; Lepore, M. Ultrafast excited-state charge-transfer dynamics in laccase type I copper site. Biophys. Chem. 2015, 200–201, 41–47. [Google Scholar] [CrossRef][Green Version]
- Dencheva, N.; Oliveira, S.; Braz, G.; Getya, D.; Malfois, M.; Denchev, Z.; Gitsov, I. Magnetically Responsive PA6 Microparticles with Immobilized Laccase Show High Catalytic Efficiency in the Enzymatic Treatment of Catechol. Catalysts 2021, 11, 239. [Google Scholar] [CrossRef]
- Sun, X.; Bai, R.; Zhang, Y.; Wang, Q.; Fan, X.; Yuan, J.; Cui, L.; Wang, P. Laccase-Catalyzed Oxidative Polymerization of Phenolic Compounds. Appl. Biochem. Biotechnol. 2013, 171, 1673–1680. [Google Scholar] [CrossRef] [PubMed]
| Publisher’s Note: MDPI stays neutral with regard to jurisdictional claims in published maps and institutional affiliations. |
© 2022 by the authors. Licensee MDPI, Basel, Switzerland. This article is an open access article distributed under the terms and conditions of the Creative Commons Attribution (CC BY) license (https://creativecommons.org/licenses/by/4.0/).


 ,
, 


