Proceeding Paper

Modelling and FEM Simulation of Love Wave SAW-Based Dichloromethane Gas Sensor †

Nanomaterials & Devices Research Laboratory, School of Materials Science and Engineering, National Institute of Technology, Calicut 673601, Kerala, India
*
Author to whom correspondence should be addressed.
Presented at the 9th International Electronic Conference on Sensors and Applications, 1–15 November 2022; Available online: https://ecsa-9.sciforum.net/.
Eng. Proc. 2022, 27(1), 27; https://doi.org/10.3390/ecsa-9-13267
Published: 1 November 2022

Abstract

:
In this paper, surface acoustic wave (SAW) technology based on love waves was designed in three dimensions for finite element modelling (FEM) and analysis in order to detect volatile organic compounds (VOC). A thin layer of polyisobutylene (PIB), which acted as the sensing layer, was placed on top of the guiding layer of SiO2 and interdigitated electrodes (IDE), which were modelled on a piezoelectric substrate. The substrate selected was 64° YZ-cut Lithium niobate (LiNbO3) for love wave generation, and the lightweight electrodes were made of Aluminium (Al). Analytical simulations were conducted using COMSOL Multiphysics 6.0 software.

1. Introduction

Dichloromethane (DCM), or methyl chloride, is a volatile organic compound (VOC) infamous for its carcinogenic properties. The gas, which is mainly used in industrial solvents, is found to cause lung and liver cancers in animal experiments, whereas it is proven to cause cancers of the brain, liver, and a few types of blood cancers, including Non-Hodgkin’s lymphoma in humans [1]. Among the various techniques available today for the detection of gases in atmospheric air, SAW (surface acoustic wave) sensors are highly accurate. SAW offers higher sensitivity, simplicity of fabrication, rapid response time, room temperature operation, and the possibility of wireless operation at low costs [2]. The sensor consists of an input inter digitated electrodes (IDE) that transforms electrical signal to waves of surface acoustic wave nature and an IDE device at the output that converts the waves back to electrical output signals, both are lithographically etched on a piezo electric substrate. These IDEs are made of Aluminium (Al). The schematic diagram is shown in Figure 1.

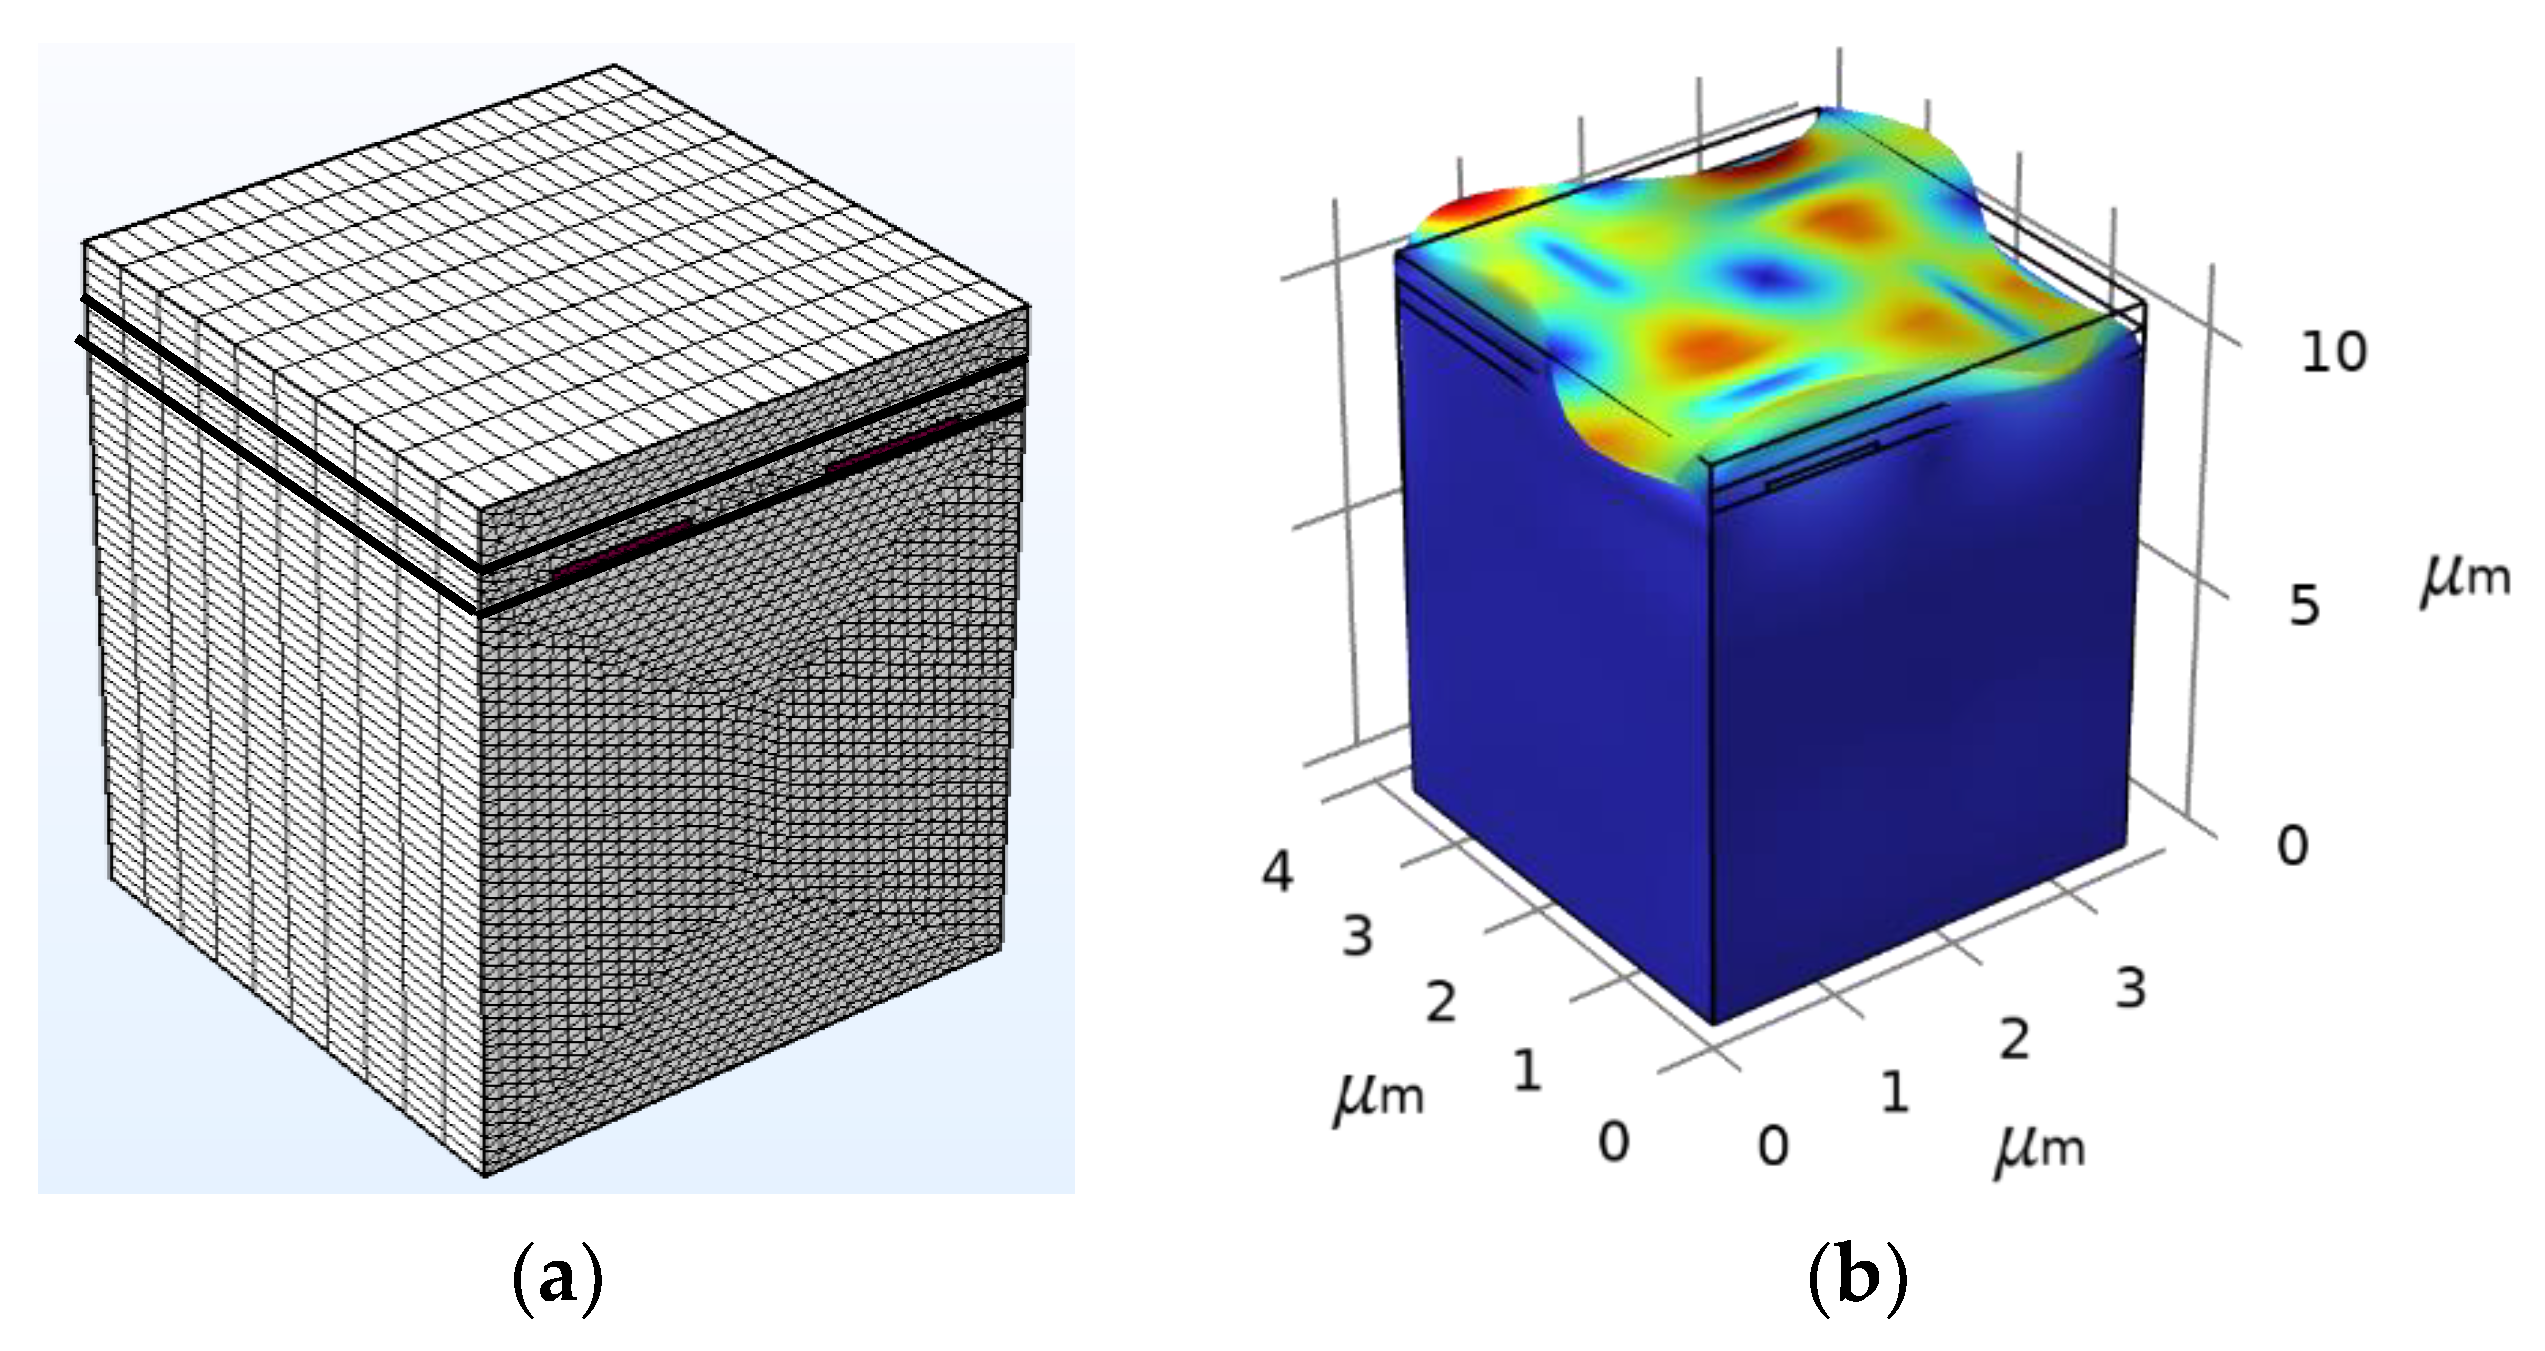
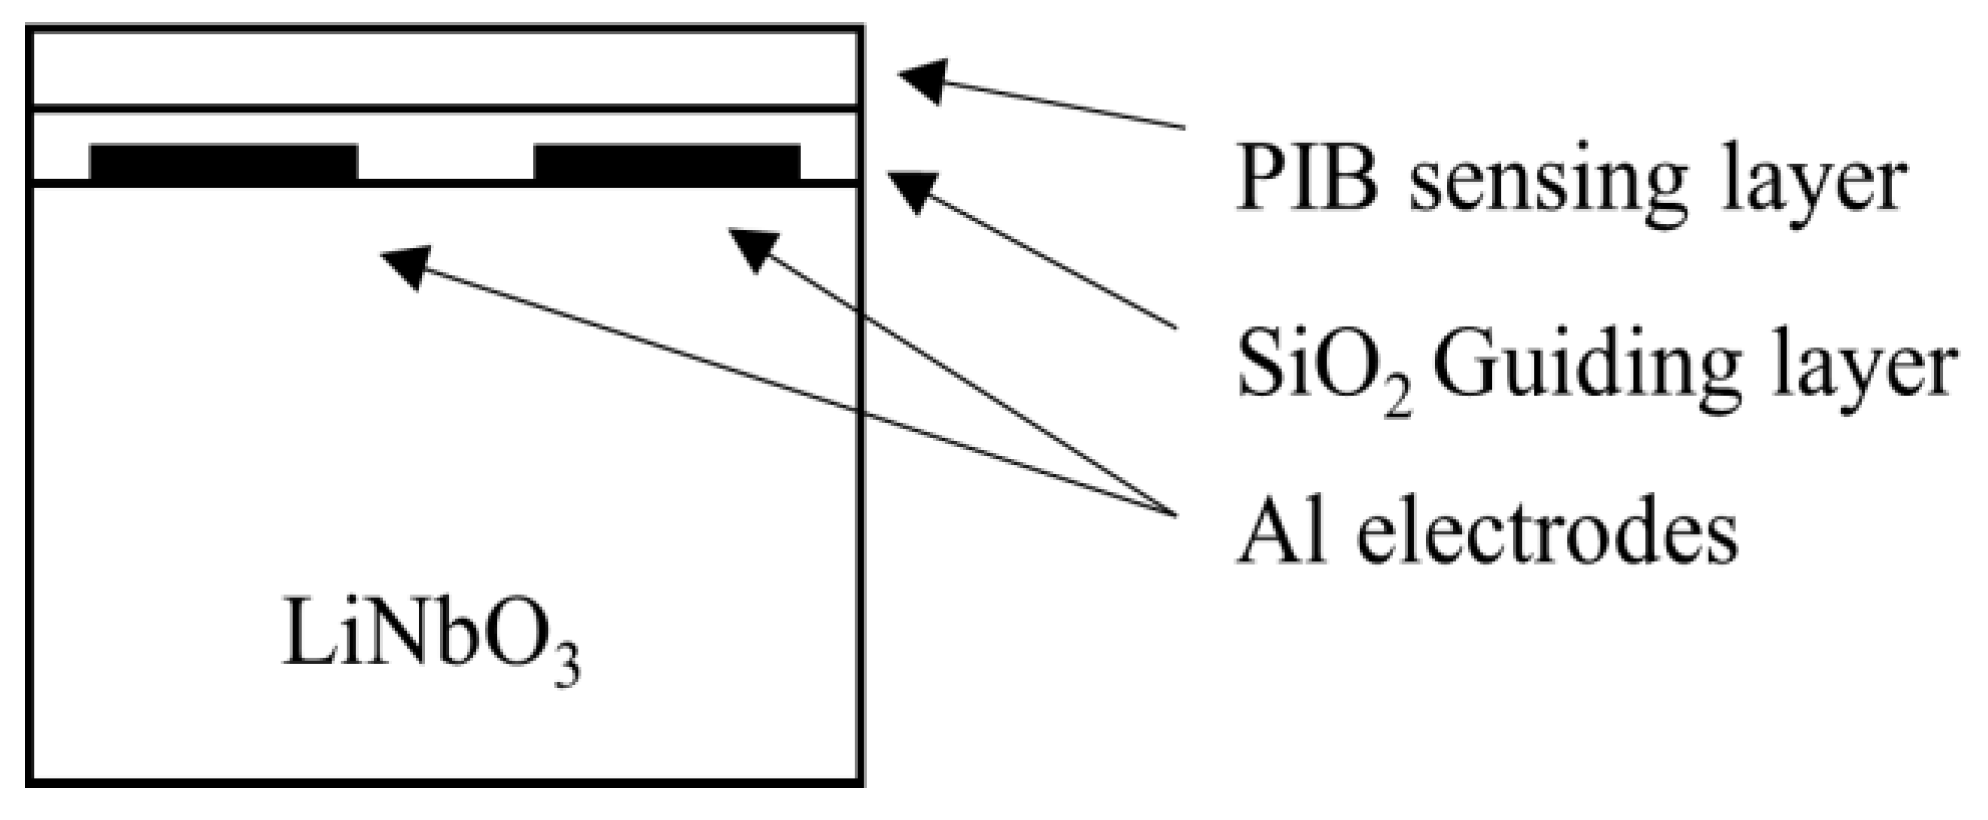
2. Design Methodology

The interface of two solid elastic substrate layers, one of which is quite thick and the other of which is a thin layer on top of the thick layer, is where the love waves are produced. When love waves are generated, very high acoustic energies are centred in the thin guiding layer [3].
The wavelength of designed frequency λ can be calculated by following equation:
λ = v R / f 0
where v R is acoustic velocity in Lithium niobate substrate and f 0 is the designed SAW center frequency. The total concentration of gas, c , in air is calculated by:
c = c 0 P / R T
where c is in moles/m3 and c 0 , P ,   R , and T are concentration in parts per million (ppm), atmospheric pressure, gas constant and temperature, respectively.
ρ g a s / P I B = K M _ D C M
K is the gas’ air/PIB partition coefficient, and M is the molar mass of DCM. Equation (2) represents the density of gas absorbed by the PIB film.
ρ t o t a l = ρ P I B + ρ g a s / P I B
Equation (3) provides the total density of PIB film, which is equal to the addition of the density of PIB film and is the partial density of gas in air [4,5,6].
The parameters for the DCM gas are shown Table 1.
The equivalent circuit, as shown in Figure 2, contains two loss resistors and a storing element of capacitor and inductor. R 0 is parasitic resistance of the Lithium niobate substrate. C 0 is a static capacitance. C m , R m , and L m represent motional resistor, inductors, and capacitance. Where f s is the resonance frequency, f p is the anti-resonance frequency and Q s and Q p are corresponding quality factors [7,8]. The value of the equivalent circuit component can be obtained from the following equations.
C m = C 0 f p f s 2 1
L m = 1 2 π f s 2 C m
R m = 1 Q s L m C m
R 0 = 1 2 π f p C 0 Q p

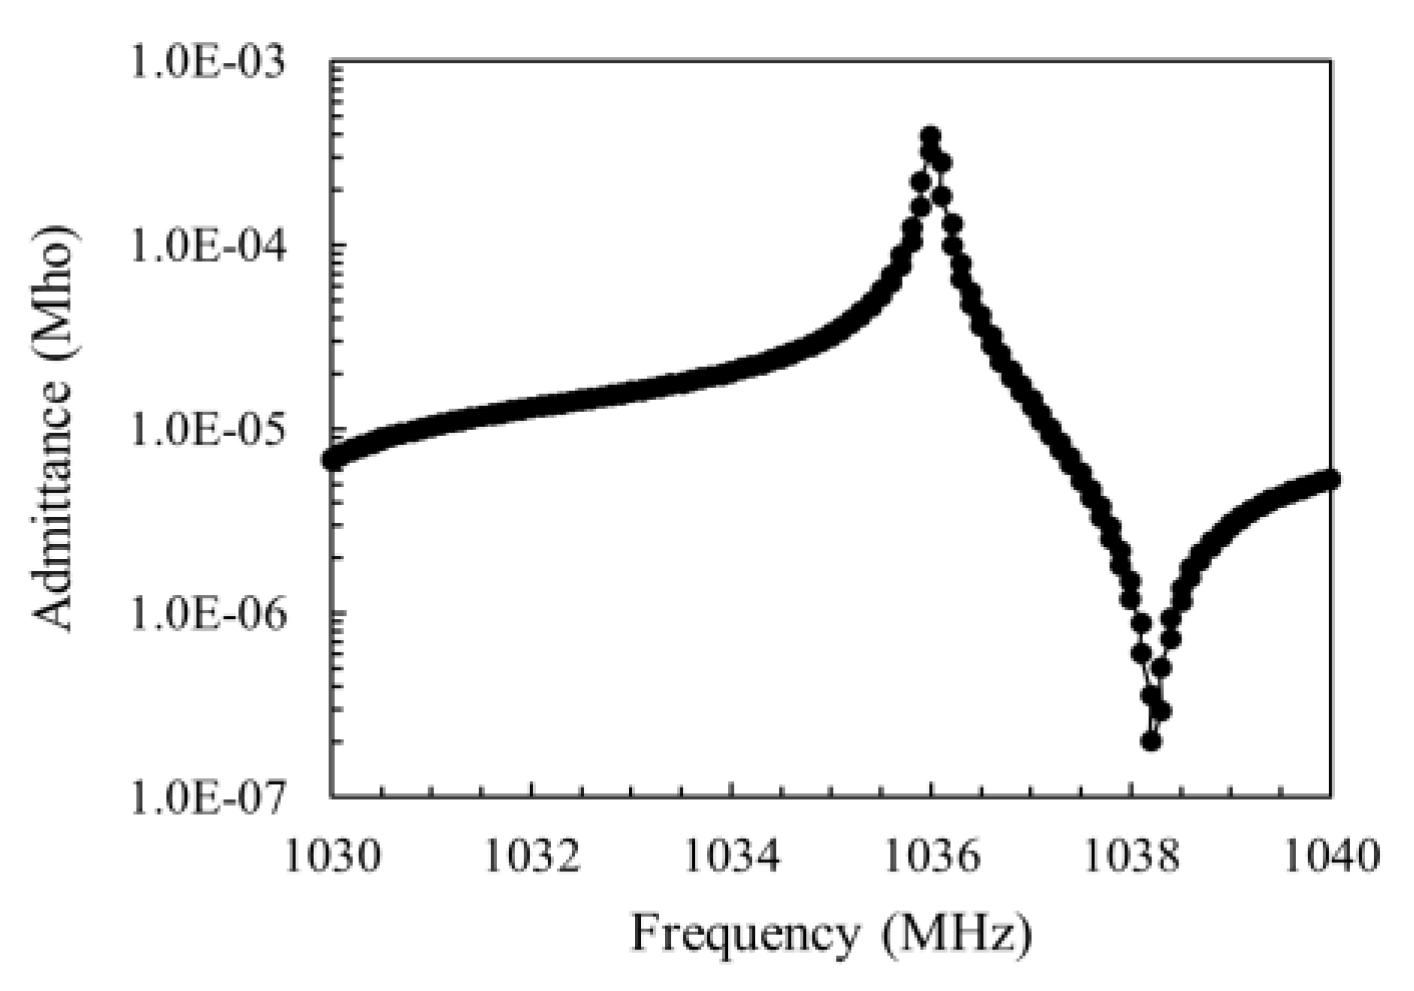
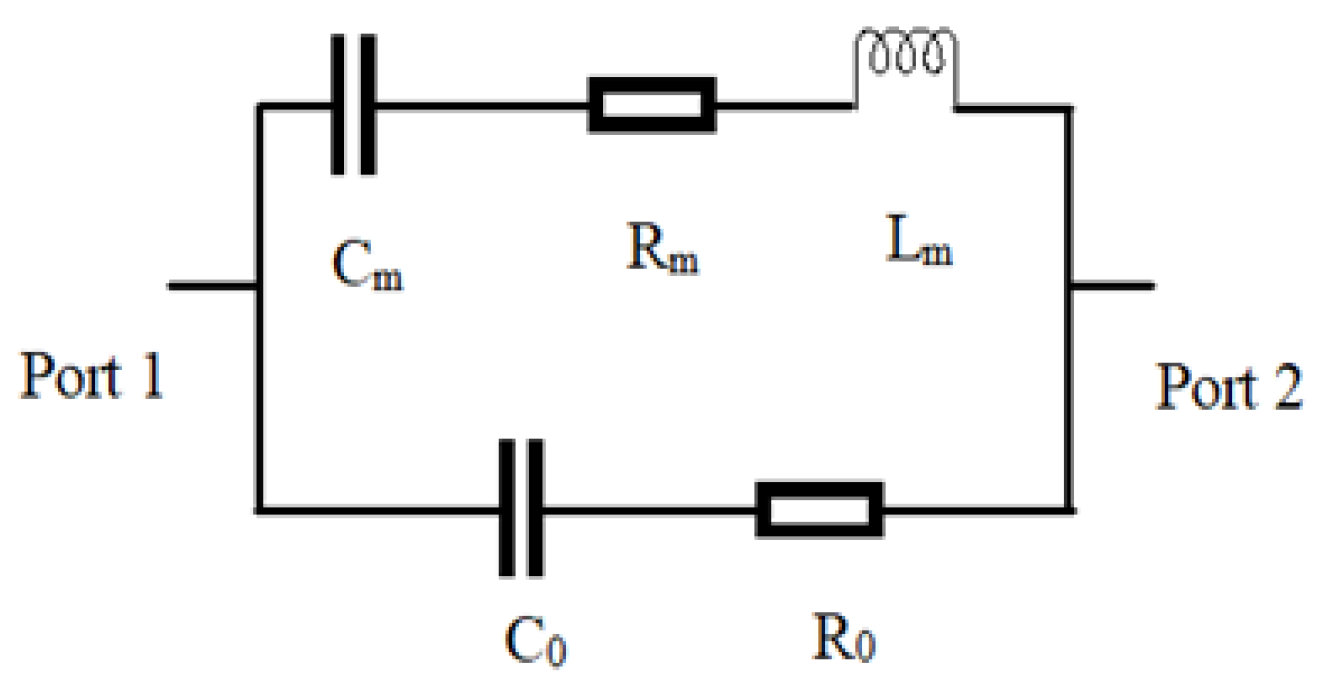
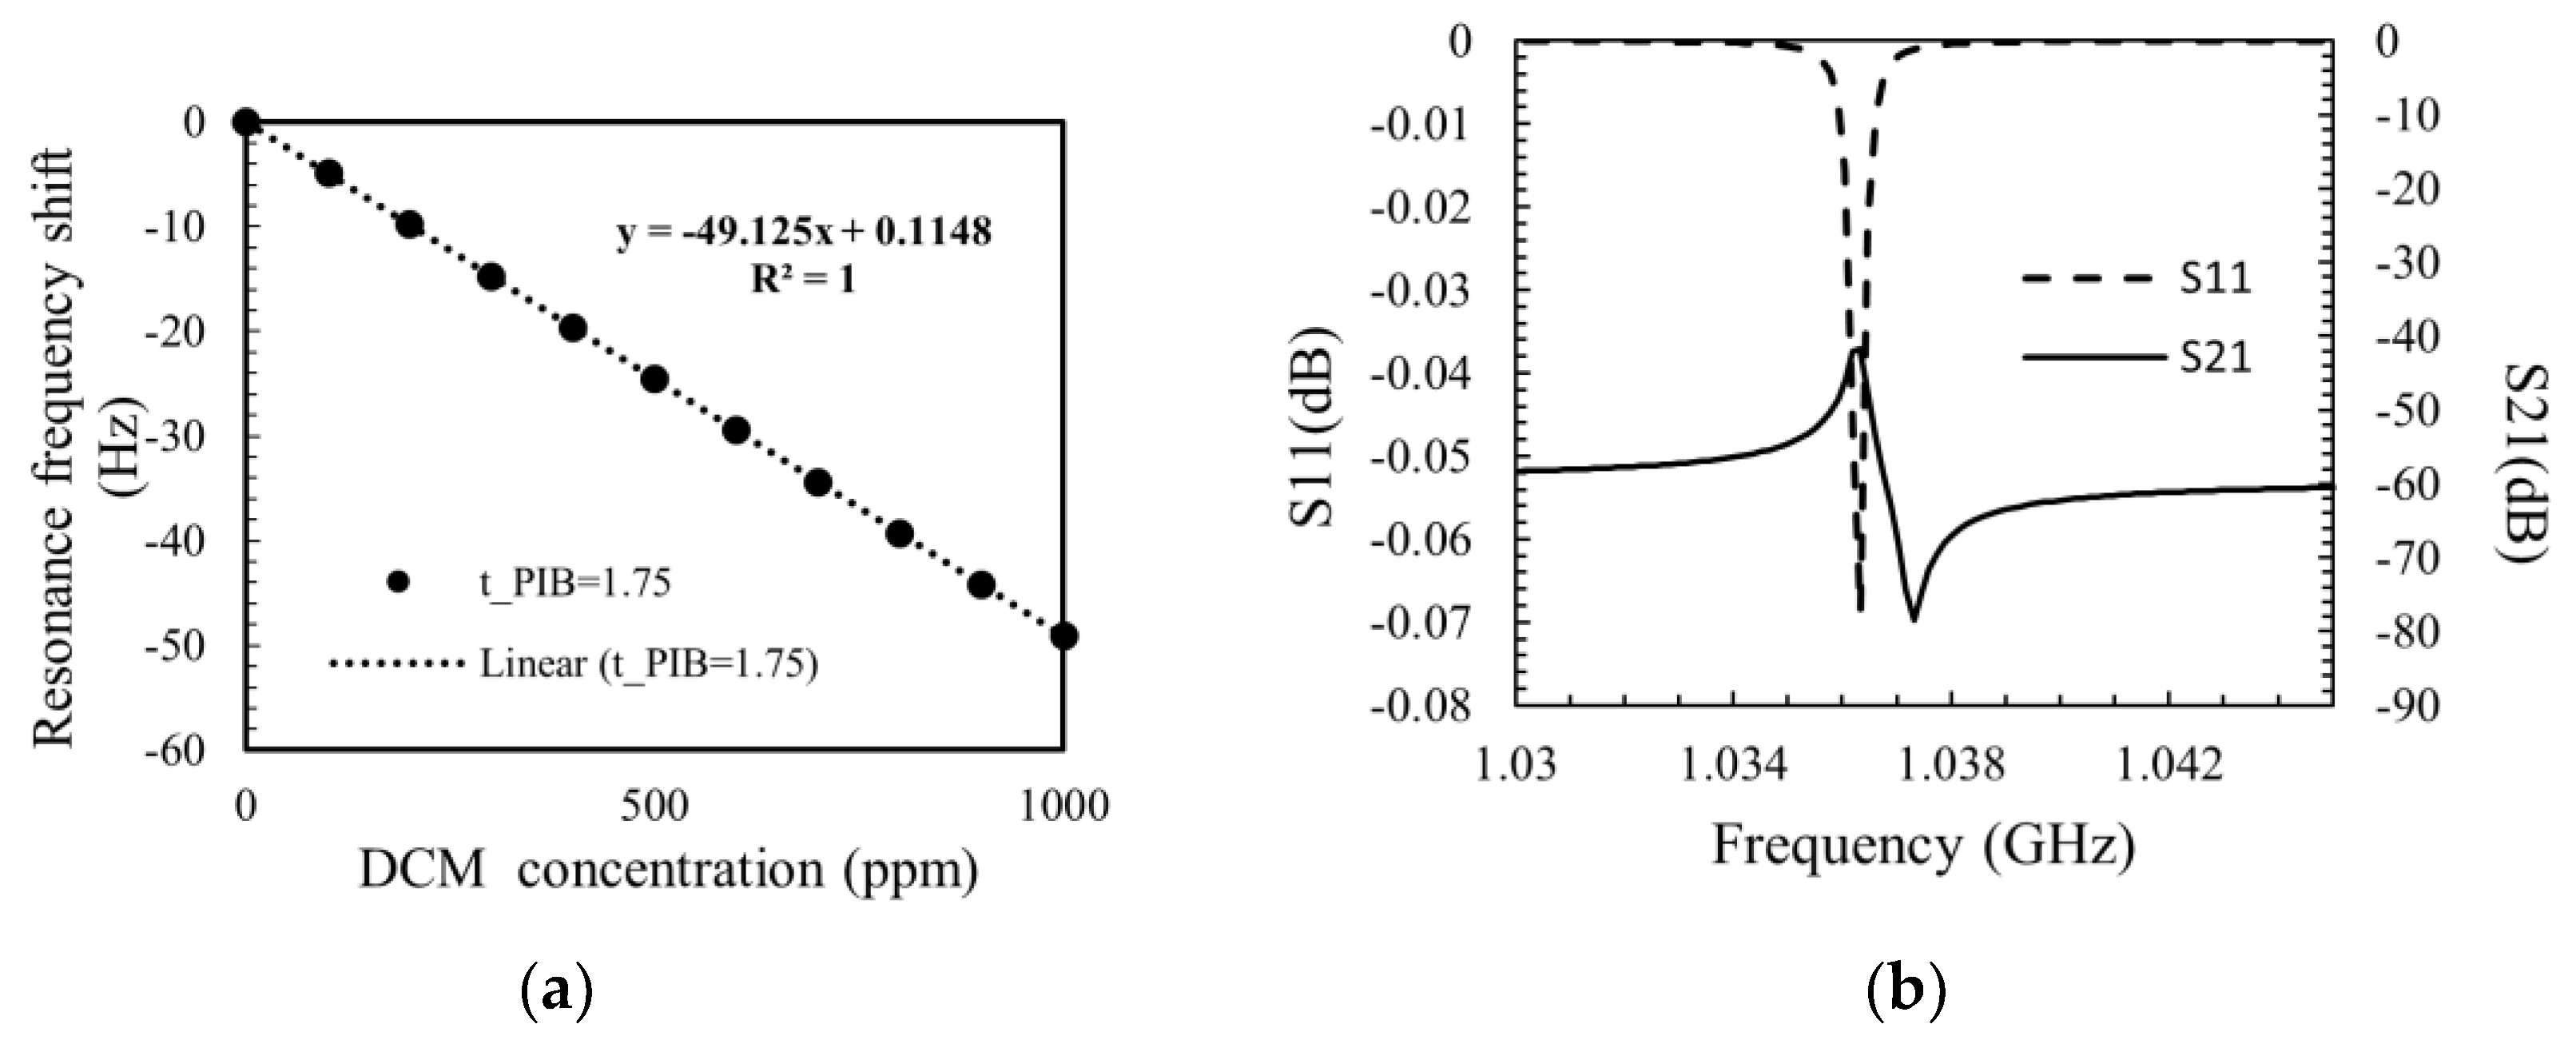
3. Results and Discussion

The device 3D geometry is shown in Figure 3a. The SAW device’s central frequency is set to 1GHz. The PIB sensing layer thickness and guiding layer thickness were optimized with respect to λ , and quality factor values were recorded. When the SAW gas sensor was subjected up to 1000 ppm of gas in the air, the resonance frequency decreased due to the mass loading impact on the sensor layer. Figure 3b shows the von mises stress (surface deformation plots) at 1000 ppm of DCM. The results ensured the production of love waves on the surface of LiNbO3.
The resonance and anti-resonance frequencies ( f s   &   f p ) were found to be 1.036 GHz and 1.038 GHz, respectively, as shown in Figure 4. The lowest SAW mode was split into two Eigen solutions by the IDE and PIB film. The resonant mode frequency or the lowest frequency is where waves interfere constructively during propagation. The other represents the anti-resonance frequency at which waves interfere destructively. These two frequencies are the boundaries of the stop band and do not support wave propagation.
The frequency shift of the sensor from 0 to 1000 ppm dichloromethane gas concentration varies linearly with PIB thickness. These results guarantee the stability of the love wave gas sensor for various gas concentrations (0 to 1000 ppm). The adsorbed DCM increases the PIB mass density and lowers the phase velocity and consequently the operating frequency, which can be associated with the concentration of investigated gas. Figure 5a depicts the dependency of the resonance frequency shift on the concentration of the DCM gas. The frequency shift Δ f of the device can be calculated as Δ f = f f 0 , where f and f 0 are the resonance frequencies after the corresponding value and before the exposure to the gas, respectively (i.e., a negative value) [9].
Figure 5a shows the frequency shift against the gas concentration with the sensitivity of 49 Hz/ppm for dichloromethane (DCM) gas.
The equivalent circuit is extracted form the COMSOL and the parameter of the circuit is shown in Table 2. It shows the effect of DCM gas sensing on the circuit parameter. The circuit component of motional resistance (Rm) decreases, whereas the parasitic resistance (R0) increases after the DCM gas exposure to the SAW. Figure 5b shows equivalent circuit simulation using the Quite Universal Circuit Simulator. The S11 of the simulation results showed the 0 ppm concentrations around 1036 MHz with −0.07 dB attenuation. Similiarly the insertion loss parameters were obatained with the S21 spectrum (Figure 5b).

4. Conclusions

Using COMSOL Multiphysics 6.0 [9], the simulations of LiNbO3-based SAW devices have been performed in the present work. The essential data required for the design of a SAW device, such as the type of SAW, its resonance frequencies, and its quality factor, have been extracted. The device was discovered to support love wave mode with a resonance frequency of 1.036 GHz. The linear shift of the carrier concentration provides the gas sensor’s stability from 0 to 1000 ppm concentration. The change in S parameter values gave the quantity of DCM gas adsorbed on the PIB sensing layer. The proposed simulation model can be used for further SAW device research and development based on LiNbO3.

Author Contributions

Conceptualization, A.V.A., B.P. and S.V.; methodology, A.V.A. and B.P.; software, A.V.A. and B.P.; validation, S.V., B.P. and A.V.A.; formal analysis, A.V.A., B.P. and S.V.; investigation, A.V.A., B.P. and S.V.; resources, A.V.A. and B.P.; data curation, A.V.A.; writing—original draft preparation, A.V.A.; writing—review and editing, S.V.; visualization, A.V.A.; supervision, S.V.; project administration, S.V. All authors have read and agreed to the published version of the manuscript.

Funding

This research received no external funding.

Institutional Review Board Statement

Not applicable.

Data Availability Statement

Not applicable.

Acknowledgments

The authors thank the Indian Science Technology and Engineering facilities Map (I-STEM) [10], a program supported by the office of the Principal Scientific Adviser to the Govt of India, for enabling access to the COMSOL Multiphysics 6.0 software [11] suite used to carry out this work.

Conflicts of Interest

The authors declare no conflict of interest.

References

  1. United States Environmental Protection Agency. (An Official Website of United States Govt): Volatile Organic Compounds—Indoor Air Quality. Available online: https://www.epa.gov/ (accessed on 15 May 2022).
  2. Campbell, C. Surface Acoustic Wave Devices and Their Signal Processing Applications; Elsevier: Amsterdam, The Netherlands, 2012; ISBN 0-12-157345-1. [Google Scholar]
  3. Matatagui, D.; Fontecha, J.; Fernández, M.J.; Oliver, M.J.; Hernando-García, J.; Sánchez-Rojas, J.L.; Gràcia, I.; Cané, C.; Santos, J.P.; Horrillo, M.C. Comparison of two types of acoustic biosensors to detect immunoreactions: Love-wave sensor working in dynamic mode and QCM working in static mode. Sens. Actuators B 2013, 189, 123–129. [Google Scholar] [CrossRef]
  4. Kumar, M.; Bhadu, D. Design Performance and Frequency Response Analysis of SAW-Based Sensor for Dichloromethane Gas Sensing Amidst the COVID-19. J. Vib. Eng. Technol. 2021, 9, 725–732. [Google Scholar] [CrossRef]
  5. Panchal, B.; Varghese, S. 3D FEM Simulation and Analysis of Fractal Electrode-Based FBAR Resonator for Tetrachloroethene (PCE) Gas Detection. Fractal Fract. 2022, 6, 491. [Google Scholar] [CrossRef]
  6. Ho, C.K.; Lindgren, E.R.; Rawlinson, K.S.; McGrath, L.K.; Wright, J.L. Development of a Surface Acoustic Wave Sensor for In-Situ Monitoring of Volatile Organic Compounds. Sensors 2003, 3, 236–247. [Google Scholar] [CrossRef] [Green Version]
  7. Gao, L.; Yang, Y.; Gong, S. Wideband Hybrid Monolithic Lithium Niobate Acoustic Filter in the K-Band. IEEE Trans. Ultrason. Ferroelectr. Freq. Control 2021, 68, 1408–1417. [Google Scholar] [CrossRef] [PubMed]
  8. Hashimoto, K. (Ed.) RF Bulk Acoustic Wave Filters for Communications; Artech House: Norwood, MA, USA, 2009; ISBN 9781596933217. [Google Scholar]
  9. Moustafa, M.; Laouini, G.; Alzoubi, T. Finite Element Analysis of SAW Sensor with ZnO Substrate for Dichloromethane (DCM) Gas Detection. Arch. Acoust. 2021, 46, 419–426. [Google Scholar] [CrossRef]
  10. I-STEM. Available online: www.istem.gov.in (accessed on 18 July 2022).
  11. COMSOL. Available online: www.comsol.com (accessed on 26 June 2021).
Figure 1. Schematic diagram.
Engproc 27 00027 g001
Figure 2. Equivalent circuit of SAW resonator.
Engproc 27 00027 g002
Figure 3. (a) Meshed 3D model of the proposed design, (b) Surface deformation.
Engproc 27 00027 g003
Figure 4. Admittance plot.
Engproc 27 00027 g004
Figure 5. (a) Frequency shift of the sensor with dichloromethane gas concentration (b) QUCS S11 and S21 spectrum when DCM = 0 ppm.
Engproc 27 00027 g005
Table 1. DCM parameters.
DescriptionValue
DCM concentration in air (mol/m3)0.040874
Molar mass of DCM (kg/mol)0.08493
PIB/air partition constant for DCM30.346
Mass concentration of DCM in PIB (kg/m3)0.10534
Table 2. Equivalent circuit components.
Circuit ParametersWhen DCM = 0 ppmWhen DCM = 1000 ppm
C m   f F 3.13 × 10−23.12 × 10−2
L m   m H 7.547.55
R m (KΩ)10.7395.690
R 0   (Ω)18.88.00
C 0   f F 1.6251.62
Publisher’s Note: MDPI stays neutral with regard to jurisdictional claims in published maps and institutional affiliations.

