Abstract
In aviation measurement of static and total pressure is widely used to determine the flight conditions. Results of pressure measurements are used to monitor flight attitude, equivalent speed, Mach number, vertical velocity etc. The algorithm for data acquisition and processing for developed pressure measurement system is presented in this paper.
1. Introduction
A variety of systems for the monitoring of aircraft flight parameters based on different working principles exists today [1,2,3,4,5,6,7,8,9,10]. Perspective and existing systems show high measurement speed and efficiency of sensors based on optical methods of information conversion [6,7,8]. The working principle of optical pressure sensors is based on determination of the position of light spots on the surface of a Photodetector Array (PA). The light spots are formed by Light Emitting Diodes (LED). The LEDs are rigidly attached to the frame of the device. The PA is attached to a pressure sensitive element such as an elastic membrane. The membrane is strained by the change of pressure which leads to a displacement of the light spot. Thus, the change of measured value is proportional to the light spot displacement relative to the initial position.
One of the disadvantages of this type of device is that the information about the current optical spot coordinate is obtained discretely with a period equal to the time interval required for polling all the PA elements. The minimum time interval between PA polls is limited by the technical capabilities of the PA. In addition, if a detector is mounted to a membrane there is a decrease in the dynamic stability of the system.
The developed optical pressure sensor is devoid of these drawbacks. The shutters with n slots are attached to the membranes instead of the detector arrays. This allows n optical spots to form on the surface of the PA. All n optical spots are displaced when the static and (or) total pressure changes. The photodetectors of the PA are polled sequentially. An electrical signal is formed at the output of the PA during the polling cycle. The signal amplitude reflects the distribution of optical power along the PA. The maxima in the output signal from the PA correspond to the positions of the optical spots. By utilizing the shutter with n slots we are able measure pressure n times in one polling cycle. The sensor has a higher dynamic stability as the PA is rigidly fixed to the sensor body. The dimensions of the device are also reduced as the shutters are more compact than the PA.
2. Data Acquisition Algorithm
The conversion of the electrical signals (Vaut) from the PA into a digital code is performed by an analog-to-digital converter (ADC) built in the microcontroller. Acquired data are then processed by the microcontroller and the results are transmitted to a personal computer via the Universal Asynchronous Receiver-Transmitter (USART) interface. The sequence of control clock (CLK) pulses determines the appearance of a signal at the PA output (Figure 1). Therefore, the sampling rate of all pixels of the line is determined using the following condition: each subsequent control Read-Out Gate (ROG) pulse must appear after the passage of 2087 CLK pulses.
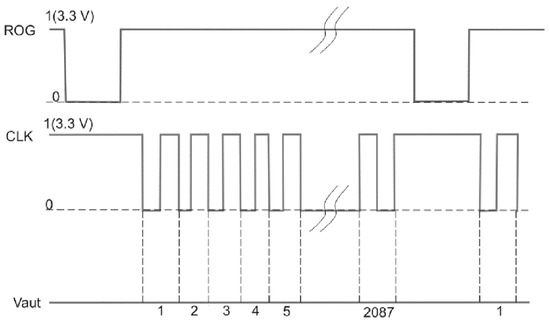
Figure 1.
Diagram of control pulses.
The STM32 microcontroller algorithm can be divided into two infinite parallel loops.
Loop No 1:
- The Startup of the ADC channel is performed by a trigger from the timer. The data are then saved in the array with the use of direct memory access (DMA).
- The CLK signal is inverted by an ADC interrupt handler after each conversion. (This approach to forming CLK pulses allows acquisition of a data array of 4174 values for the PA consisting of 2087 pixels).
- The flag of the completion of polling of the first half of the PD is set in the DMA interrupt handler after half of the data array is filled.
- The flag of the PA polling completion is set in the DMA interrupt handler and the reset signal (ROG) is formed after the whole data array is filled.
Loop No 2:
- Tracking the status of the polling of the first half of the PA. If the corresponding flag is set, data are copied to the other memory region and then processed.
- If the averaging is not performed the results are transmitted via the USART interface.
- Tracking the status of the polling of the whole PA. If the corresponding flag is set, the data are copied to the other memory region and then processed.
- If the averaging is not performed the results are transmitted via the USART interface.
- The results are averaged and then transmitted via USART.
3. Data Processing Algorithm
The algorithm for calculating the coordinates of the light spot uses the centroid-method and is implemented as follows. First, the positions of pixels Nmax_n corresponding to local signal maxima are determined. Then an area of M pixels around the local maxima is selected. The value of M is chosen in such a way as to include all pixels around the maximum signals which are noticeably higher than the background noise level. The coordinate of the signal maximum is then calculated according to the following formula:
where MAXn—coordinate of the maximum of n-th light spot expressed in the pixel number, Ai—signal amplitude from i-th pixel in vicinity of n-th optical spot, Nmax_n—number of pixels having a maximum amplitude around the n-th optical spot. The elastic membrane deforms as a result of pressure change. The deformation of the membrane leads to displacement of the optical spots. Computation of the new coordinates of the optical spots using (1) allows determination of the change of pressure relatively to some reference value according to the formula:
where ΔPstn(t)—current value of pressure change, MAXn(t)—coordinate of the n-th optical spot maximum at time t, MAXn(0)—coordinate of the n-th optical spot maximum at reference pressure, kn—calibration constant.
4. Conclusions
When using the presented algorithm for collecting and processing information, the measurement speed of the developed pressure sensor is determined using the repetition rate of the control pulses. The proposed solution provides reduced error values when calculating the altitude and speed parameters of the aircraft. Averaging of the results from one complete poll of PA (n spots) increases accuracy by n1/2 times. On the other hand, when measurement speed is more important, the value of pressure can be obtained from the position of one optical spot.
The high speed of the measuring system in the future will make it possible to apply algorithms that provide compensation for various kinds of destabilizing factors (interference, vibrations, shock effects, etc.) that arise during the operation of an aircraft.
Author Contributions
Conceptualization, R.B. and A.K.; methodology, A.K.; software, R.B.; validation, A.K. and S.T.; formal analysis, A.K.; investigation, A.L. and D.K.; resources, R.B.; data curation, A.K.; writing—original draft preparation, A.L.; writing—review and editing, A.L. and D.K.; visualization, A.K.; supervision, S.T.; project administration, A.K. All authors have read and agreed to the published version of the manuscript.
Funding
This research received no external funding.
Institutional Review Board Statement
Not applicable.
Informed Consent Statement
Not applicable.
Data Availability Statement
Not applicable.
Conflicts of Interest
The authors declare no conflict of interest.
References
- Fraden, J. Handbook of Modern Sensors; Springer: New York, NY, USA, 2003. [Google Scholar]
- Auersvald, J.; Draxler, K.; Sipo, M. A Low-cost Aerometric Sensor system for Sport Aviation. J. Electr. Eng. 2019, 4, 295–302. [Google Scholar] [CrossRef]
- Auersvald, J.; Draxler, K. Aerometric System for General Aviation. In Proceedings of the International Conference on Military Technologies (ICMT), Brno, Czech Republic, 19 May–21 May 2015; pp. 1–6. [Google Scholar]
- Almazov, V.V.; Makarov, N.N.; Sorokin, M.Y. Evaluation of Performance of Aerometric Systems. Izv. Samara Sci. Cent. Russ. Acad. Sci. 2017, 1, 385–390. [Google Scholar]
- Philippe, J.; De Paolis, M.V.; Arenas-Buendia, C.; Henry, D.; Coustou, A.; Rumeau, A.; Aubert, H.; Pons, P. Passive and Chipless Packaged Transducer for Wireless Pressure Measurement. In Sensors and Actuators A: Physical; Elsevier: Amsterdam, The Netherlands, 2018; pp. 753–762. [Google Scholar]
- Soldatkin, V.V.; Soldatkin, V.M.; Derevyankin, V.P. Models of Signals, Characteristics, and Errors of the Axisymmetric Multifunction Air Pressure Sensor for Aircraft Aerometric Systems. Russ. Aeronaut 2021, 64, 105–110. [Google Scholar] [CrossRef]
- Jena, S.; Gupta, A. Embedded Sensors for Health Monitoring of an Aircraft. In Sensors for Automotive and Aerospace Applications. Energy, Environment, and Sustainability; Bhattacharya, S., Agarwal, A., Prakash, O., Singh, S., Eds.; Springer: Berlin/Heidelberg, Germany, 2019. [Google Scholar]
- Leitzke, J.P.; Della Mea, A.; Faller, L.M.; Mühlbacher-Karrer, S.; Zangl, H. Wireless Differential Pressure Measurement for Aircraft. Measurement 2018, 122, 459–465. [Google Scholar] [CrossRef]
- Kwon, H.; Park, Y.; Shin, C.; Kim, J.H.; Kim, C.G. In-Flight Strain Monitoring of Aircraft Tail Boom Structure Using a Fiber Bragg Grating Sensor Based Health and Usage Monitoring System. Int. J. Aeronaut. Space Sci. 2021, 22, 567–577. [Google Scholar] [CrossRef]
- Antonets, I.V.; Gorshkov, G.M.; Borisov, R.A. Datchik Aerometricheskikh Davleniy (Aerometric Pressure Sensor). RU Patent 2653596, G01L7/00, 11 May 2018. [Google Scholar]

Publisher’s Note: MDPI stays neutral with regard to jurisdictional claims in published maps and institutional affiliations. |
© 2022 by the authors. Licensee MDPI, Basel, Switzerland. This article is an open access article distributed under the terms and conditions of the Creative Commons Attribution (CC BY) license (https://creativecommons.org/licenses/by/4.0/).