Proceeding Paper

Numerical Prediction of the Influence of Process Parameters and Process Set-Up on Damage Evolution during Deep Drawing of Rectangular Cups †

1
Laboratory for Machine Tools and Production Engineering (WZL), RWTH Aachen University, 52074 Aachen, Germany
2
Fraunhofer Institute for Production Technology, 52074 Aachen, Germany
*
Author to whom correspondence should be addressed.
Presented at the 28th Saxon Conference on Forming Technology SFU and the 7th International Conference on Accuracy in Forming Technology ICAFT, Chemnitz, Germany, 2–3 November 2022.
Eng. Proc. 2022, 26(1), 6; https://doi.org/10.3390/engproc2022026006
Published: 4 November 2022

Abstract

:
The manufacturing of three-dimensional components by deep drawing is performed using flat sheets. The material properties of the sheets are influenced by the deep drawing process by means of microstructural effects (e.g., anisotropy, residual stresses, voids, lattice defects). The resulting effects, especially voids and lattice defects, influence the component in the form of damage accumulation and evolution. Depending on the process route and parameters, different load paths are created, which lead to different damage evolution scenarios. This paper numerically investigated the influence of process parameter (drawing ring radius) as well as process set-up (multi-step deep drawing and reverse drawing) during deep drawing and the associated load paths on damage evolution in rectangular cups made out dual phase steel DP800.

1. Introduction

1.1. Initial Situation

The transport sector is the third largest source of greenhouse gas emissions in Germany, accounting for 20.4% of total emissions. Road transport accounts for 96% of the transport sector’s greenhouse gas emissions. Rail, water, and national air transport account for the remaining 4% of the share [1]. Due to the European Union’s climate goals of transforming the economy of the member states into being a net-zero greenhouse gas-emitting economy, the resources used, especially in the automotive industry, need to be increasingly scrutinized for environmental aspects [2]. Reducing vehicle mass through light-weight design is a significant measure for reducing energy demand and serves to improve a vehicle’s resource efficiency during service life [3]. In addition to increasing resource efficiency during service life, lightweight design measures also offer further potential for improving resource efficiency in other life cycle phases [4]. By optimizing the product design of individual components, for example, it is possible to reduce the use of materials and thus achieve a lower input of raw materials while at the same time less material has to be recycled at the end of the service life.
Deep drawing is the most important manufacturing process for sheet metal components with three-dimensional geometry and is commonly used in the automotive industry. Frequently produced components by means of deep drawing are in particular car body components [5]. Accordingly, the lightweight design approach to reducing greenhouse gas emissions is also being pursued in deep drawing. However, all those measures must not be achieved at the expense of safety.

Definition of Damage

In the product and process design of metallic components, the influence of the forming process and the material on the component properties is frequently considered nowadays [6]. This includes advantages inherent in the manufacturing process, such as strengthening of the material by work hardening. However, currently hardly any consideration is given to the damage occurring during the forming process and how it changes depending on the influencing factors along the process route [7]. Due to the complex nature of damage, which encompasses multiple scales and mechanisms, it is intrinsically difficult to predict and account for its evolution throughout the process route [6]. Moreover, different definitions of damage are commonly used with emphasis on the difference between the reference to a certain area or volume [8] or to the determination during the measurement [9]. The definition of damage on which this work is based is as follows:
“The process of ductile damage describes the formation, growth and coalescence of voids in the microstructure. These voids are formed in structural materials by decohesion at interfaces such as phase/grain boundaries and inclusions, or by the formation of new surfaces within phases or inclusions. This damage causes degradation of the performance of the corresponding component.”

1.2. State of the Art

1.2.1. Damage Modelling

In order to quantify the damage evolution of the material, several models have been developed. These include, for instance, the models of Cockroft and Latham [10] and Bao and Wierzbicki [11], which quantify damage as a scalar damage variable. The failure occurs by the damage variable reaching a critical value. Other models, e.g., Gurson [12], Tvergaard and Needleman [13], and Lemaitre [14], suggest that interaction between damage and plasticity properties of the material occur and base their microstructural models on these assumptions.
The basis of the Lemaitre damage model is the definition of the damage variable D , affecting the plasticity behavior of the material and resulting in the development of voids and microcracks [15]. The damage variable D was first introduced by Kachanov [16] and later utilized by Lemaitre and relates the cross-sectional areas of the material in the damage-free state and in the current state. D becomes mathematically accessible by forming the ratio of the damage-free area increment S and the area increment S D affected by damage (Formula (1)). In addition to area-related damage measures, volume-related damage measures can also be defined in analogy [17].
D = S D S
When loaded by mechanical forces, stresses are induced in the component. These change the damage evolution and the damage variable D grows. As the stresses are distributed less and less over the entire material cross-section in the increasing damage state, a damage-dependent expression for the stresses occurring in the component is required. The concept of effective stress σ ˜ used for this purpose and expressed as follows, whereby.
σ is the stress and calculated as the ratio of the force F and the area increment S . With the coupling of the damage variable D and the stress σ , the change in elastic and plastic behavior can be estimated, thereby illustrating the changing response of the material to applied stress [18].
σ ˜ = F S S D = F ( 1 D ) S = σ 1 D

1.2.2. Deep Drawing

Deep drawing is defined as the tensile compression forming of a blank sheet into a hollow body or of a hollow body into a hollow body with a smaller circumference without any intended change in the sheet thickness [5]. The sheets used in deep drawing usually undergo the process chain of steelmaking, continuous casting, hot and cold rolling, and heat treatment prior to deep drawing. The casting process thereby causes damage in the form of voids and inclusions in the material of the cast slab. Subsequent rolling processes further elaborate this damage and generate new damage. Deep drawing, in turn, further processes the accumulated damage in the material of the part. Moreover, depending on the process parameter and process set-up of each process step, a different damage state results. The damage state after deep drawing, however, is the one that influences the service properties of the component regarding fatigue and crash behavior [7]. In deep drawing, the sheet is first clamped between the blankholder and the die. When the punch contacts the sheet, the bottom of the component is initially formed. The material then flows out of the sheet thickness without any material flowing out of the flange area. Not until the applied force exceeds the flange pulling force does the actual deep drawing process begin. As the material initially flows out of the sheet thickness, a forced thinning of the sheet occurs due to volume constancy although no change in the sheet thickness is desired in general. The thinning takes place as a function of the radius ratio of punch and die and tends to occur where the smaller radius is present. Therefore, the beginning of the process is usually referred to as stretch drawing rather than deep drawing. The thinning of the sheet leads to a plastic deformation, which is necessary for damage in the present understanding. Thus, the plastic deformation at the beginning of the process not only consists of bending but is superimposed with the thinning of the sheet [19].

1.2.3. Damage Evolution during Deep Drawing

In the past, many investigations were conducted to identify influencing factors of the deep drawing process, e.g., friction, blank holder force, blank shape, and punch velocity [20]. Most of the work is aimed at producing a component that is free of defects at the macroscopic level for instance considering wrinkling [21,22], sheet thinning [23], and springback [24,25]. Besides that, efforts have been made to numerically predict damage occurrence during deep drawing. Considering the macroscopic scale, Fan et al. investigated the position of crack initiation considering the blank holder force and friction during deep drawing of a quadratic shaped component from mild steel using an elasto-plastic constitutive equation accounting for isotropic hardening coupled with material damage [26]. Kami et al., on the other hand, used an anisotropic formulation of the Gurson–Tvergaard–Needleman damage model for fracture prediction during deep drawing of a rectangular box made from an AA6016-T4 [27]. Similar to this, Barrera et al. calibrated the anisotropic Hosford–Coulomb ductile fracture criterion to foresee the fracture initiation during the Erichsen test of DC04EK4 drawing steel [28], while Saxena et al. used the Lemaitre damage model for prediction of fracture initiation in deep drawn of rectangular cups [29]. Considering the microscopic scale of damage and the definition of damage that underlies this work, Nick et al. investigated in previous work the influence of friction modeling on damage prediction in deep drawing simulations of rotationally symmetric cups of DP800 dual phase steel [30], as well as the damage evolution during Nakajima tests [31] and during single-step, two-step, und reverse deep drawing of rotationally symmetric cups from DP800 dual phase steel [32].
The research tackled by this paper aimed to influence the damage accumulation and evolution during deep drawing of rectangular cups by adjusting the process parameters and the process set-up in order to subsequently improve the performance of the components in terms of fatigue and crash behavior. Thus, components can be designed to be lighter while retaining the same load resistance and safety factor. The edge of the cups thereby represents one of the difficult features in deep-drawing production, whereby, in contrast to rotationally symmetric cups, an asymmetrical material flow is caused, which frequently leads to bottom tear and sheet thinning due to a more complex stress–strain state [33]. In this work, however, only microscopic damage was considered, excluding tearing and cracks. The novelty of the work lies in the fact that the aim was not to predict fracture initiation.
Instead, the objective was to selectively adjust damage states in the material of rectangular cups by varying the process parameters and process set-up so that components can achieve a higher performance in terms of fatigue and crash behavior under consideration of the loads in subsequent service. The work is a continuation of refs. [30,31,32] and used the simulation models established therein. However, the significantly more complex stress state in the component due to its shape results in a different challenge.

2. Materials and Methods

2.1. Deep Drawing Process

The deep drawing process investigated is the manufacturing of rectangular cups from DP800 dual phase steel with a sheet thickness of s = 1.5 mm. The punch velocity was set to vp = 50 mm/s for each process variation. The cups were drawn until one cup of the different process variants showed a fraction void area D = 1. Shortly before this point, the cups were compared with each other. The blank holder force was not set globally due to the different forces required by the various processes. Instead, the blank holder was used in a path-controlled manner and retained in a fixed position considering the sheet thickness. The tools used as well as the process route are illustrated schematically in Figure 1.

2.2. Process Model

The deep drawing processes were modeled using ABAQUS/Explicit from Dassault Systèmes, Vélizy-Villacoublay, France. The symmetry of the component was used to reduce the calculation time. Thus, only one quarter of the process was simulated. The sheet was modeled as a solid deformable body using three-dimensional reduced-integration brick elements (C3D8R). The blankholder, punch, and die were represented as shell discrete rigid bodies with 4-node, bilinear quadrilateral elements (R3D4). The contact of the part was modelled as General Contact with a homogeneous Coulomb friction coefficient of μ = 0.05, as identified in previous strip drawing tests. Each process variant was separated into two steps. The punch, drawing die, and blankholder began the process without contact with the sheet. In the first step, the blankholder moved downwards until reaching a distance of 1.5 mm to the drawing die establishing contact with the sheet. During the second step, the punch moved towards the sheet with a constant velocity, making contact with the sheet und pushing it downwards while the blankholder pressed the sheet against the drawing die to prevent winkling while maintaining its position.
The Lemaitre damage model used in this study is based on the work of Soyarslan [34]. The model parameters of the calibrated material model are identical to previous work and were published in ref. [30]. The constitutive model was implemented as a Vumat subroutine and has already been successfully used in previous work [30,32].

3. Results

In order to compare the effects of process set-up and process parameters on damage evolution, the damage variable D according to the Lemaitre model was extracted in the critical area of the component, the edge, which indicates the failure of the component during forming. The results were compared at a selected reference position just before the first component achieves D = 1. The reference position is located precisely in the edge of the component at the point where the highest damage can be identified. To calculate the damage variable D , the value was averaged through the sheet thickness.

3.1. Influence of Process Parameter on Damage Evolution

The results for the variation of process parameters in form of different drawing die radii r ddr are depicted in Figure 2. When the deep drawing process began, the damage variable in all elements was zero until initial contact of the die, punch, and sheet was established. Such is the result of the sheet holder first pressing the sheet onto the drawing die to ensure stable contact followed by movement of the punch towards the sheet without contact. Damage development started in the considered area after the punch path reached approx. s = 2 mm, once plastic deformation due to the bending at the drawing ring radius and around the punch began. The three damage variable curves all started to increase from a punch path of s = 2 mm. All progressions showed an approximately linear increase with an offset with ascending die radius. Starting from a punch path of s = 7 mm, the curves diverged. The curve of drawing die radius r ddr = 3 mm showed a considerably stronger increase than the other two curves. At the selected reference position of s = 9 mm, the damage variables reached D r = 3 = 0.16, D r = 6 = 0.098, and D r = 9 = 0.074.
Figure 3 shows the distribution of the damage variable D in the cross section of the edge of the parts. As is apparent, the area affected by damage in zone 1 decreased as the drawing die radius r ddr increased. Considering zone 2, the extent of damage evolution was detectable only with a drawing ring radius r ddr = (3; 6) mm. Furthermore, a thinning of the sheet can be seen in zone 1 for every drawing ring radius r ddr . In zone 2, however, the thinning only occurred for drawing ring radius r ddr = 3 mm. Apart from the drawing ring radius r ddr , the geometries of the components also differed in the shape of the wall. The shape of the wall was less vertical as the drawing ring radius increased, since the punch path is limited. However, the cup depth was identical for the three components.

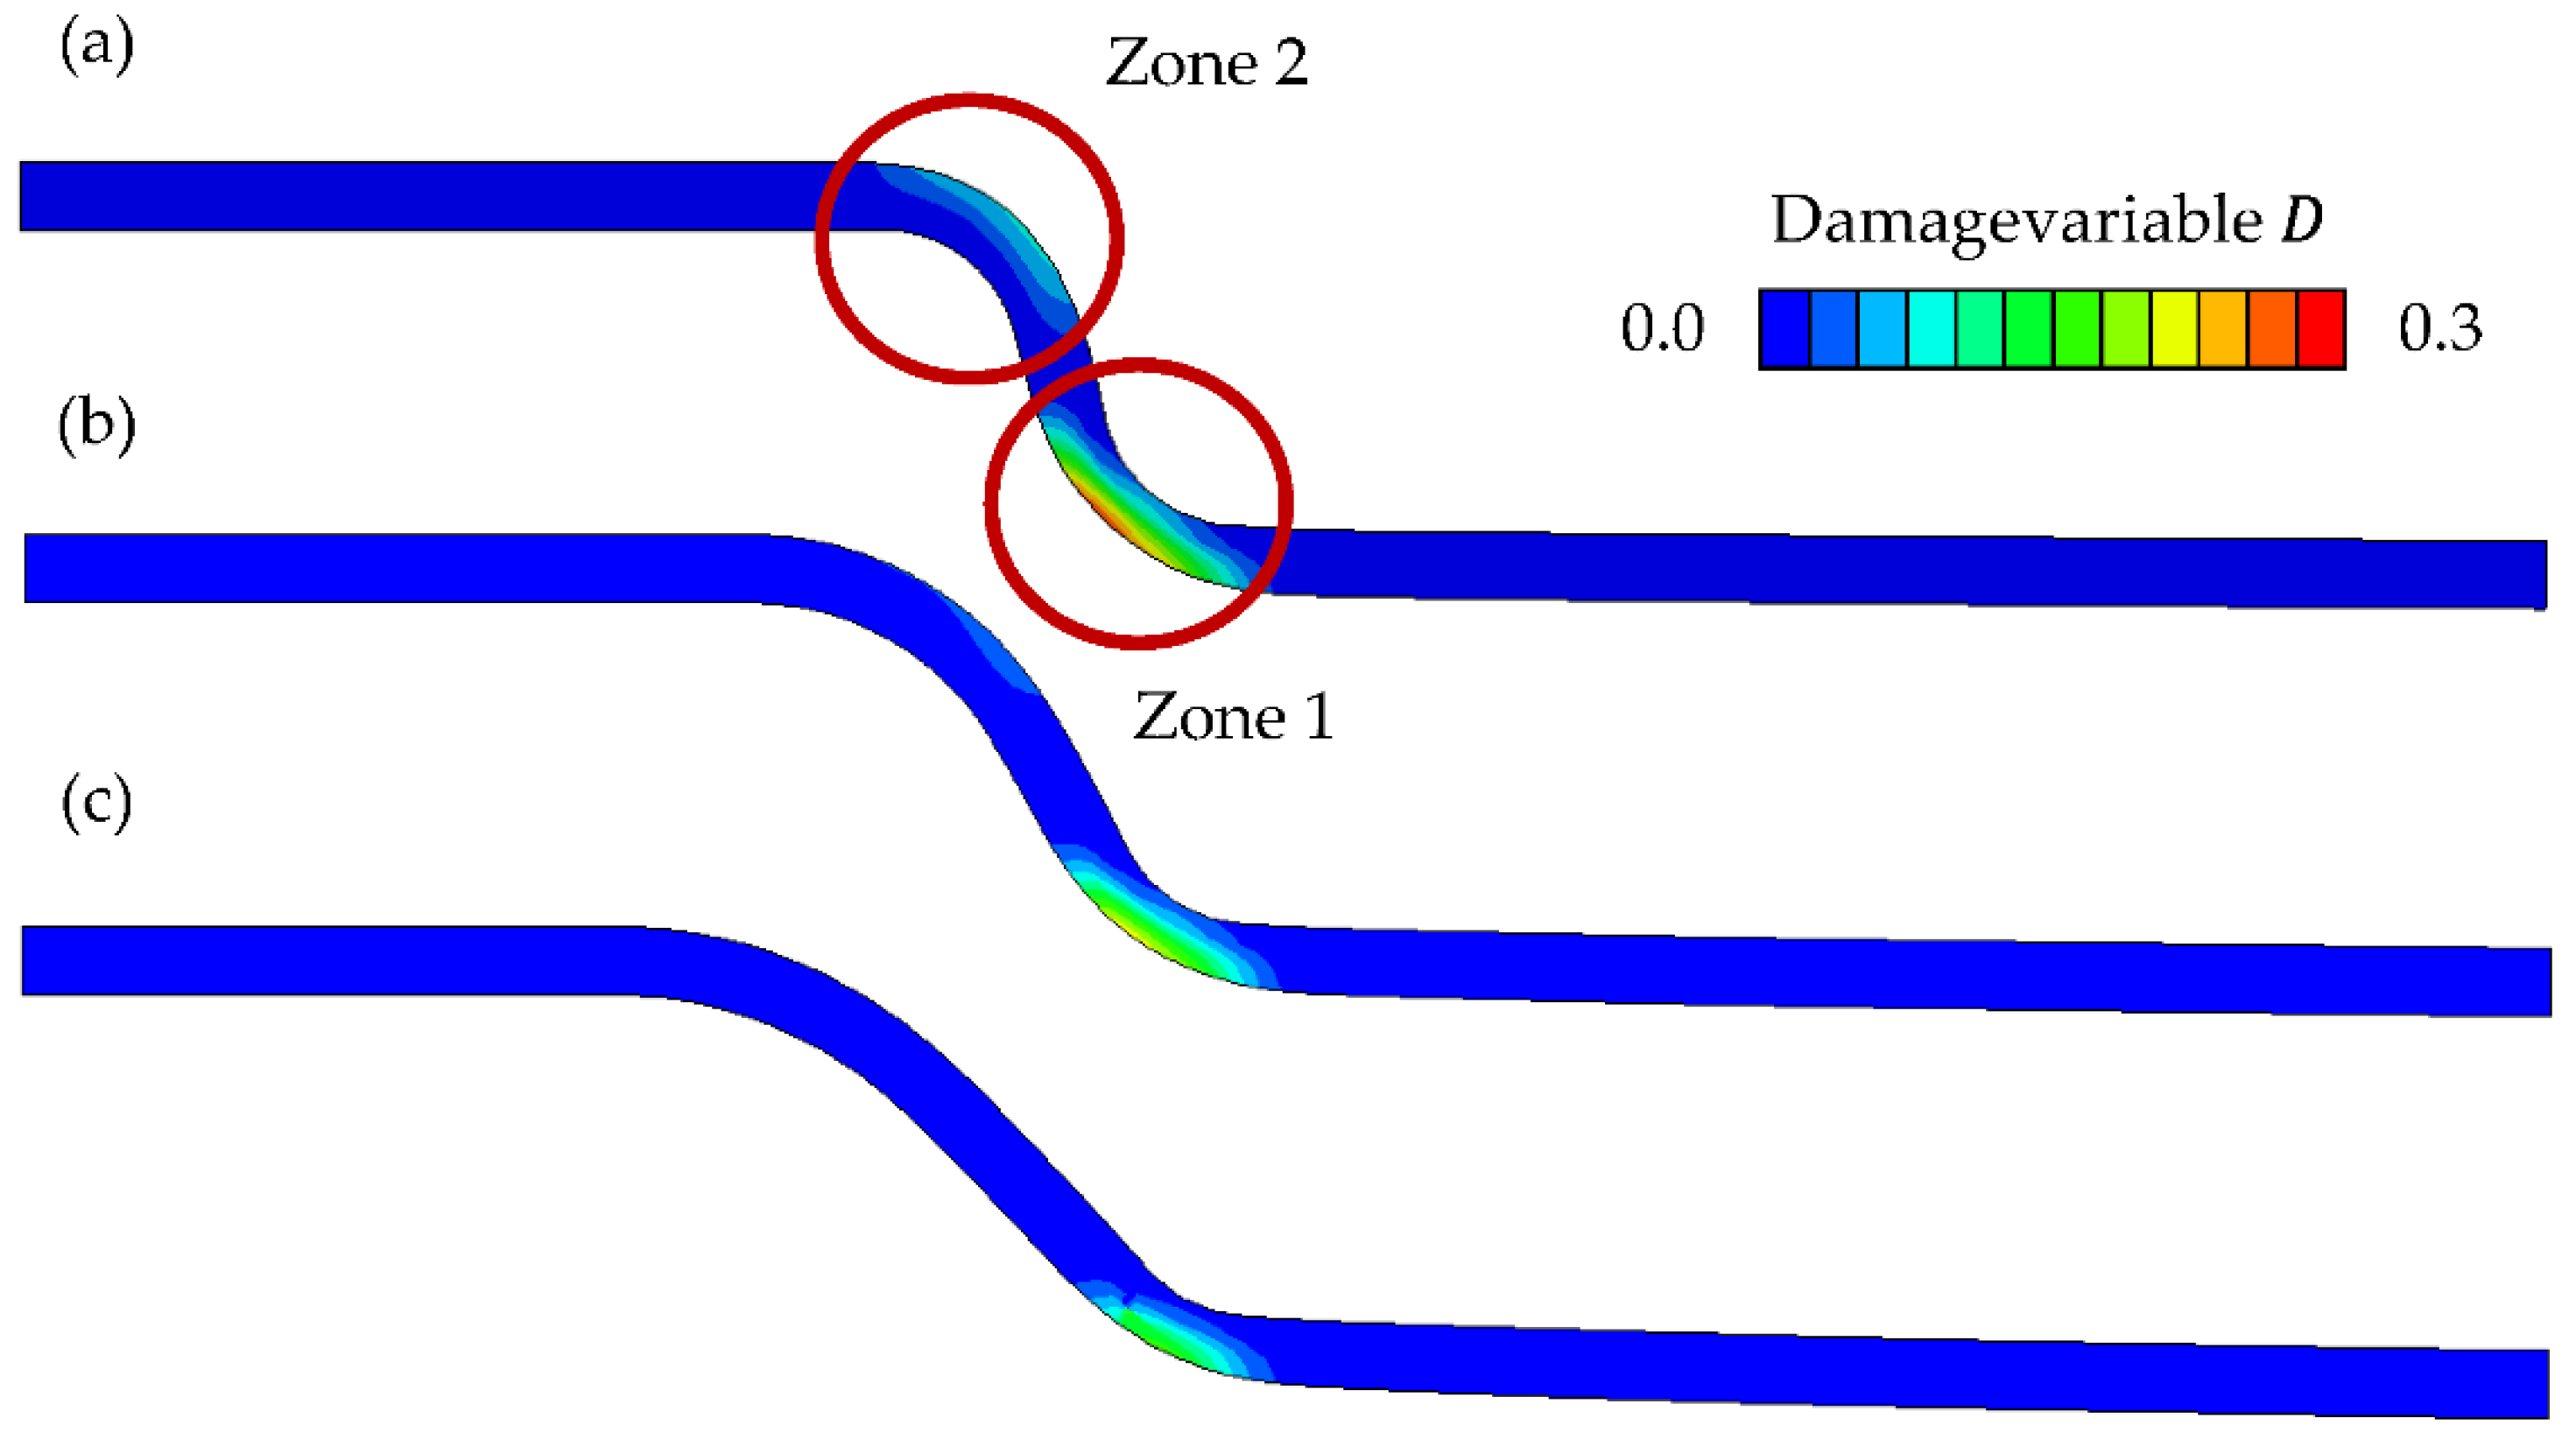
3.2. Influence of Process Set-Up on Damage Evolution

Figure 4 shows the results for the variation of the process set-up and its influence on damage evolution in form of the damage variable D. As in Figure 2, the damage variable was zero in the critical area of the component, the edge, since no plastic deformation and thus no damage evolution occurred in this area in the first step (Figure 3). Starting from a punch path of s = 2 mm, the three curves started to increase following an approximate linear progression. From a punch path of s = 4 mm, all three curves showed a quadratic growth.
While the damage variables of single-step and multi-step deep drawing displayed a comparable progression, the progression of the damage variable of reverse deep drawing showed a minor increase. After reaching a punch path of s = 8 mm the curves of single-step and multi-step deep drawing diverged. The damage variables then achieved D Multi step = 0.19, D Sin gle step = 0.16, and D Reverse = 0.088 at the selected reference position of s = 9 mm.
The damage distribution of the damage variable D in the cross section of the edge of the parts can be seen in Figure 5. For each component, a damage evolution was apparent from the floor to the wall in zone 1. The thinning in this area was especially distinct at multistep deep drawing and damage evolution could be found throughout the sheet thickness. Zone 2 damage evolution was visible in all components. The distribution was very similar considering the maximum value and the distribution. The change in drawing die radius r ddr the shape of the components was different due to the restricted punch path. However, the cup depth and verticality of the wall were equal for each component.

4. Discussion

4.1. Influence of Process Parameter on Damage Evolution

At the beginning of the deep drawing process, the material initially flowed out of the sheet thickness. A forced thinning of the sheet occurred due to volume constancy. The thinning took place as a function of the radius ratio of punch and die and tended to occur where the smaller radius was present, as is mentioned in ref. [19] and as can be seen in Figure 2. Since sheet thinning was accompanied by plastic deformation, it is assumed that the damage distribution was influenced by the radius ratio of punch and die. As the drawing die radius ( r ddr r punch ) decreased, the thinning tended to take place in zone 2, thus leading to damage evolution in this area as a result of higher plastic deformation. In case of greater drawing die radii ( r ddr > r punch ), however, the damage area was restricted to the area towards the bottom in zone 1. Moreover, with a smaller drawing die radius ( r ddr r punch ), the area affected by damage in zone 1 was larger and had an orientation from the transition of the bottom to the wall. Due to the smaller drawing die radius r ddr , the bending radius was smaller in zone 1 since the cup wall had a less vertical shape with increasing the drawing die radii r ddr due to the restricted punch path. This led to a greater plastic deformation, thus advancing damage evolution in a greater area. In case of larger drawing die radii ( r ddr > r punch ), however, the damage area was restricted to the area towards the bottom.
Considering the correlation between the drawing ring radius and the maximum damage variable D, there was a clear decrease in the damage variable D with increasing drawing ring radius at the selected reference position. This seems to be due to the smaller bending radius, which is associated with a smaller drawing ring r ddr radius as can be seen in Figure 2. Furthermore, the required punch forces decreased with smaller bending radius, partially due to the lower flow resistance over the drawing ring and the smaller bending radius itself. As a result, the tensile stresses that dominate from the transition of the bottom towards the wall of the part were reduced. Conversely, the damage that occurred in conjunction with tensile stresses was supposably smaller.

4.2. Influence of Process Set-Up on Damage Evolution

The courses of the damage variable D of single-step and multi-step deep drawing showed a similar behavior relative with the course of the damage variable D of reverse deep drawing. Potential reasons for this include the different process forces. The blankholder forces differed for the three process variants. For reverse deep drawing, the blankholder force was significantly lower than for the other two variants. Due to the lower necessary blankholder force required to prevent wrinkling, there was a lower contact normal stress. This led to lower friction, which in turn reduced the flow resistance over the drawing ring. As a result, lower tensile stresses occurred in the area of the transition from the bottom to the wall as well as along the wall. The lower tensile stresses seemed to then lead to less damage and less sheet thinning at the reference point for reverse deep drawing.

5. Conclusions and Outlook

Three process variants of the deep drawing process of rectangular cups and their influence on damage evolution were investigated, including single-step deep drawing, two-step deep drawing, and reverse deep drawing as well as different drawing die radii r ddr . The different processes were modeled using FE (Finite element)-simulation with an extended Lemaitre damage model. Comparing different drawing die radii r ddr , damage evolution was less apparent with an increasing drawing die radius r ddr . The maximum value of the damage variable D at the reference point was obtained by r ddr = 3 mm, while the lowest was achieved by r ddr = 9 mm. Considering different process set-ups, the lowest damage variable D at the reference point was observed for reverse deep drawing. The highest damage variable D was attained by multi-step deep drawing.
In order to complement the numerical investigation described in this article, experiments have to be carried out with the same tool geometries and process settings to validate the simulation models. However, this study offers the possibility of designing the tools that will allow the future validation of the simulations. In addition, the influence of the preliminary process, such as cold rolling, should be taken into account, considering its impact on the damage evolution, to be able to take the next step to improve component performance in terms of fatigue and crash behavior such that lighter components can be designed while maintaining the same load capacity.

Author Contributions

Conceptualization, M.M.; methodology, M.M.; validation, formal analysis, M.M., I.F.W., T.H. and T.B.; investigation, M.M.; resources, T.H. and T.B.; data curation, M.M.; writing—original draft preparation, M.M., I.F.W., T.H. and T.B.; writing—review and editing, M.M., I.F.W., T.H. and T.B.; visualization, T.H. and T.B.; supervision, T.H. and T.B.; project administration, T.H. and T.B.; funding acquisition, T.B. All authors have read and agreed to the published version of the manuscript.

Funding

This research was funded by Deutsche Forschungsgemeinschaft (DFG, German Research Foundation; Projectnumber 78868966–TRR 188).

Institutional Review Board Statement

Not applicable.

Informed Consent Statement

Not applicable.

Data Availability Statement

Not applicable.

Acknowledgments

The authors would like to thank A. Erman Tekkaya, Till Clausmeyer, and Alexander Schowtjak from the Institute of Forming Technology and Lightweight Components of TU Dortmund, subproject S01 of TRR 188, for the usage of their implementation of the LEMAITRE damage model. Simulations were performed with computing resources granted by RWTH Aachen University under project rwth0907.

Conflicts of Interest

The authors declare no conflict of interest.

References

  1. National or EU-Wide Inclusion of Further Sectors in the European Emissions Trading Scheme; Scientific Services of the German Federal Parliament: Berlin, Germany, 2018.
  2. European Commission. A European Green Deal; European Commission: Brussels, Belgium, 2019. [Google Scholar]
  3. Kim, H.J.; McMillan, C.; Keoleian, G.A.; Skerlos, S.J. Greenhouse Gas Emissions Payback for Lightweighted Vehicles Using Aluminum and High-Strength Steel. J. Ind. Ecol. 2010, 14, 929–946. [Google Scholar] [CrossRef]
  4. Birat, J.P. Life-cycle assessment, resource efficiency and recycling. Metall. Res. Technol. 2015, 112, 206–212. [Google Scholar] [CrossRef]
  5. Klocke, F. Manufacturing Processes 4. Forming, 1st ed.; Springer: Berlin/Heidelberg, Germany, 2013. [Google Scholar]
  6. Hirt, G.; Tekkaya, E.; Clausmeyer, T.; Lohmar, J. Potential and status of damage controlled forming processes. Prod. Eng. 2020, 14, 1–4. [Google Scholar] [CrossRef] [Green Version]
  7. Nick, M.; Liebsch, C.; Müller, M.; Weiser, I.F.; Hirt, G.; Bergs, T. Influence of pass reduction in cold rolling on damage evolution in deep drawing of rotationally symmetric cups. IOP Conf. Ser. Mater. Sci. Eng. 2021, 1157, 012050. [Google Scholar] [CrossRef]
  8. Besson, J.J. Continuum Models of Ductile Fracture: A Review. Int. J. Damage Mech. 2010, 19, 3–52. [Google Scholar] [CrossRef] [Green Version]
  9. Tasan, C.; Hoefnagels, J.; Geers, M. Identification of the continuum damage parameter: An experimental challenge in modeling damage evolution. Acta Mater. 2012, 60, 3581–3589. [Google Scholar] [CrossRef] [Green Version]
  10. Cockcroft, M.G.; Latham, D. A Simple Criterion of Fracture for Ductile Metals; National Engineering Laboratory: East Kilbride, UK, 1966. [Google Scholar]
  11. Wierzbicki, T.; Bao, Y.; Lee, Y.W.; Bai, Y. Calibration and evaluation of seven fracture models. Int. J. Mech. Sci. 2005, 47, 719–743. [Google Scholar] [CrossRef]
  12. Gurson, A.L. Continuum Theory of Ductile Rupture by Void Nucleation and Growth: Part I—Yield Criteria and Flow Rules for Porous Ductile Media. J. Eng. Mater. Technol. 1977, 99, 2–15. [Google Scholar] [CrossRef]
  13. Needleman, A.; Tvergaard, V. An analysis of ductile rupture modes at a crack tip. J. Mech. Phys. Solids 1987, 35, 151–183. [Google Scholar] [CrossRef]
  14. Lemaitre, J. A Continuous Damage Mechanics Model for Ductile Fracture. J. Eng. Mater. Technol. 1985, 107, 83–89. [Google Scholar] [CrossRef]
  15. Lian, J.; Feng, Y.; Münstermann, S. A Modified Lemaitre Damage Model Phenomenologically Accounting for the Lode Angle Effect on Ductile Fracture. Procedia Mater. Sci. 2014, 3, 1841–1847. [Google Scholar] [CrossRef] [Green Version]
  16. Kachanov, L.M. Introduction to Continuum Damage Mechanics, 1st ed.; Springer: Dordrecht, The Netherlands, 1986. [Google Scholar]
  17. Soner, M. Schädigungsmechanische Charakterisierung Kunststoffvergossener Bauteile; RWTH-Aachen University: Aachen, Germany, 2004. [Google Scholar]
  18. Cao, T.S. Models for ductile damage and fracture prediction in cold bulk metal forming processes: A review. Int. J. Mater. Form. 2017, 10, 139–171. [Google Scholar] [CrossRef]
  19. Doege, E.; Behrens, B.A. Handbuch Umformtechnik. Grundlagen, Technologien, Maschinen, 3rd ed.; Springer Berlin Heidelberg: Berlin/Heidelberg, Germany, 2018. [Google Scholar]
  20. Tiware, P.; Rathore, A.; Bodkhe, M. Factors affecting the deep drawing process. Mater. Today: Proc. 2022, 56, 2902–2908. [Google Scholar] [CrossRef]
  21. Dal, S.; Darendeliler, H. Analysis of Side-Wall Wrinkling in Deep Drawing Processes. Key Eng. Mater. 2022, 926, 732–743. [Google Scholar] [CrossRef]
  22. Chen, K.; Carter, A.; Korkolis, Y. Flange Wrinkling in Deep-Drawing: Experiments, Simulations and a Reduced-Order Model. J. Manuf. Mater. Process. 2022, 6, 76. [Google Scholar] [CrossRef]
  23. Preedawiphat, P.; Koowattanasuchat, N.; Mahayotsanun, N.; Mahabunphachai, S. Sheet thinning prediction method based on localized friction effect in deep-drawing. Adv. Mech. Eng. 2020, 12, 1–10. [Google Scholar] [CrossRef]
  24. Urmaz, U.; Heibel, S.; Schweiker, A.; Prabhakar, A.; Merklein, M. Influence of the forming process on springback. IOP Conf. Ser. Mater. Sci. Eng. 2022, 1238, 012074. [Google Scholar] [CrossRef]
  25. Nanu, N.; Brabie, G. Analytical model for prediction of springback parameters in the case of U stretch–bending process as a function of stresses distribution in the sheet thickness. Int. J. Mech. Sci. 2012, 64, 11–21. [Google Scholar] [CrossRef]
  26. Fan, J.; Tang, Y.; Tsui, C.; Chan, L.; Lee, T. 3D finite element simulation of deep drawing with damage development. Int. J. Mach. Tools Manuf. 2006, 46, 1035–1044. [Google Scholar] [CrossRef]
  27. Kami, A.; Dariani, A.; Sadough Vanini, S.; Comsa, D.; Banabic, D. Application of a GTN Damage Model to Predict the Fracture of Metallic Sheets Subjected to Deep-Drawing. Proc. Rom. Acad.-Ser. A Math. Phys. Tech. Sci. Inf. Sci. 2014, 15, 300–309. [Google Scholar]
  28. Barrera, C.; Garcia-Herrara, C.; Celentano, D.; Signorelli, J. Material and Damage Characterization of the Elastoplastic Response of the EK4 Deep Drawing Steel. Metals 2022, 12, 720. [Google Scholar] [CrossRef]
  29. Saxena, R.; Dixit, P. Numerical analysis of damage for prediction of fracture initiation in deep drawing. Finite Elem. Anal. Des. 2011, 47, 1104–1117. [Google Scholar] [CrossRef]
  30. Nick, M.; Müller, M.; Voigts, H.; Weiser, I.F.; Herrig, T.; Bergs, T. Effect of Friction Modelling on Damage Prediction in Deep Drawing Simulations of Rotationally Symmetric Cups. Defect Diffus. Forum 2022, 414, 103–109. [Google Scholar] [CrossRef]
  31. Bergs, T.; Nick, M.; Trauth, D.; Klocke, F. Damage Evolution in Nakajima Tests of DP800 Dual Phase Steel. In Proceedings of the International Deep Drawing Research Group 37th Annual Conference, Waterloo, ON, Canada, 3–7 June 2018. [Google Scholar]
  32. Nick, M.; Feuerhack, A.; Bergs, T.; Clausmeyer, T. Numerical Investigation of Damage in Single-step, Two-step, and Reverse Deep Drawing of Rotationally Symmetric Cups from DP800 Dual Phase Steel. Procedia Manuf. 2020, 47, 636–642. [Google Scholar] [CrossRef]
  33. Numpon, M.; Sasawat, M. Tearing defect maps for the deep drawing of AISI 304 rectangular cups. Mater. Test. 2020, 62, 769–774. [Google Scholar]
  34. Soyarslan, C.; Tekkaya, A.E. Finite deformation plasticity coupled with isotropic damage: Formulation in principal axes and applications. Finite Elem. Anal. Des. 2010, 46, 668–683. [Google Scholar] [CrossRef]
Figure 1. Tools for the process variants: (a) reverse deep drawing; (b) multi-step deep drawing; (c) single-step deep drawing; PU—punch; BH—blank holder; DD—drawing die.
Engproc 26 00006 g001
Figure 2. Course of damage variable D for drawing die radius r ddr = (3, 6, 9).
Engproc 26 00006 g002
Figure 3. Distribution of damage variable D: (a) drawing ring radius r ddr = 3 mm; (b) drawing ring radius r ddr = 6 mm; (c) drawing ring radius r ddr = 9 mm.
Engproc 26 00006 g003
Figure 4. Course of damage variable D of single-step, multi-step, and reverse deep drawing.
Engproc 26 00006 g004
Figure 5. Distribution of damage variable D: (a) single-step; (b) multi-step; (c) reverse deep drawing.
Engproc 26 00006 g005
Publisher’s Note: MDPI stays neutral with regard to jurisdictional claims in published maps and institutional affiliations.

