Proceeding Paper

Evaluation of Feature Selection Techniques in a Multifrequency Large Amplitude Pulse Voltammetric Electronic Tongue †

by
Luis F. Villamil-Cubillos
1,
Jersson X. Leon-Medina
1,*,
Maribel Anaya
2 and
Diego A. Tibaduiza
3
1
Departamento de Ingeniería Mecánica y Mecatrónica, Universidad Nacional de Colombia, Cra 45 No. 26-85, Bogotá 111321, Colombia
2
MEM (Modelling-Electronics and Monitoring Research Group), Faculty of Electronics Engineering, Universidad Santo Tomás, Bogotá 110231, Colombia
3
Departamento de Ingeniería Eléctrica y Electrónica, Universidad Nacional de Colombia, Cra 45 No. 26-85, Bogotá 111321, Colombia
*
Author to whom correspondence should be addressed.
Presented at the 7th Electronic Conference on Sensors and Applications, 15–30 November 2020; Available online: https://ecsa-7.sciforum.net/.
Eng. Proc. 2020, 2(1), 62; https://doi.org/10.3390/ecsa-7-08242
Published: 14 November 2020
(This article belongs to the Proceedings of 7th International Electronic Conference on Sensors and Applications)

Abstract

:
An electronic tongue is a device composed of a sensor array that takes advantage of the cross sensitivity property of several sensors to perform classification and quantification in liquid substances. In practice, electronic tongues generate a large amount of information that needs to be correctly analyzed, to define which interactions and features are more relevant to distinguish one substance from another. This work focuses on implementing and validating feature selection methodologies in the liquid classification process of a multifrequency large amplitude pulse voltammetric (MLAPV) electronic tongue. Multi-layer perceptron neural network (MLP NN) and support vector machine (SVM) were used as supervised machine learning classifiers. Different feature selection techniques were used, such as Variance filter, ANOVA F-value, Recursive Feature Elimination and model-based selection. Both 5-fold Cross validation and GridSearchCV were used in order to evaluate the performance of the feature selection methodology by testing various configurations and determining the best one. The methodology was validated in an imbalanced MLAPV electronic tongue dataset of 13 different liquid substances, reaching a 93.85% of classification accuracy.

1. Introduction

Electronic tongues are bio-inspired devices that seek to resemble the bodily sense of taste, using an array of sensors of various specifications that interact with a fluid and respond differently to each substance, allowing their identification and quantification [1,2]. This type of instrument has uses in many areas, being used for the electrochemical analysis of substances in liquid state, where the presence of some components in the fluid can be determined, as well as the identification of the same as a set, for example differentiating several aqueous matrices [3]. This opens doors to endless applications that can be interesting in the food industry, such as guaranteeing the same taste in all the products of a production chain or standardizing a variety of wine [4].
To use these analysis systems, it is necessary to put the sensor arrangement in contact with the fluid to be studied and the data are collected, however, when carrying out the experiments, large amounts of data are produced and the feature vectors often have redundant features or very poor information for classification, this is when the most representative ones must be chosen from a group of features to improve the processing time and accuracy of results [5].
This work focuses on the implementation and validation of several features selection techniques in the liquid classification process of an array of sensors type in a multifrecuency large amplitude pulse voltammetry (MLAPV) electronic tongue, on which in addition an adjustment of hyper-parameters is carried out using tools such as gridsearchCV together with 5-fold cross validation, to select the model that grants the highest possible accuracy and allows a higher response speed later by selecting a much smaller amount of features than the initial arrangement. All this using Linear SVC and MLPC as classifiers. This research uses a dataset obtained by Zhang et al. [6] in 2018 using an array of MLAVP electronic tongue sensors to classify 13 different substances, which achieved 98% accuracy using a feature extraction approach with extreme learning machine as classifier and 5-fold cross validation. The remainder of this work is organized as follows: the first section describes the introduction. Afterwards, the second section depicts a theoretical background showing the principal concepts. Following, in the third section, the materials and methods section defines the data set of a MLAPV electronic tongue used in this study as well as the methods of feature selection to process the data. Then, the fourth section presents the results after applying the developed methodology. Finally, the conclusion section outlines the principal findings of this research.

2. Materials and Methods

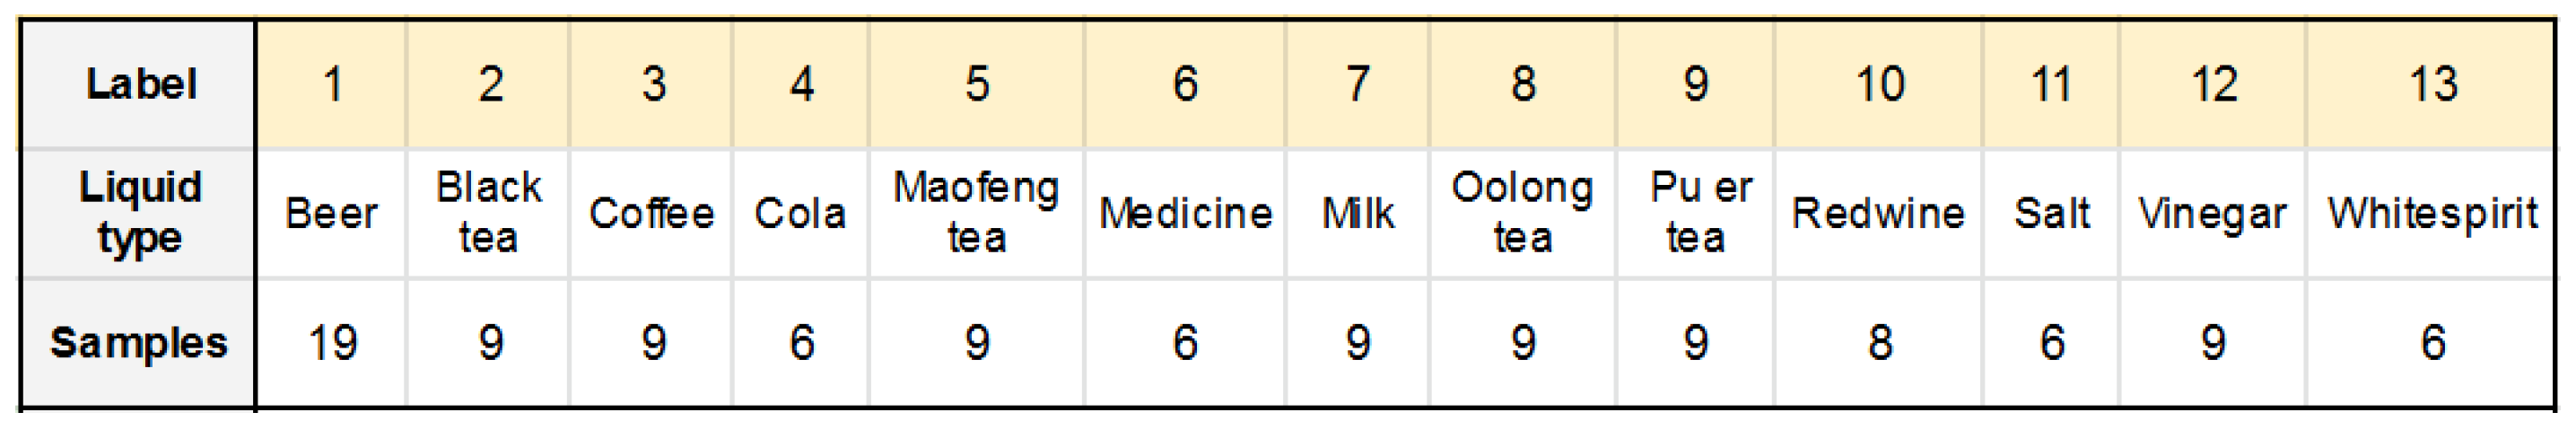
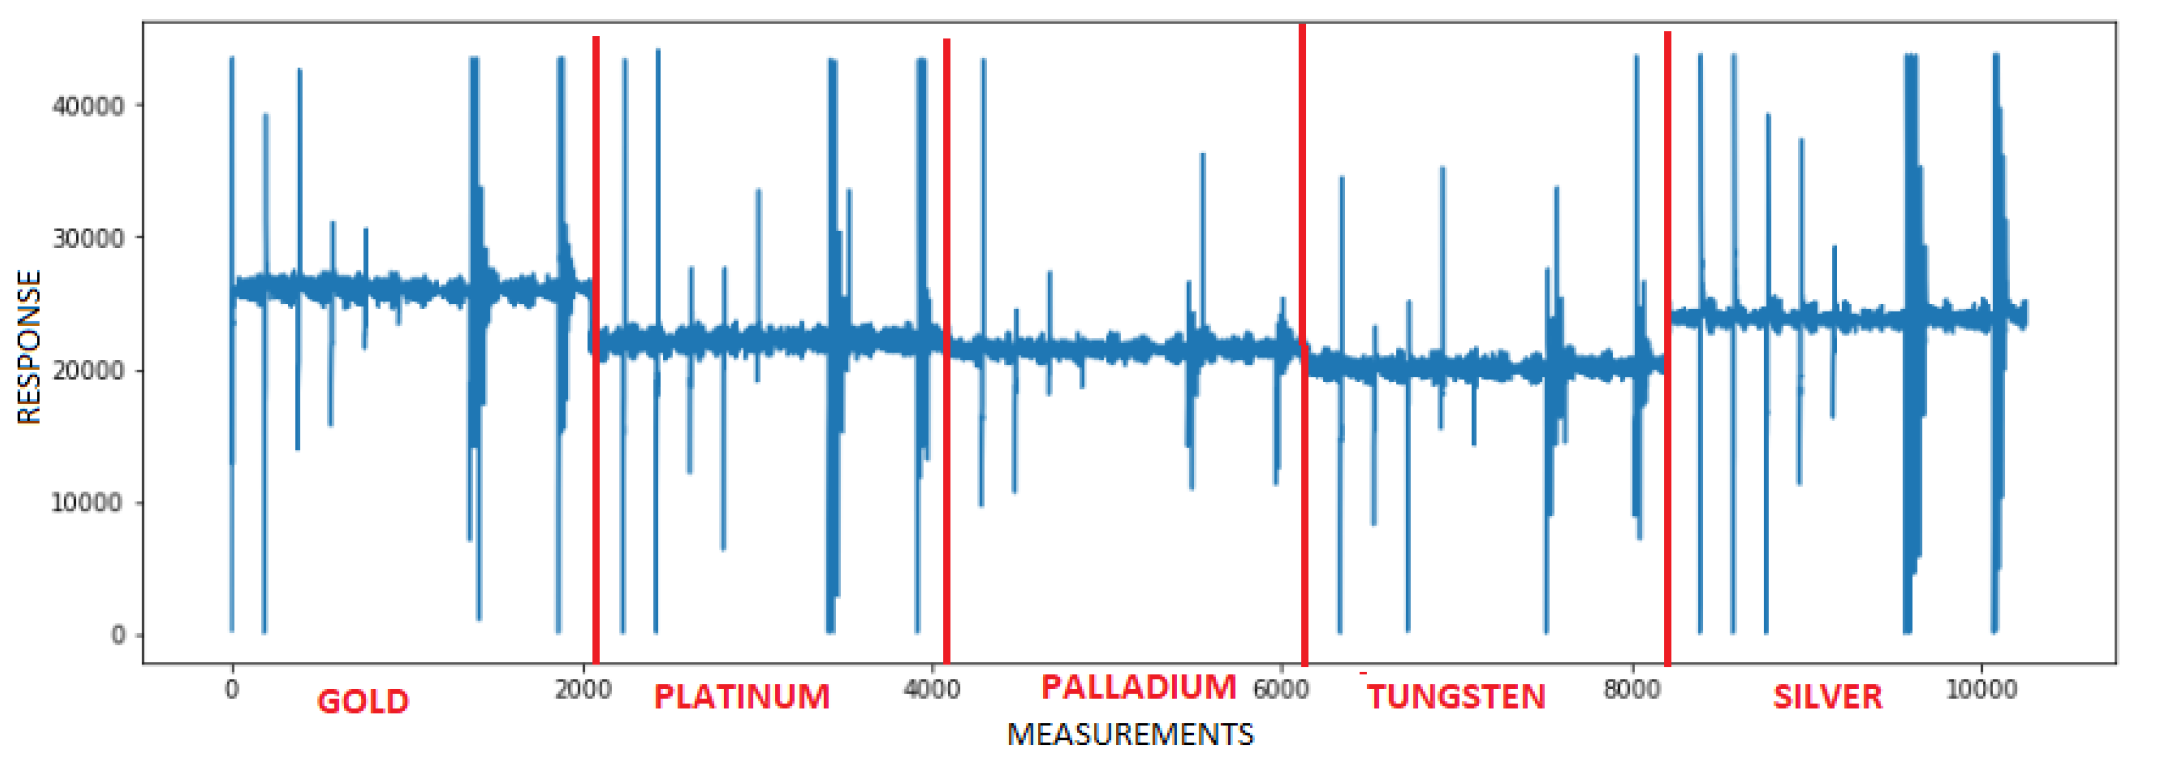
2.1. MLAPV Electronic Tongue Dataset

In this work, a data set of a MLAPV electronic tongue obtained by Zhang et al. [6] in 2018 is used. This seeks to classify 13 different substances. The system uses a group of 5 working electrodes (gold, platinum, palladium, tungsten and silver), an Ag/AgCl reference electrode and an auxiliary or counter electrode made of platinum. The data set obtained consists of 114 samples obtained from 13 liquid substances that are distributed as explained in Figure 1.
Each one of the 5 sensors delivers 2050 readings made during 12 s, in which pulse amplitudes of 4.10, 3.85, 3.60 and 3.35 V are applied at three different frequencies: first 1, then, 3 and finally, 5 Hz. Subsequently, these data are grouped into a matrix of 10,250 columns that will contain the information from the 5 sensors ordered one after another and 114 rows that represents the total samples. Then the data are scaled by group scaling method [3] taking into account the differences of the signals obtained by each electrode, as shown in Figure 2.

2.2. Feature Selection

The following methods implemented in the Scikit-learn [7] library were used.
  • Variance filter: It is used in order to examine each feature present in the data set and eliminate those least differentiating columns, that is, those that may be very common between classes. In this algorithm, the variance present is calculated between the samples for a certain feature. If this value turns out to be zero, it means that all the samples for that analyzed variable have the same value. In this sense, if the probability of obtaining a value is greater than 0.8, 0.9 or similar, this feature is eliminated because it is evidently a trait that will be present in several classes and most likely will not contribute to the classification.
  • ANOVA F-value: The ANOVA test is used to study the difference between the means of various data groups [8,9]. This test allows searching for a similarity between features. If the difference between means of two variables is very small, it is most likely that the difference between the data of both variables is also small, which makes them very similar.
  • Recursive Feature Elimination (RFE): It is an embedded type of feature selection, whose main objective is to reduce the dimension of the data by choosing a subgroup of variables with greater differentiating capacity [10]. An optimal subgroup for the classification is selected from the score given by the chosen estimator. To find this subgroup, successive trainings of the selected classifier are used. In each training, a score is given to the variables, so that after each iteration the weaker or less relevant variable or group of variables is eliminated. Finally, the last deleted variables turn out to be the most relevant [11].
  • Selection from model: Some classifiers have coded techniques of punctuation that are able to deliver the respective coefficients for each feature, after the construction of a model. These coefficients can be used to form a threshold, taking the more relevant ones according to specific estimator. This method takes the coefficients obtained and organized by importance in order to select a group N of optimal features.

2.3. Combined Methods

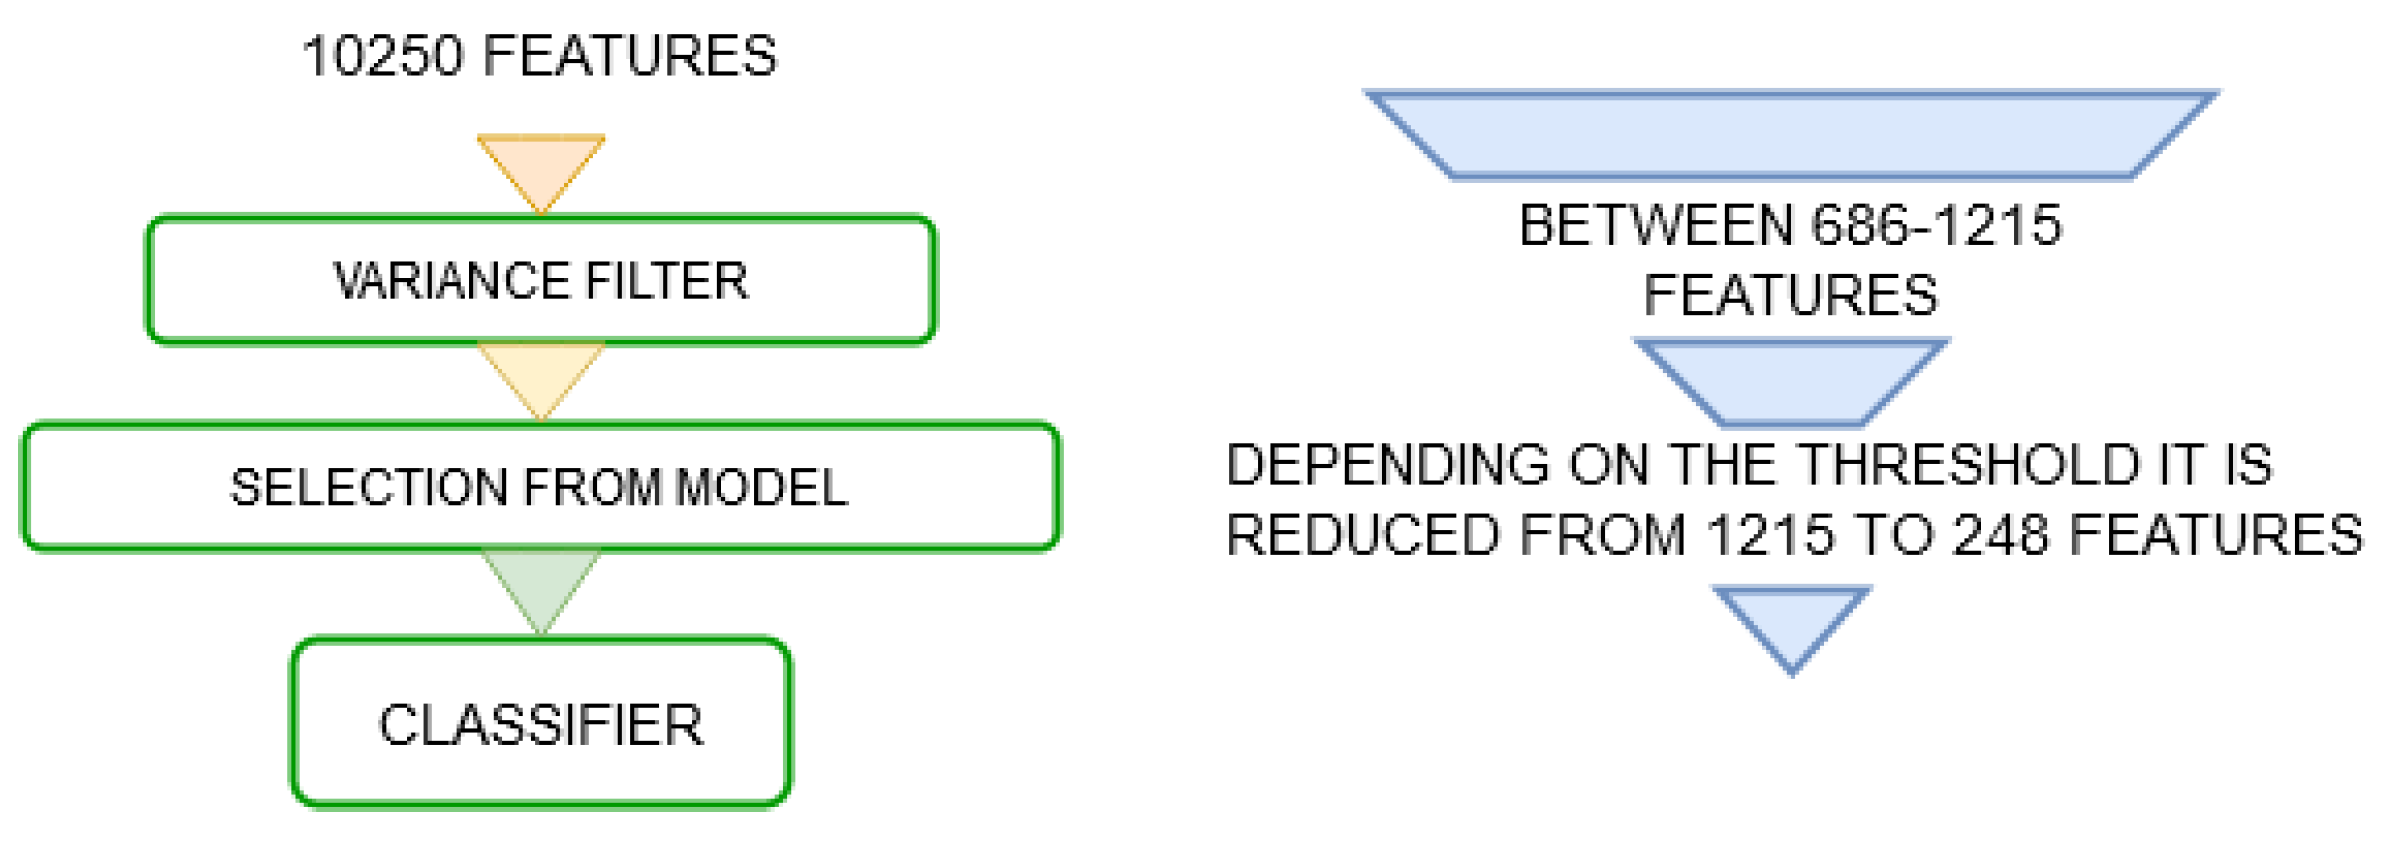
  • Combination between the variance filter and selection from model: A combined method is proposed. First, it uses a variance filter in order to eliminate features with the same value in almost all samples and reduce the size of the initial group. Then, it applies selection from the model in a more agile and effective way. This process is illustrated in Figure 3.
  • Combination between variance filter, ANOVA filter and selection from model: A similar technique to the previous one is proposed using another intermediate feature selection method, the ANOVA technique as shown in Figure 4.
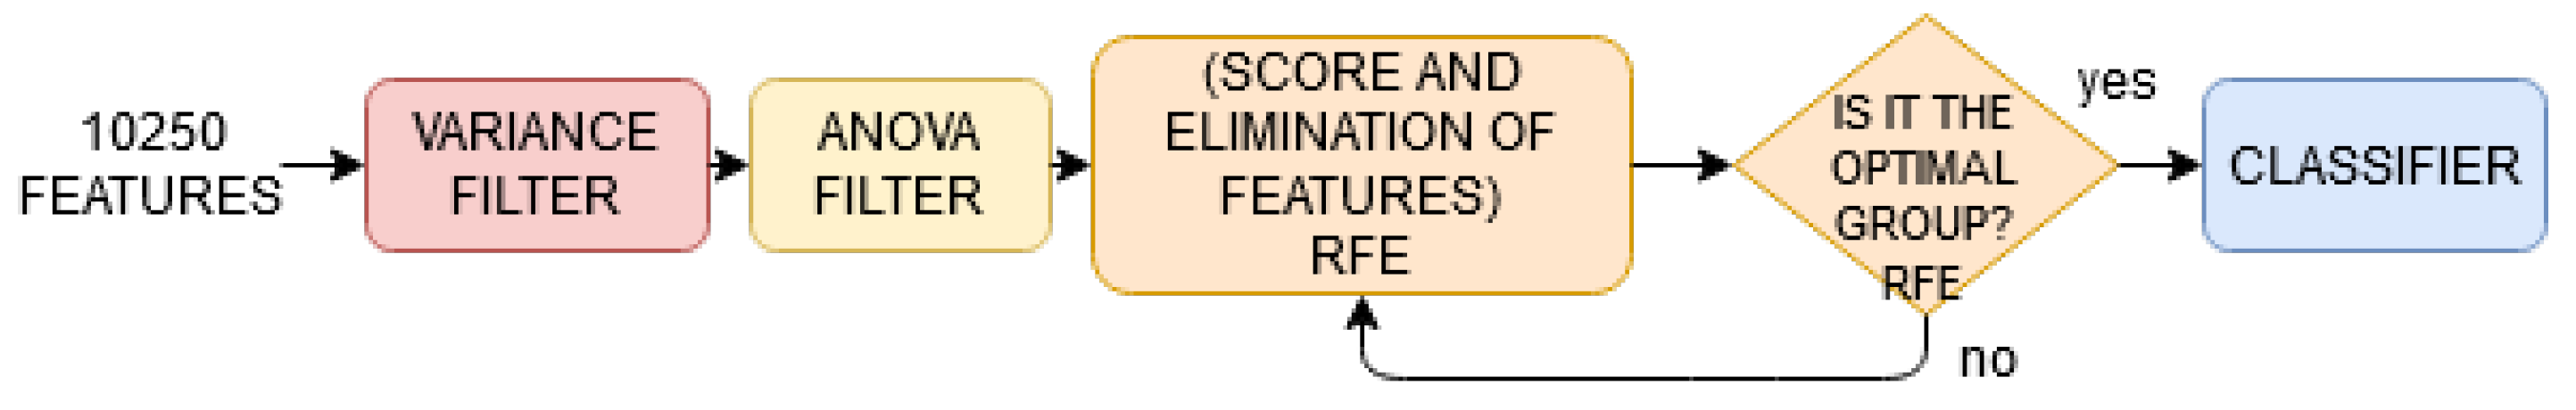
  • Combination between variance filter, ANOVA filter and RFE technique: In this case, the recursive RFE elimination method will be used after applying the variance and ANOVA filters as it is show in Figure 5. It is expected to reduce the number of features at the RFE input and in this way reduce the processing time and use a small step size, which can help to improve the final performance of the algorithm.

3. Results

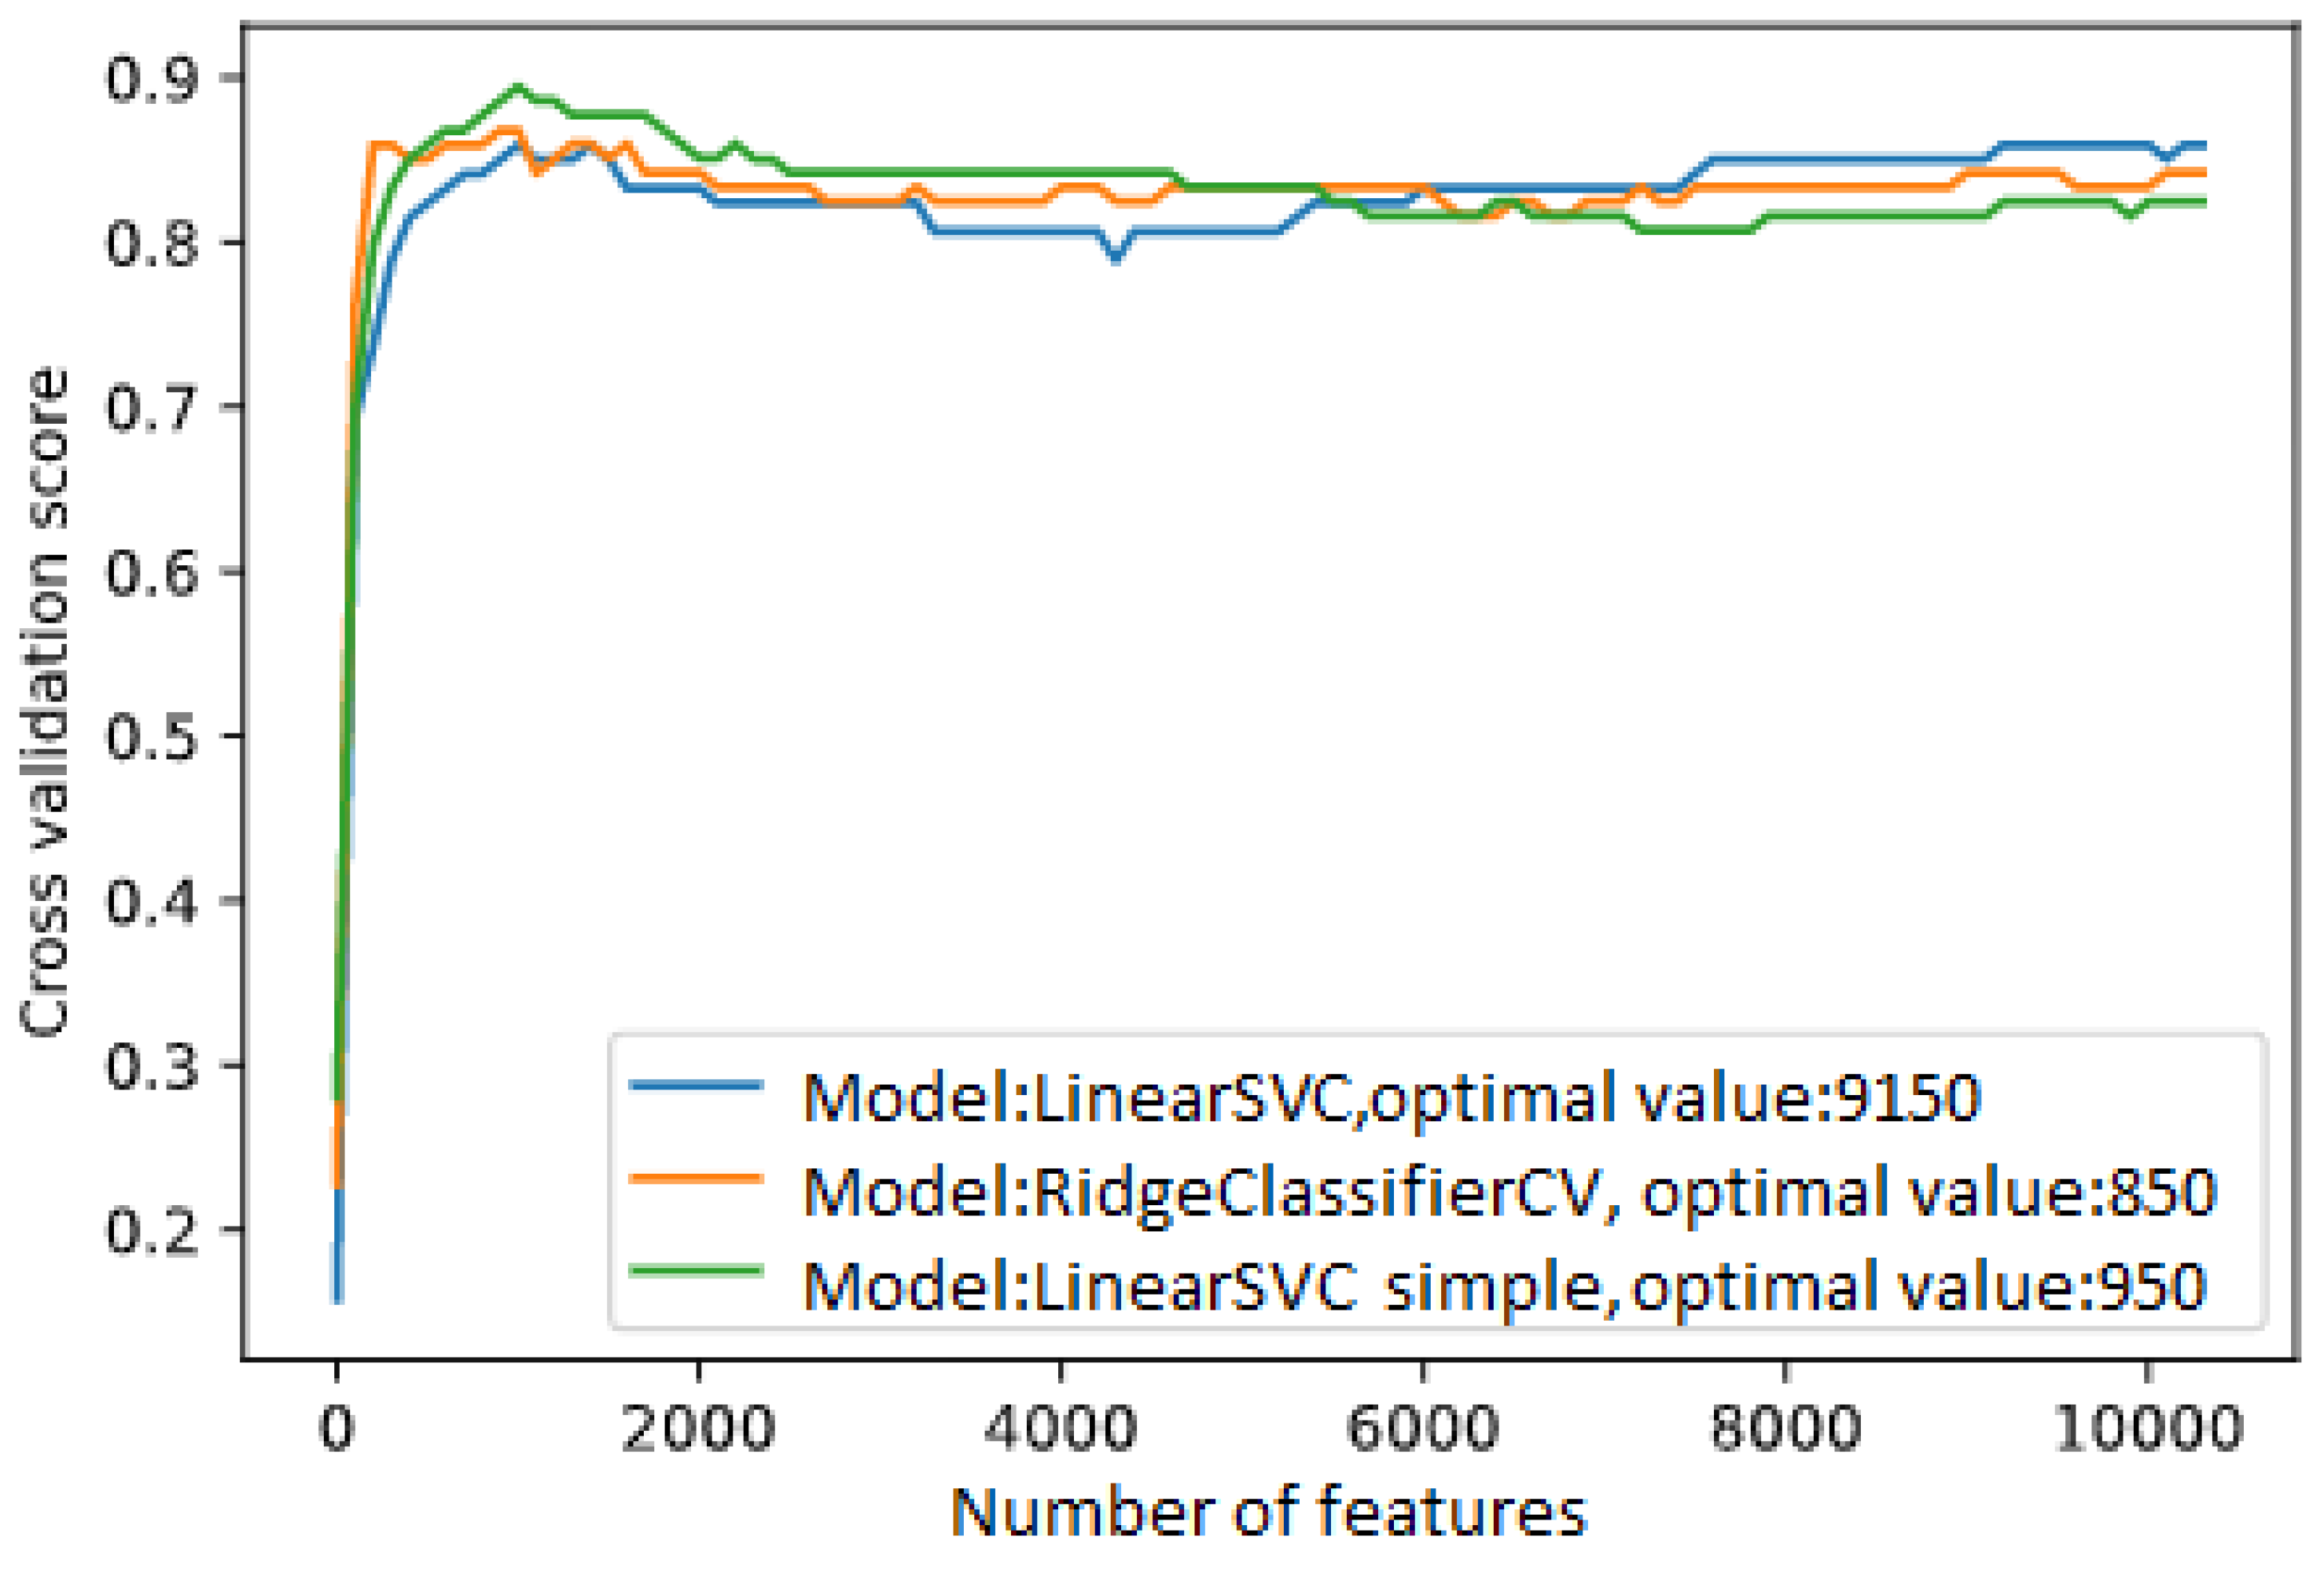
3.1. Combination between the Variance Filter and Selection from Model

A threshold of 0.0005 is used in the variance filter, which indicates that the features present in 99.95% of the instances are eliminated and the number of features is reduced to values close to 1000. Then, in the selection from the model, a logistic regression is used as an estimator due to the good performance shown in previous tests and the results are show in Table 1.

3.2. Combination between Variance Filter, ANOVA Filter and Selection from Model

A grid is defined to carry out the search for optimal parameters, using a variance filter with thresholds of 0.0001, 0.0005 and 0. Then, according to the ANOVA test, different numbers of features were used from 50 to 6200 with an average step of 200. Finally, evaluating thresholds was employed for the selection from the model from 0.1 to 0.8 with a step of 0.1 and the best results are despicted in Table 2. The Figure 6 shows the reduction in the number of features, according to the threshold used.

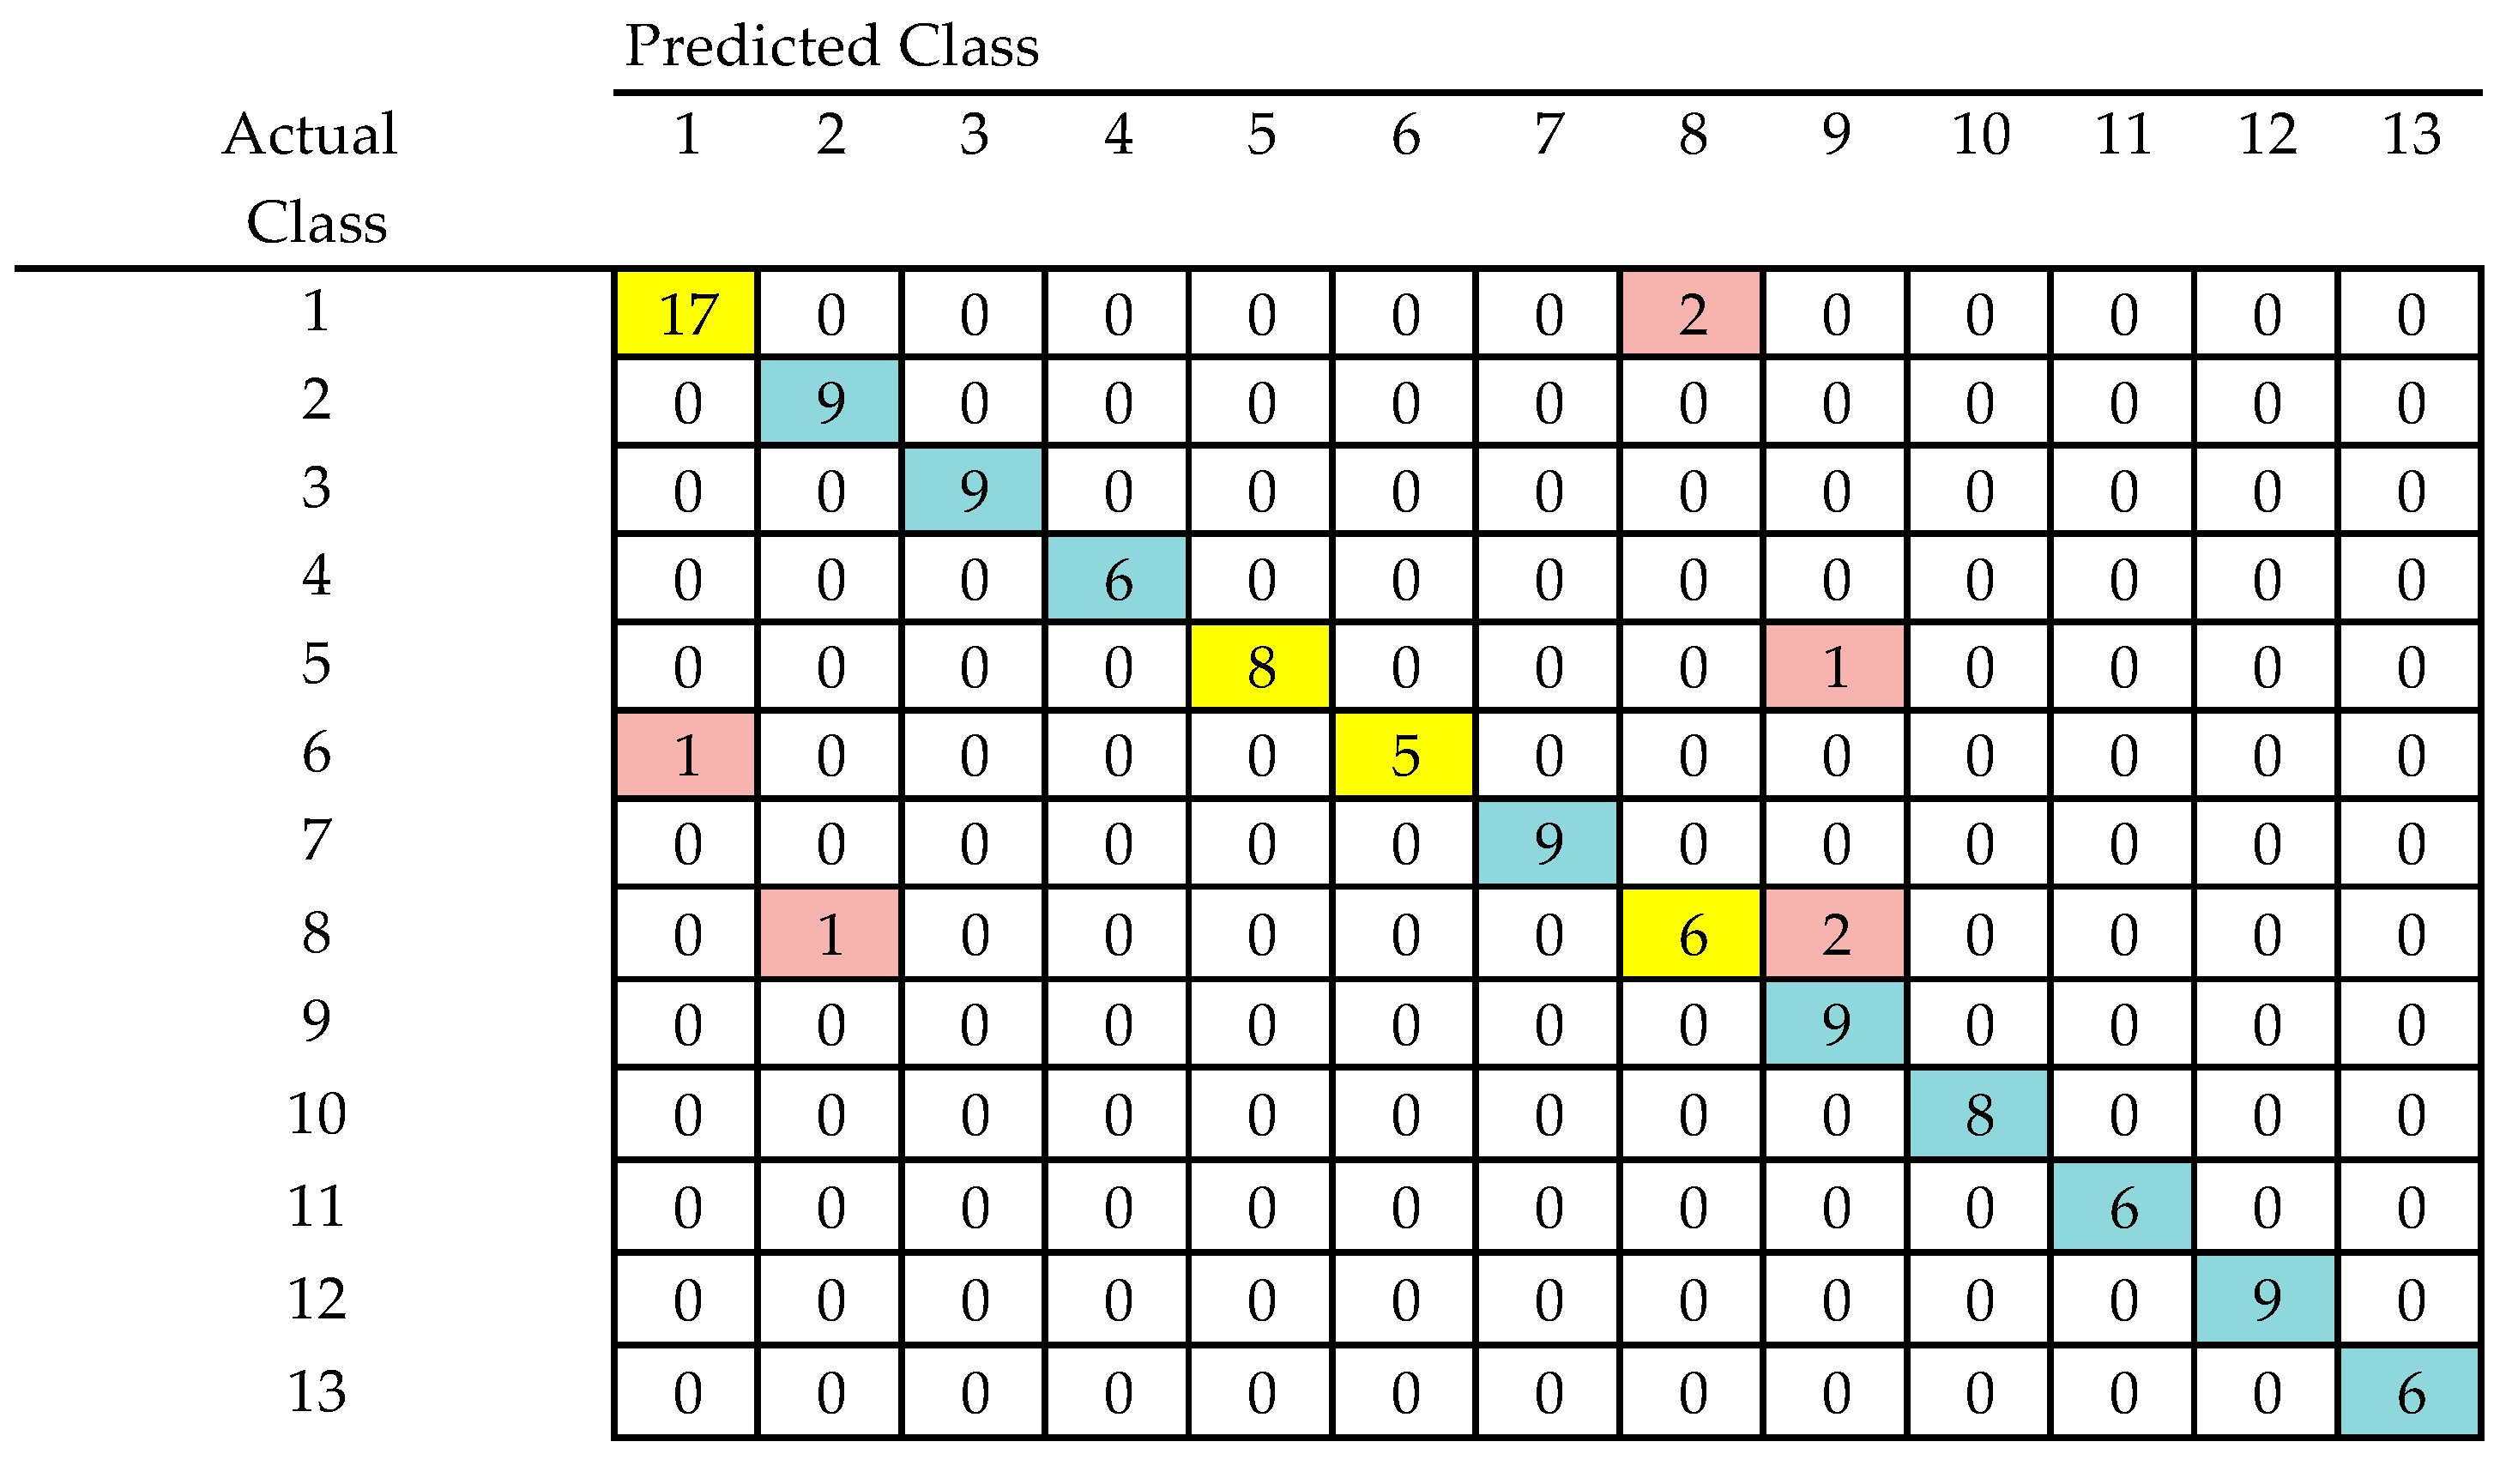
3.3. Combination between Variance Filter, ANOVA Filter and RFE Technique

The same range of test parameters is used as in the previous step for the variance filter and the ANOVA test. Then, RFE is applied with a logistic regression as estimator, and a step of 25 for MLPC and 20 for LinearSVC. The best results are show in Table 3. To choose the optimal number of features, a sweep is carried out combining RFE with CV, using a 100 features step, from 10,250 to 0, obtaining a behavior like the one show in Figure 7.

4. Discussion

After analyzing the results obtained, it can be seen that the application of the feature selection techniques increases the accuracy of the classification in most cases (initially 81.54% simply using the MLP classifier), as well as reducing the time of algorithm prediction by reducing the number of features in each test instance. Therefore, the two best results obtained were 93.86% using the RFE technique and MLP classifier (its resulting confusion matrix is illustrated in Figure 8) and 92.85% using combination between variance filter, ANOVA filter and selection from model with an MLP classifier. Although in the first case the accuracy is greater, the time required for the selection of features and training is almost 117 times greater, however, once the model is built, the prediction time is similar but it can be an important aspect to take into account in future implementations.

5. Conclusions

Feature selection is a very important and beneficial process when working with datasets where instances have many attributes. This stage of the pattern recognition strategy becomes a useful technique when analyzing data from sensors and especially sensor arrays since they generally contain a lot of information that is not relevant and that can decrease the accuracy of predictions. As observed in the work carried out, the use of this type of method is useful to analyze data from sensor arrays, achieving an increase in the accuracy of the classification of up to about 12%, in addition, machine learning models diminish their training and prediction time by reducing the number of features. Besides, it is noteworthy that the use of combined feature selection techniques can achieve high precision, achieve a faster model construction and become very stable, compared to the recursive feature elimination RFE method, which, although it is more precise, the last is slow to select the optimal set of features. Finally, it is good to point out that although the best results are obtained with MLP classifier, several iterations are necessary to obtain the best performance, since the definition of the weights of each feature changes after the construction of each model, therefore, the results vary. In a close range, and on the other hand it should be noted that in all cases to use these feature selection techniques it is very important to carry out a correct parameter tuning, since it will take full advantage of the methods used.

Author Contributions

All authors contributed to the development of this work, specifically their contribution is as follow: Conceptualization, J.X.L.-M., M.A. and D.A.T.; data organization and pre-processing, J.X.L.-M. and M.A.; methodology, L.F.V.-C. and J.X.L.-M.; validation, L.F.V.-C. and D.A.T. All authors have read and agreed to the published version of the manuscript.

Funding

The authors thank FONDO DE CIENCIA TECNOLOGÍA E INNOVACION FCTeI DEL SISTEMA GENERAL DE REGALÍAS SGR. The authors express their gratitude to the Administrative Department of Science, Technology and Innovation—Colciencias with the grant 779—“Convocatoria para la Formación de Capital Humano de Alto Nivel para el Departamento de Boyacá 2017” for sponsoring the research presented herein.

Acknowledgments

Jersson X. Leon-Medina is grateful with Colciencias and Gobernación de Boyacá for the PhD fellowship.

Conflicts of Interest

The authors declare no conflict of interest.

References

  1. Podrażka, M.; Baczynska, E.; Kundys, M.; Jeleń, P.S.; Nery, E.W. Electronic tongue—A tool for all tastes? Biosensors 2017, 8, 3. [Google Scholar] [CrossRef] [PubMed]
  2. Valle, M. Bioinspired sensor systems. Sensors 2011, 11, 10180–10186. [Google Scholar] [CrossRef] [PubMed]
  3. Leon-Medina, J.X.; Anaya, M.; Pozo, F.; Tibaduiza, D. Nonlinear Feature Extraction Through Manifold Learning in an Electronic Tongue Classification Task. Sensors 2020, 20, 4834. [Google Scholar] [CrossRef] [PubMed]
  4. Leon-Medina, J.X.; Cardenas-Flechas, L.J.; Tibaduiza, D.A. A data-driven methodology for the classification of different liquids in artificial taste recognition applica-tions with a pulse voltammetric electronic tongue. Int. J. Distrib. Sens. Networks 2019, 15. [Google Scholar] [CrossRef]
  5. Chandrashekar, G.; Sahin, F. A survey on feature selection methods. Comput. Electr. Eng. 2014, 40, 16–28. [Google Scholar] [CrossRef]
  6. Zhang, L.; Wang, X.; Huang, G.-B.; Liu, T.; Tan, X. Taste recognition in e-tongue using local discriminant preservation projection. IEEE Trans. Cybern. 2018, 1–14. [Google Scholar] [CrossRef] [PubMed]
  7. Pedregosa, F.; Varoquaux, G.; Gramfort, A.; Michel, V.; Thirion, B.; Grisel, O.; Blon-del, M.; Prettenhofer, P.; Weiss, R.; Dubourg, V.; et al. Scikit-learn: Machine learning in Python. J. Mach. Learn. Res. 2011, 12, 2825–2830. [Google Scholar]
  8. Kumar, M.; Kumar Rath, N.; Swain, A.; Kumar Rath, S. Feature Selection and Classification of Microarray Data using MapReduce based ANOVA and K-Nearest Neighbor. Procedia Comput. Sci. 2015, 54, 301–310. [Google Scholar] [CrossRef]
  9. Ding, H.; Feng, P.-M.; Chen, W.; Lin, H. Identification of bacteriophage virionproteins by the anova feature selection and analysis. Mol. Biosyst. 2014, 10, 2229–2235. [Google Scholar] [CrossRef] [PubMed]
  10. Chen, Q.; Meng, Z.; Liu, X.; Jin, Q.; Su, R. Decision variants for the automatic determination of optimal feature subset in rf-rfe. Genes 2018, 9, 301. [Google Scholar] [CrossRef] [PubMed]
  11. Duan, K.-B.; Rajapakse, J.; Wang, H.; Azuaje, F. Multiple svm-rfe for gene selection in cancer classification with expression data. IEEE Trans. Nanobioscience 2005, 4, 228–234. [Google Scholar] [CrossRef] [PubMed]
Figure 1. Dataset distribution.
Engproc 02 00062 g001
Figure 2. Set of 5 MLAPV response signals that characterize a beer sample.
Engproc 02 00062 g002
Figure 3. Combination between variance filter and selection from model (diagram).
Engproc 02 00062 g003
Figure 4. Combination between variance filter, ANOVA filter and selection from model (diagram).
Engproc 02 00062 g004
Figure 5. Combination between variance filter, ANOVA filter and RFE technique (diagram).
Engproc 02 00062 g005
Figure 6. Feature importance from model using logistic regression.
Engproc 02 00062 g006
Figure 7. Accuracy vs number of features selected using RFE and LinearSVC as classifier.
Engproc 02 00062 g007
Figure 8. Confusion matrix accuracy=93.85% using recursive feature elimination and MLP classifier.
Engproc 02 00062 g008
Table 1. Best results of the combination between the variance filter and selection from model.
ClassifierThreshold Selection from ModelAccuracy
Multilayer perceptron (MLPC) (adjusted)0.40.9032
0.60.9032
Multilayer perceptron (MLPC)0.20.9028
Table 2. Best results of the combination between variance filter, ANOVA filter and selection from model.
ClassifierThreshold Selection from ModelThreshold VarianceFeaturesAccuracy
Multilayer perceptron(adjusted)0.50.000152000.9285
0.40.000152000.9285
0.30.000152000.9123
Table 3. Best result of the combination between variance filter, ANOVA filter and RFE technique.
ClassifierThreshold VarianceFeaturesAccuracy
Multilayer perceptron(adjusted)062000.9032
052000.9028
048000.8937
Publisher’s Note: MDPI stays neutral with regard to jurisdictional claims in published maps and institutional affiliations.

