Abstract
This study aims to evaluate a teff-based substrate (hereinafter substrate) for its suitability to carry probiotics Lacticaseibacillus rhamnosus GG (LCGG) and Lactiplantibacillus plantarum A6 (LPA6). In addition, two-dimensional (2D) fluorescence spectroscopy was applied to monitor the fermentation process by analyzing its spectral data using partial least-squares regression (PLSR) and an artificial neural network (ANN). The fermentation process parameters time and inoculum were optimized to 15 h and 6 log cfu/mL, respectively. During a fermentation run using the optimized parameters, cell counts of LPA6 and LCGG were increased from 6 to 8.42 and 8.11 log cfu/mL, respectively. Values of pH, titratable acidity (TA), lactic acid, and acetic acid were measured in the ranges of 6.13–3.92, 0.37–1.5 g/L, 0–1.7 g/L, and 0.04–0.23 g/L, respectively. Glucose was progressively consumed throughout the fermentation process. For the prediction of cell counts of LPA6 and LCGG, relative root mean square error of predictions (pRMSEP) were measured between 0.25 and 0.37%. In addition, for lactic acid prediction, pRMSEP values of 7.6 and 7.7% were obtained. The findings of this research showed that cell counts of LPA6 and LCGG and content of lactic acid could be predicted accurately by 2D fluorescence spectroscopy coupled with PLSR and ANN. Moreover, whole teff flour alone could serve as a substrate to develop a probiotic-rich beverage.
1. Introduction
Recently, consumers’ health awareness is increasing and it has changed their food preferences to functional foods [1]. Functional foods contain biologically active ingredients, such as probiotics, with an adequate amount to provide a health benefit to the consumers [2]. Probiotic-containing foods are considered the most important functional foods to meet the current consumers’ demand [1]. Beverages can be used as an important medium to incorporate the desired bioactive components, such as probiotics, since they are suitable in handling and refrigerated storage [3]. In addition, acceptance of non-dairy-based products has been increasing due to the uprise of vegetarianism and the limitations related to dairy-based products. Specially, gluten free cereal products are gaining attention worldwide, since they are suitable to gluten sensitive consumers and they are vegetarian friendly [4]. For this aim, teff would be a good alternative, as it is one of the most important gluten free cereal, which is a staple food ingredient in Ethiopia [5].
The fermentation process is a vital unit operation to produce probiotic beverages, which usually uses high performance liquid chromatography for the analysis of the process. However, this way of analysis is time consuming, labor intensive, and costly. Likewise, plate count agar is commonly used for viable microbial counting, which is tedious work. Recently, an actual time and effective control of a fermentation process has been considered an essential way to increase efficiency and improve the quality of the final products [6]. For this intention, an alternative would be the usage of 2D fluorescence spectroscopy, which is a nondestructive way of analysis [7]. In fluorescence measurements, important information cannot usually be collected in specific parts of the spectrum, but distributed throughout the spectroscopic data set. So, for the extraction of important information, multivariate data analyses are always applied [8].
Therefore, this research aims to evaluate the application of 2D fluorescence spectroscopy for the on-line monitoring of a teff-based substrate fermentation inoculated with co-culture strains of LPA6 and LCGG. For the fluorescence spectral data evaluation, PLSR and ANN were used. The analysis target components were cell counts of LPA6 and LCGG, and contents of lactic acid and glucose.
2. Materials and Methods
2.1. Starter Culture
Starter cultures of LPA6 (LMG 18053, BCCM, Gent, Belgium) and LCGG (LMG 18243, BCCM, Gent, Belgium) were prepared according to the method used by [9]. Strains of LPA6 and LCGG were incubated for approximately 24 h in a refrigerated incubator (BINDER GmbH, KB 115, Tuttlingen, Germany) in sterile MRS (DE MAN, ROGOSA and SHARPE) broth. Starter cultures were put in a refrigerator (4–6 °C) until utilization within 48 h.
2.2. Off-Line Measurement of Cell Count and Fermentation Condition
Samples containing LPA6 were prepared with serial ten-fold dilutions using a saline solution. Then, with a calibrated micropipette, the prepared dilutions were spread on MRS agar plates, and put in an incubator for 24 h at 30 °C [10]. A similar procedure was followed for the cell count determination of LCGG, but incubated for 48 h. Moreover, the selective enumeration of mixed strains of LPA6 and LCGG was conducted according to the method described by ST Alemneh, SA Emire and B Hitzmann [9]. Next, 6 log cfu/mL starter co-cultures of LPA6 and LCGG were inoculated to the fermentation medium, which was prepared by mixing 7 g of whole grain teff flour with 100 mL of distilled water. Samples for the analysis of cell counts of LPA6 and LCGG, glucose, and lactic acid were taken in 2 h intervals from the first 3 h of fermentation.
2.3. Off-Line Measurement of Glucose and Lactic Acid
Analyses of glucose and lactic acid were performed using high performance liquid chromatography (HPLC). The collected samples’ supernatant after centrifugation (3000× g, 4 °C) for 15 h was filtered using a 0.45 µm polypropylene membrane (VWR, Darmstadt, Germany). Then, the supernatant was analyzed using HPLC (ProStar, Variant, Walnut Creek, CA, USA), which was connected to a refractive index detector. Next, 20 μL supernatant samples were injected into a Rezex ROA-organic acid H+ (8%) column (Phenomenex, Aschaffenburg, Germany), operating at 70 °C. Then, 5 mM H2SO4 was used as a solvent with a flow rate of 0.6 mL/min. For the calculation of the lactic acid and glucose contents, the chromatography software GalaxieTM (Varian, Walnut Creek, CA, USA) was used.
2.4. On-Line Measurement Using 2D Fluorescence Spectroscopy
Two-dimensional fluorescence spectra were collected using a BioView sensor (DELTA Lights & Optics, Venlighedsvej 4, 2970, Horsholm, Denmark). The sensor measured the multi-wavelength combinations of excitation (270–550 nm) and emission (310–590 nm). The produced spectra consisted of 120 wavelength combinations with their corresponding intensity values. For the evaluation of the spectral data, PLSR and ANN were used. The software Unscrambler X version 10.3 (CAMO Software AS., Oslo, Norway) and MATLAB R2019a version 9.6 (The MathWorks Inc. 2019, Natick, MA, USA) were utilized to build calibration and prediction models.
3. Results and Discussion
3.1. Optimization of Fermentation Process
The Nelder–Mead simplex method was followed for the optimization of the fermentation process, using the influencing variables time from 9 to 15 h and inoculum from 5 to 7 log cfu/mL. The objective of the optimization process was to obtain a maximum value of the quality function (QF) (Equation (1)).
Here, in our previous work [9], the denominator 8 log cfu/mL and numerator 4 were chosen, since cell counts of LPA6 arrived at the stationary phase when their counts were determined to be about 8 log cfu/mL with approximately 4 pH. Results of the quality function were measured from 1.8 to 2.0. In total, eight experiments were executed, among which the sixth experiment was taken as the maximum value of the quality function. Among the eight experiments, results of the quality function at the third, fourth, seventh, and eighth experiments did not show a significant difference (p < 0.05). The obtained optimum parameters were time (15 h) and inoculum size (6 log cfu/mL). At the point where the optimum variables taken, values of quality function, cell counts of LPA6, and pH were documented as 2, 8.4 log cfu/mL, 4.2, respectively.
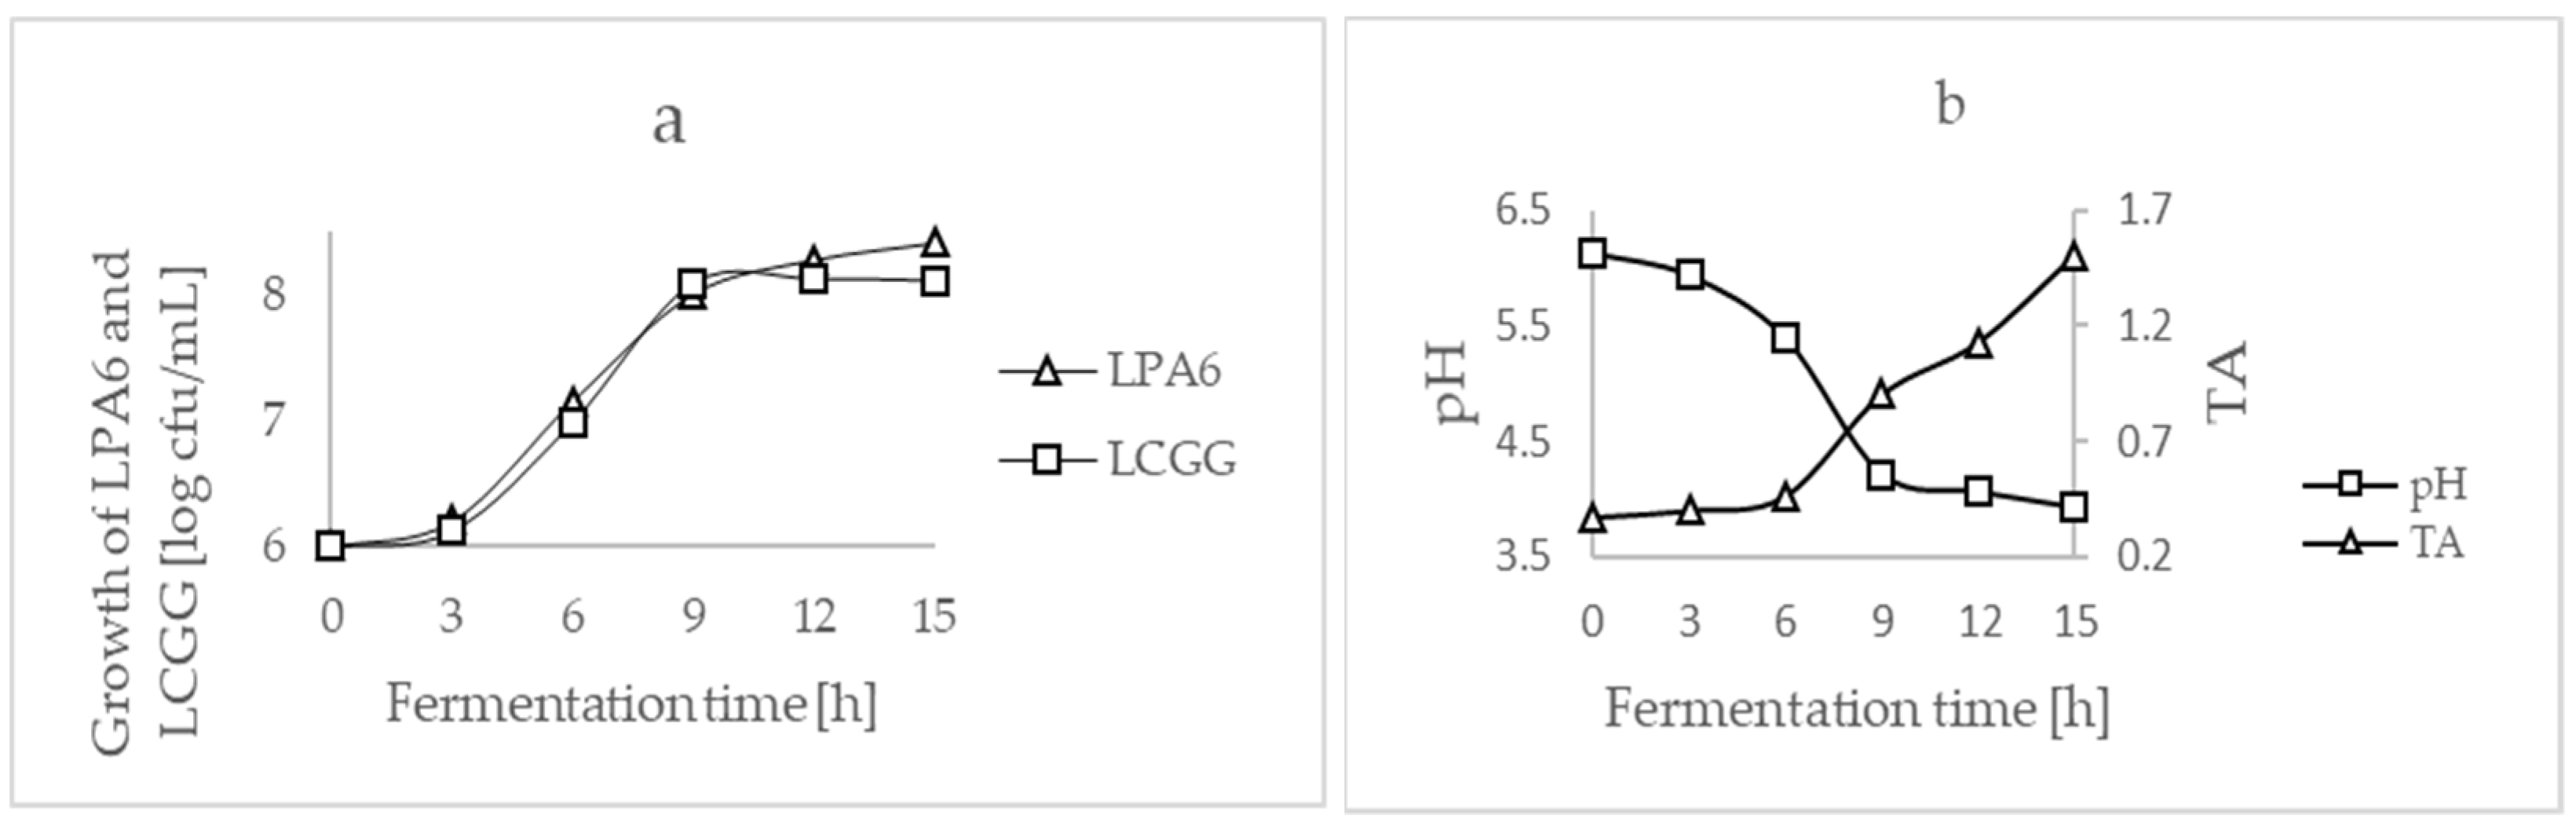
3.2. Co-Culture Strains Fermentation
Using the optimized parameters, the fermentation of the substrate inoculated with co-culture strains of LPA6 and LCGG was performed. Results of the cell counts of LPA6 and LCGG, pH and titratable acidity (TA) during the 15 h fermentation are displayed in Figure 1.
Figure 1.
(a) Growth of Lactiplantibacillus plantarum A6 (LPA6) and Lacticaseibacillus rhamnosus GG (LCGG), (b) pH and TA measurements; TA, titratable acidity.
In the 15 h fermentation, cell counts of LPA6 and LCGG were registered from 6 log cfu/mL to 8.42 and 8.11 log cfu/mL, respectively. Cell counts of LPA6 increased significantly (p < 0.05) from the start of the fermentation, up to 9 h of fermentation. However, from 12 to 15 h of fermentation, the cell counts did not increase significantly. In addition, the cell counts of LCGG increased significantly from the start of fermentation to 9 h of fermentation. Then, its cell counts did not show a significant increase until the end of the fermentation time. Growth of LCGG showed a longer lag phase and turned into a stationary phase sooner, compared to LPA6. During the 15 h of fermentation, both microbial cells counted above 8 log cfu/mL, which is more than the minimum required number. To provide a probiotic effect, food should have a minimum probiotic cell count of 6–7 log cfu/mL in the time of consumption [11].
In the 15 h of fermentation, pH and TA values were measured from 6.13 to 3.92 and from 0.37 to 1.5 g/L, respectively (Figure 1). The values of pH decreased significantly (p < 0.05) throughout the fermentation time. However, values of TA did not show a significant increase for the first 3 h of fermentation. However, significantly increased TA values were observed from 3 to 15 h of fermentation. The decrease in the values of pH and increase in TA during the time of fermentation may be due to the production of organic acids such as lactic and acetic acids. In this study, the observed pH of 3.92 was in the range of 3.5–4.5, which is a comfortable pH zone for probiotics in the gastrointestinal tract. Moreover, in these pH range values, the survivability of the consumed probiotics are increased [12].
Progressively, glucose was completely consumed from 1.5 to 0 g/L. However, the contents of lactic and acetic acids increased from 0 to 1.7 g/L and from 0.04 to 0.23 g/L, respectively.
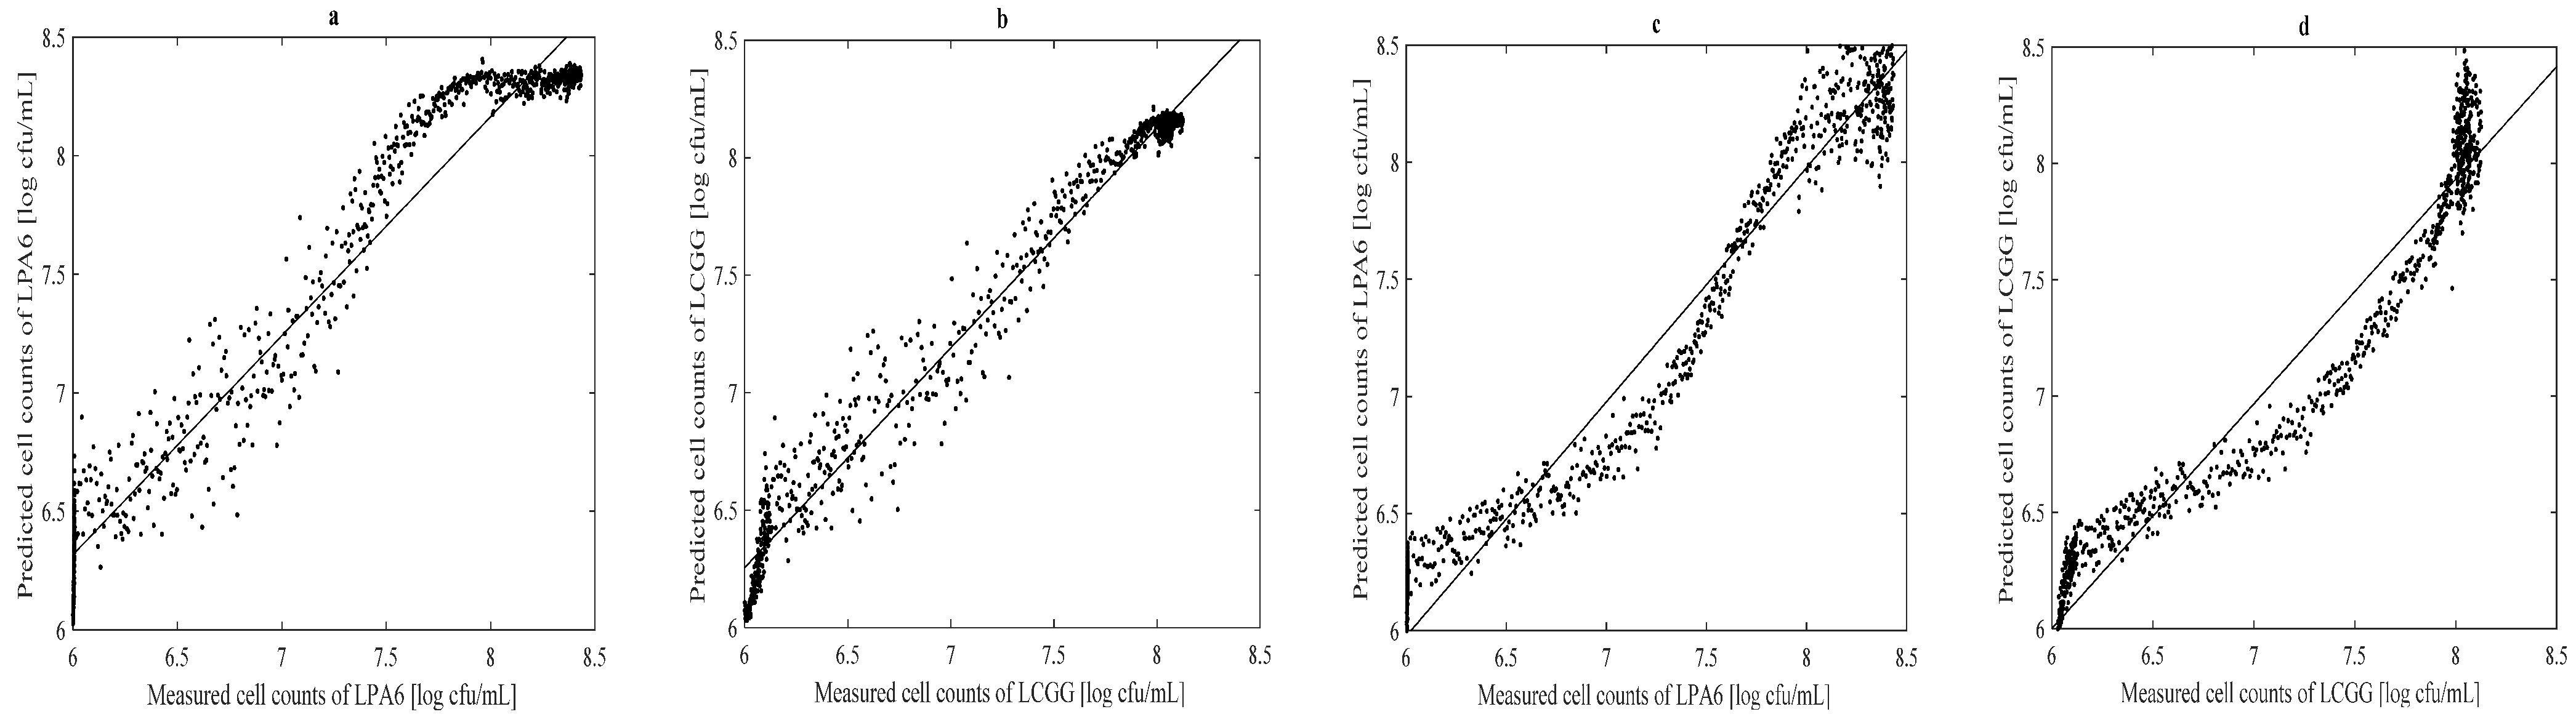
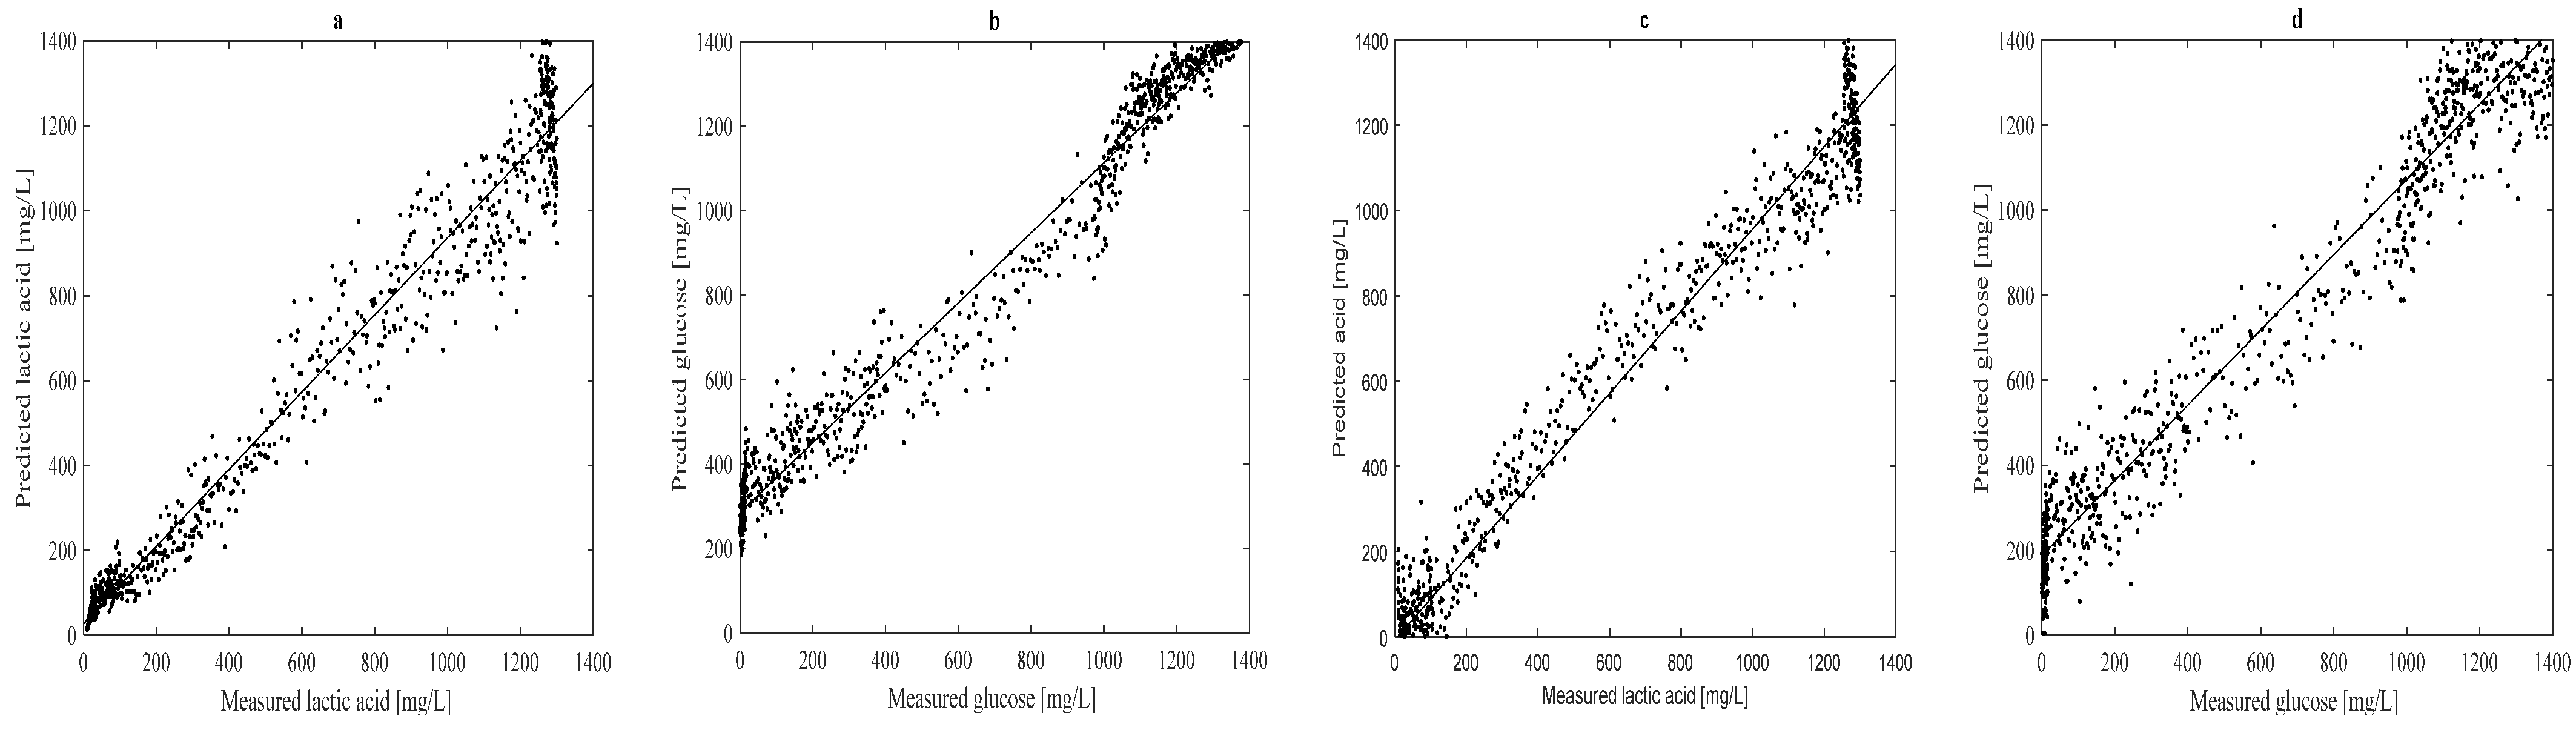
3.3. Prediction of Lactic Acid, Glucose and Cell Counts
SNV preprocessed fluorescence data were used for the models’ calibration of ANN and PLSR with the aim to predict glucose and cell counts of LPA6 and LCGG. However, for lactic acid prediction, the original data were used. For the model calibration and prediction, the fluorescence spectral data and off-line measured data were used. The predicted cell counts of LPA6 and LCGG, lactic acid, and glucose are displayed in Figure 2 and Figure 3. The predicted values were compared with the actual results to evaluate the prediction ability of the models.
Figure 2.
Measured vs. predicted cell counts using ANN (a,b), and using PLSR (c,d); ANN, artificial neural network; PLSR, partial least squares regression; LPA6, Lactiplantibacillus plantarum A6; LCGG, Lacticaseibacillus rhamnosus GG.
Figure 3.
Measured vs. predicted lactic acid and glucose using ANN (a,b), and using PLSR (c,d); ANN, artificial neural network; PLSR, partial least squares regression.
Cell counts of LPA6 and LCGG were measured from 6 log cfu/mL to 8.49 and 8.29 log cfu/mL, respectively. The prediction of cell counts of LPA6 and LCGG with ANN using one hidden neuron showed a pRMSEP of 3.6 and 2.7%, respectively. Similarly, the prediction of cell counts of LPA6 and LCGG with PLSR using five principal components resulted in 2.5 and 2.6%, respectively (Figure 2).
Experimentally measured values of lactic acid and glucose were observed between 0.01 and 1.8 g/L and 1.4 and 0 g/L, respectively. A pRMSEP of 7.6% was found for the prediction of lactic acid with PLSR using seven principal components, whereas 11.6% of pRMSEP was measured for glucose prediction with PLSR using seven principal components. Likewise, the prediction of lactic acid and glucose with ANN using one hidden neuron showed a pRMSEP of 7.7 and 14%, respectively (Figure 3). Overall, high values of the coefficient of determination (R2), which measured from 0.89 to 0.96, and low values of pRMSEP showed that lactic acid and cell counts of LAP6 and LCGG could be predicted accurately with ANN and PLSR.
4. Conclusions
Two-dimensional fluorescence spectroscopy is an ideal instrument for the on-line supervision of the fermentation process without destruction. Once PLSR and ANN models have been developed, it is possible to obtain values of cell counts, lactic acid, and glucose in a short time using 2D fluorescence spectroscopy. However, it took a long time to obtain similar results using the conventional methods of plate count agar and high performance liquid chromatography. This study has shown that 2D fluorescence spectroscopy coupled with PLSR and ANN can be applied to predict cell counts of LPA6 and LCGG and lactic acid during the fermentation of a teff-based substrate.
Author Contributions
Conceptualization, B.H., S.T.A., and O.P.-D.; writing—original draft preparation, S.T.A.; writing—review and editing, S.T.A., O.P.-D., B.H., S.A.E., and M.J.; supervision, B.H., S.A.E., and M.J.; investigation and formal analysis, S.T.A. All authors have read and agreed to the published version of the manuscript.
Funding
This research was funded by the German Academic Exchange Service (DAAD), grant number 57399471.
Institutional Review Board Statement
Not applicable.
Informed Consent Statement
Not applicable.
Data Availability Statement
Not applicable.
Acknowledgments
The authors would like to thank Almut von Wrochem (Department of Process Analytics and Cereal science, University of Hohenheim, Stuttgart, Germany) for her support during the HPLC analysis.
Conflicts of Interest
The authors declare that there is no conflict of interest.
References
- Küçükgöz, K.; Trząskowska, M. Nondairy Probiotic Products: Functional Foods That Require More Attention. Nutrients 2022, 14, 753. [Google Scholar] [CrossRef] [PubMed]
- Angelov, A.; Yaneva-Marinova, T.; Gotcheva, V. Oats as a matrix of choice for developing fermented functional beverages. J. Food Sci. Technol. 2018, 55, 2351–2360. [Google Scholar] [CrossRef] [PubMed]
- Corbo, M.R.; Bevilacqua, A.; Petruzzi, L.; Casanova, F.P.; Sinigaglia, M. Functional beverages: The emerging side of functional foods: Commercial trends, research, and health implications. Compr. Rev. Food Sci. Food Saf. 2014, 13, 1192–1206. [Google Scholar] [CrossRef]
- Waters, D.M.; Mauch, A.; Coffey, A.; Arendt, E.K.; Zannini, E. Lactic acid bacteria as a cell factory for the delivery of functional biomolecules and ingredients in cereal-based beverages: A review. Crit. Rev. Food Sci. Nutr. 2015, 55, 503–520. [Google Scholar] [CrossRef] [PubMed]
- Alemneh, S.T.; Emire, S.A.; Hitzmann, B.; Zettel, V. Comparative Study of Chemical Composition, Pasting, Thermal and Functional properties of Teff (Eragrostis tef) Flours Grown in Ethiopia and South Africa. Int. J. Food Prop. 2022, 25, 144–158. [Google Scholar] [CrossRef]
- Lourenço, N.; Lopes, J.; Almeida, C.; Sarraguça, M.; Pinheiro, H. Bioreactor monitoring with spectroscopy and chemometrics: A review. Anal. Bioanal. Chem. 2012, 404, 1211–1237. [Google Scholar] [CrossRef] [PubMed]
- Assawajaruwan, S.; Reinalter, J.; Hitzmann, B. Comparison of methods for wavelength combination selection from multi-wavelength fluorescence spectra for on-line monitoring of yeast cultivations. Anal. Bioanal. Chem. 2017, 409, 707–717. [Google Scholar] [CrossRef] [PubMed]
- Claßen, J.; Aupert, F.; Reardon, K.F.; Solle, D.; Scheper, T. Spectroscopic sensors for in-line bioprocess monitoring in research and pharmaceutical industrial application. Anal. Bioanal. Chem. 2017, 409, 651–666. [Google Scholar] [CrossRef] [PubMed]
- Alemneh, S.T.; Emire, S.A.; Hitzmann, B. Teff-Based Probiotic Functional Beverage Fermented with Lactobacillus rhamnosus and Lactobacillus plantarum. Foods 2021, 10, 2333. [Google Scholar] [CrossRef] [PubMed]
- Nguyen, T.T.T.; Guyot, J.-P.; Icard-Vernière, C.; Rochette, I.; Loiseau, G. Effect of high pressure homogenisation on the capacity of Lactobacillus plantarum A6 to ferment rice/soybean slurries to prepare high energy density complementary food. Food Chem. 2007, 102, 1288–1295. [Google Scholar] [CrossRef]
- Rathore, S.; Salmerón, I.; Pandiella, S.S. Production of potentially probiotic beverages using single and mixed cereal substrates fermented with lactic acid bacteria cultures. Food Microbiol. 2012, 30, 239–244. [Google Scholar] [CrossRef] [PubMed]
- Gao, Y.; Hamid, N.; Gutierrez-Maddox, N.; Kantono, K.; Kitundu, E. Development of a probiotic beverage using breadfruit flour as a substrate. Foods 2019, 8, 214. [Google Scholar] [CrossRef] [PubMed] [Green Version]
Publisher’s Note: MDPI stays neutral with regard to jurisdictional claims in published maps and institutional affiliations. |
© 2022 by the authors. Licensee MDPI, Basel, Switzerland. This article is an open access article distributed under the terms and conditions of the Creative Commons Attribution (CC BY) license (https://creativecommons.org/licenses/by/4.0/).


