Proceeding Paper

Forecasting Customer Complaints in the Mobile Telecommunication Sector Using Supervised Machine Learning †

Department of Computer Science, Varna Free University, 9007 Varna, Bulgaria
Presented at the 15th International Scientific Conference TechSys 2026—Engineering, Technologies and Systems, Plovdiv, Bulgaria, 14–16 May 2026.
Eng. Proc. 2026, 150(1), 58; https://doi.org/10.3390/engproc2026150058
Published: 22 July 2026

Abstract

The telecommunications sector continues to experience exponential growth in demand, accompanied by a corresponding increase in customer complaints regarding service quality. To effectively address these challenges, many telecom companies rely on customer feedback to assess and improve their network and services. This case study focused on a Lebanese telecom company, investigating the application of machine learning algorithms, particularly Artificial Neural Networks. The analysis performed compares the effectiveness of various optimizers and activation functions to identify the most suitable approach for our specific context. Utilizing a sample database comprising 10,000 mobile market subscribers, this study incorporates variables such as gender, age, device manufacturer, service quality, and complaint status. The results of this case study emphasize that, across various metrics, and despite its complexity, Artificial Neural Networks outperform other algorithms in terms of prediction performance. Additionally, we propose a segmented prediction model based on time intervals and customer groups to enhance prediction accuracy and practical utility. The segmentation will involve examining customer groups based on their characteristics.

1. Introduction

Over the course of numerous years, customer feedback has served as a fundamental element in assessing the performance of companies [1]. Consequently, the call center, acting as an intermediary between the company and its clientele, assumed a pivotal role in the collection, processing, and oversight of customer feedback, encompassing both positive and negative opinions, facilitated by automated control systems [2].
Despite the significant advancements in technology leading to heightened data processing capabilities, instances of customer complaints remain unavoidable. The subsequent Table 1 delineates customer complaint reasons and their corresponding likelihood to complain relative to service problem types.
This table illustrates the diverse array of factors contributing to customer dissatisfaction, including issues such as coverage discrepancies, difficulties in accessing information, inaccuracies in billing, erroneous charges, breaches of contractual agreements, and delays in service provision [3].
Our primary focus is on the aspect of coverage, particularly in the realm of telecommunications. Coverage pertains to the geographical expanse within which a base station signal can effectively reach [4]. It is contingent upon various factors such as terrain features (e.g., mountains), building structures, and the technology employed (e.g., LTE). The efficacy of mobile device connectivity to a base station hinges upon the strength of the signal it emits. However, obstacles such as buildings, particularly those constructed with metallic materials, can impede signal propagation. Additionally, signal penetration underground is limited, further exacerbating coverage issues in certain locales [5].
Hence, the problem of inadequate coverage can be construed as a manifestation of service quality deficiencies, given that suboptimal coverage often underpins most service-related shortcomings.

2. Overview and Related Work

The detection of customer service quality issues often remains elusive until customers formally voice their complaints. To mitigate latent customer grievances, it becomes imperative to proactively identify and address instances of poor service quality before they escalate into formal complaints [6]. Establishing systems capable of discerning nascent shifts in trends is paramount. These early warning mechanisms hold significant utility across various domains, including financial securities trading, sales performance forecasting, and churn analysis [7].
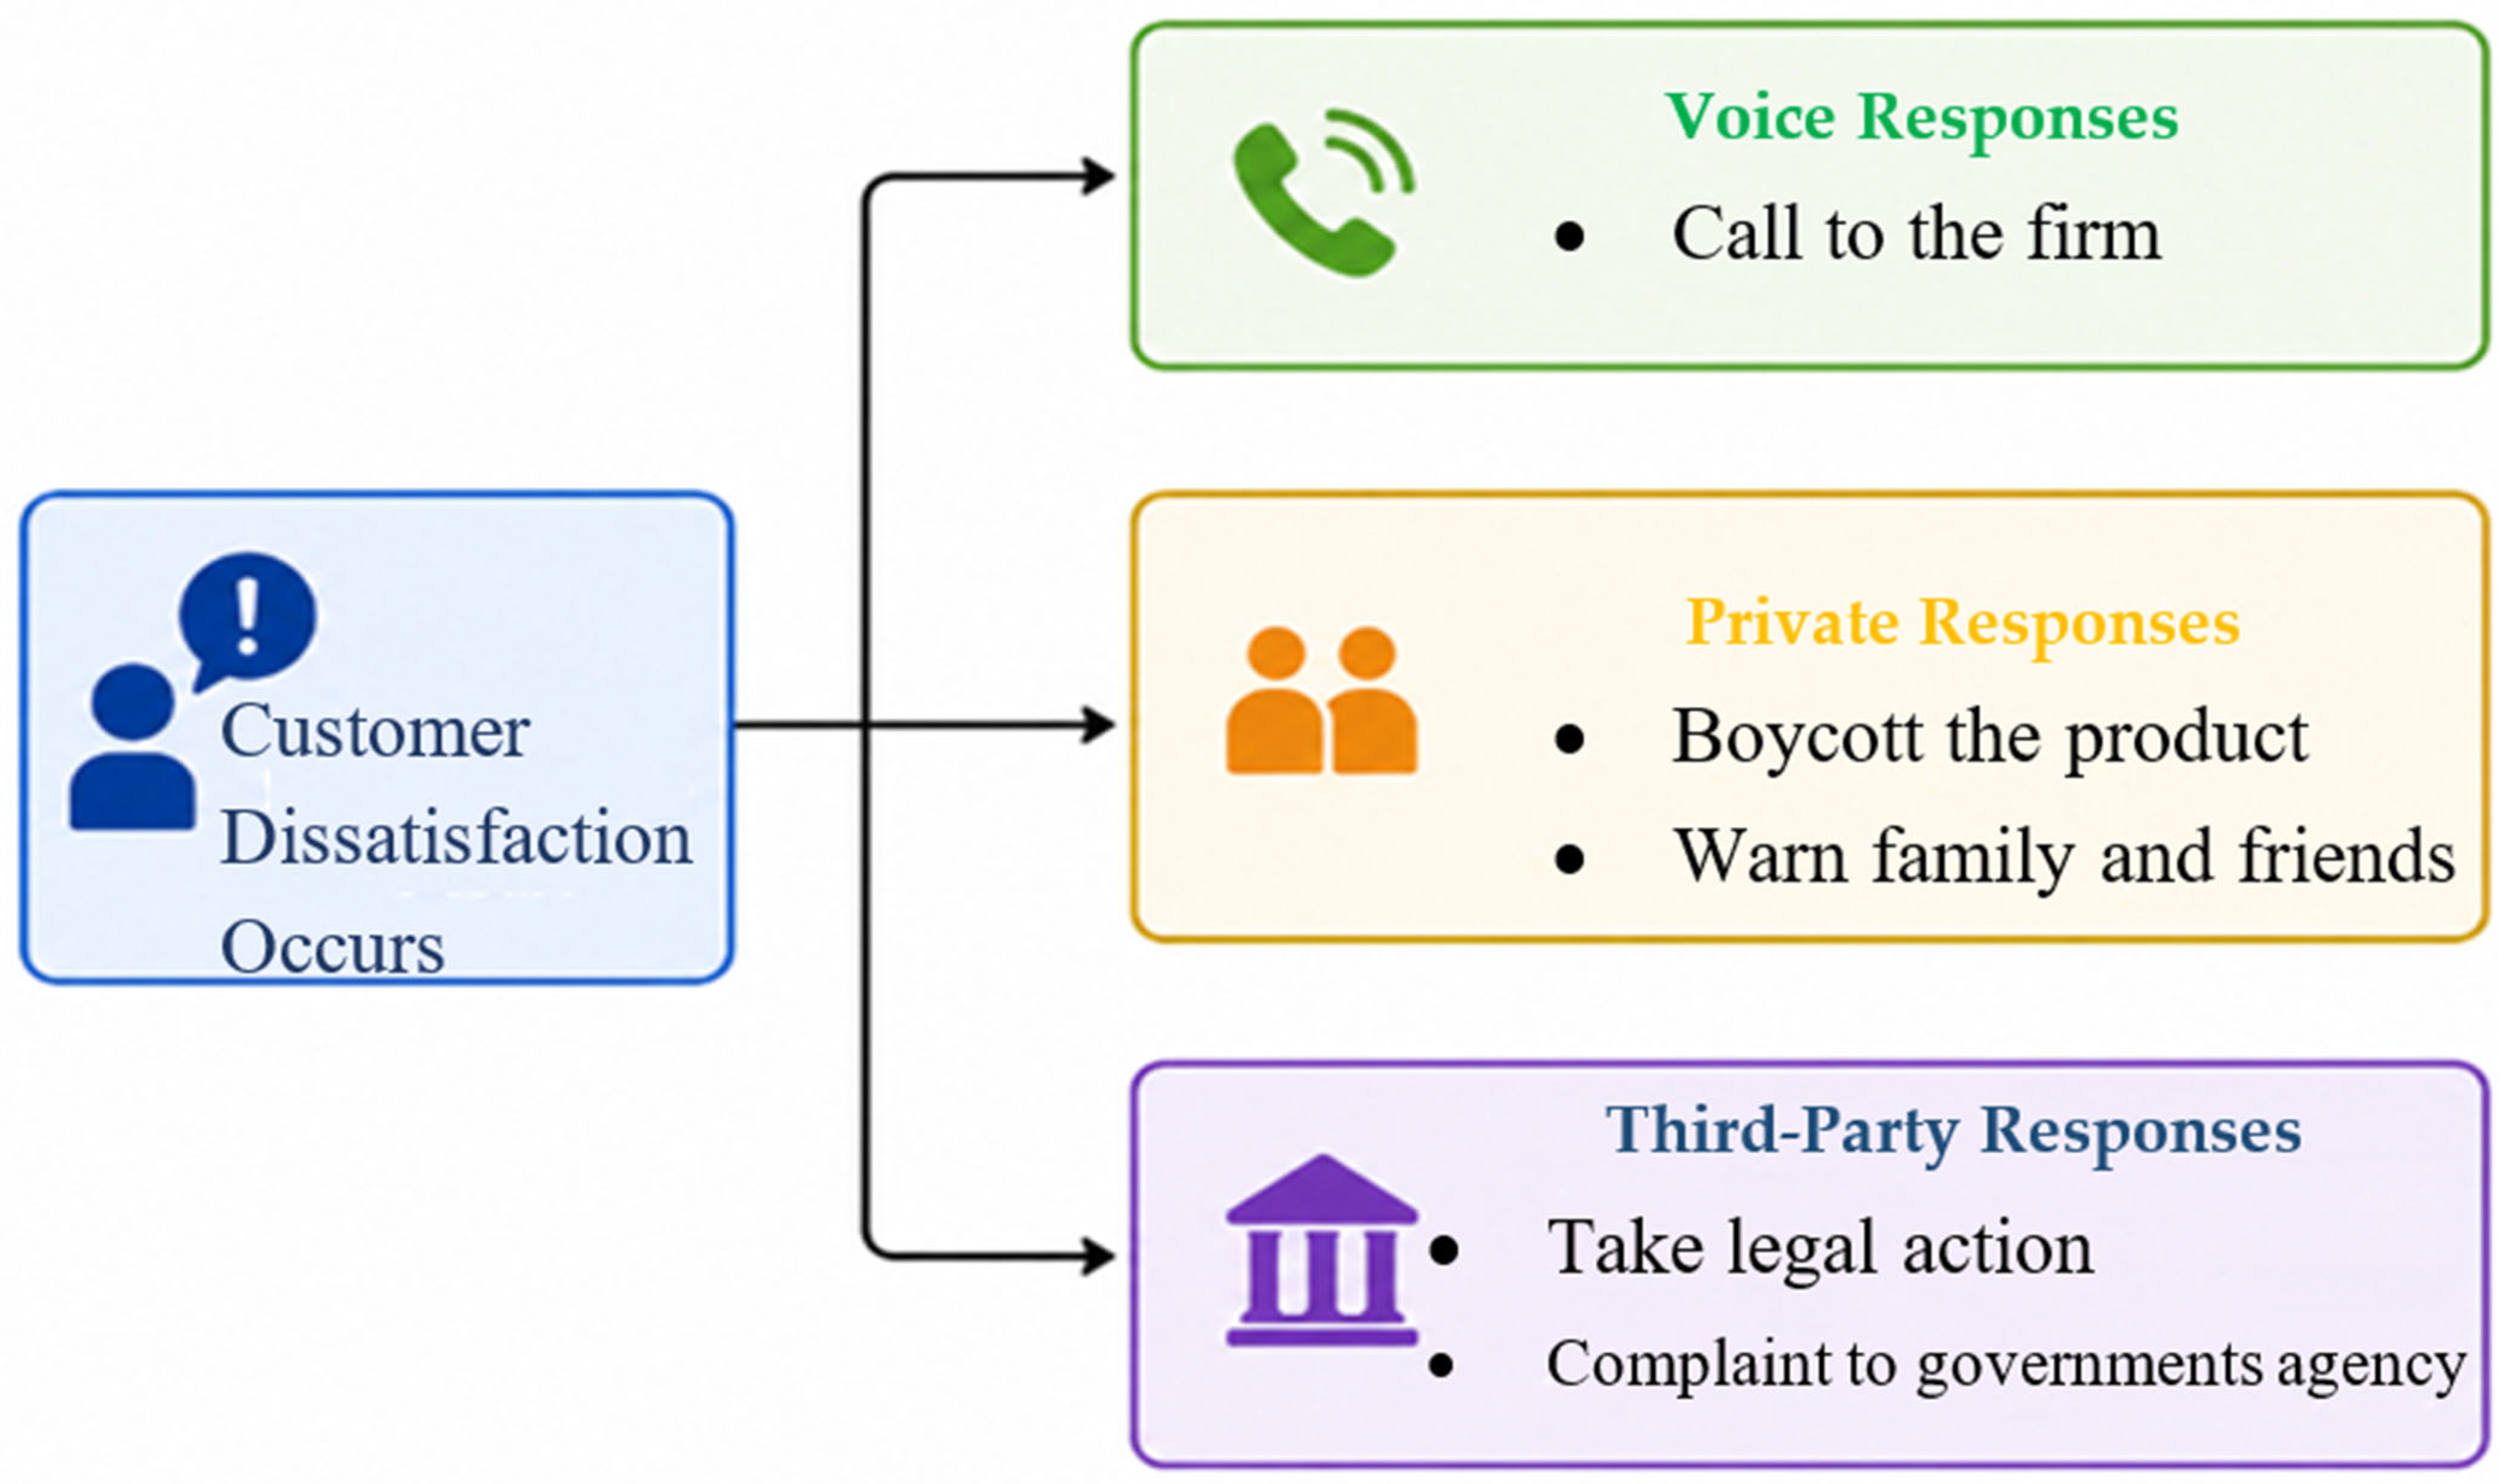
In his work published in 2018, Choi defined customer complaints as requests or demands for adjustments in products or services. This definition draws upon research findings [8]. For instance, Peek (2023) noted that personal characteristics and internal influences exert the greatest influence on customer complaints [9]. Building upon this, Nimako (2012) characterized customer complaints as negative communications about products or services directed towards the firm, manufacturer, or third-party entities [10]. Kim et al. (2003) emphasized the prevalence of complaints among dissatisfied users and identified various contributing factors, including customer personality, attitude, motives, perceived value of time, information level, and socio-demographic characteristics [11]. Furthermore, others categorized customer responses into three types: direct communication of complaints to the company, product rejections accompanied by warnings to acquaintances, and legal action against the company or governmental complaints [12].
These research insights underscore the multifaceted nature of customer complaints and the diverse responses they elicit from consumers, as shown in Figure 1.
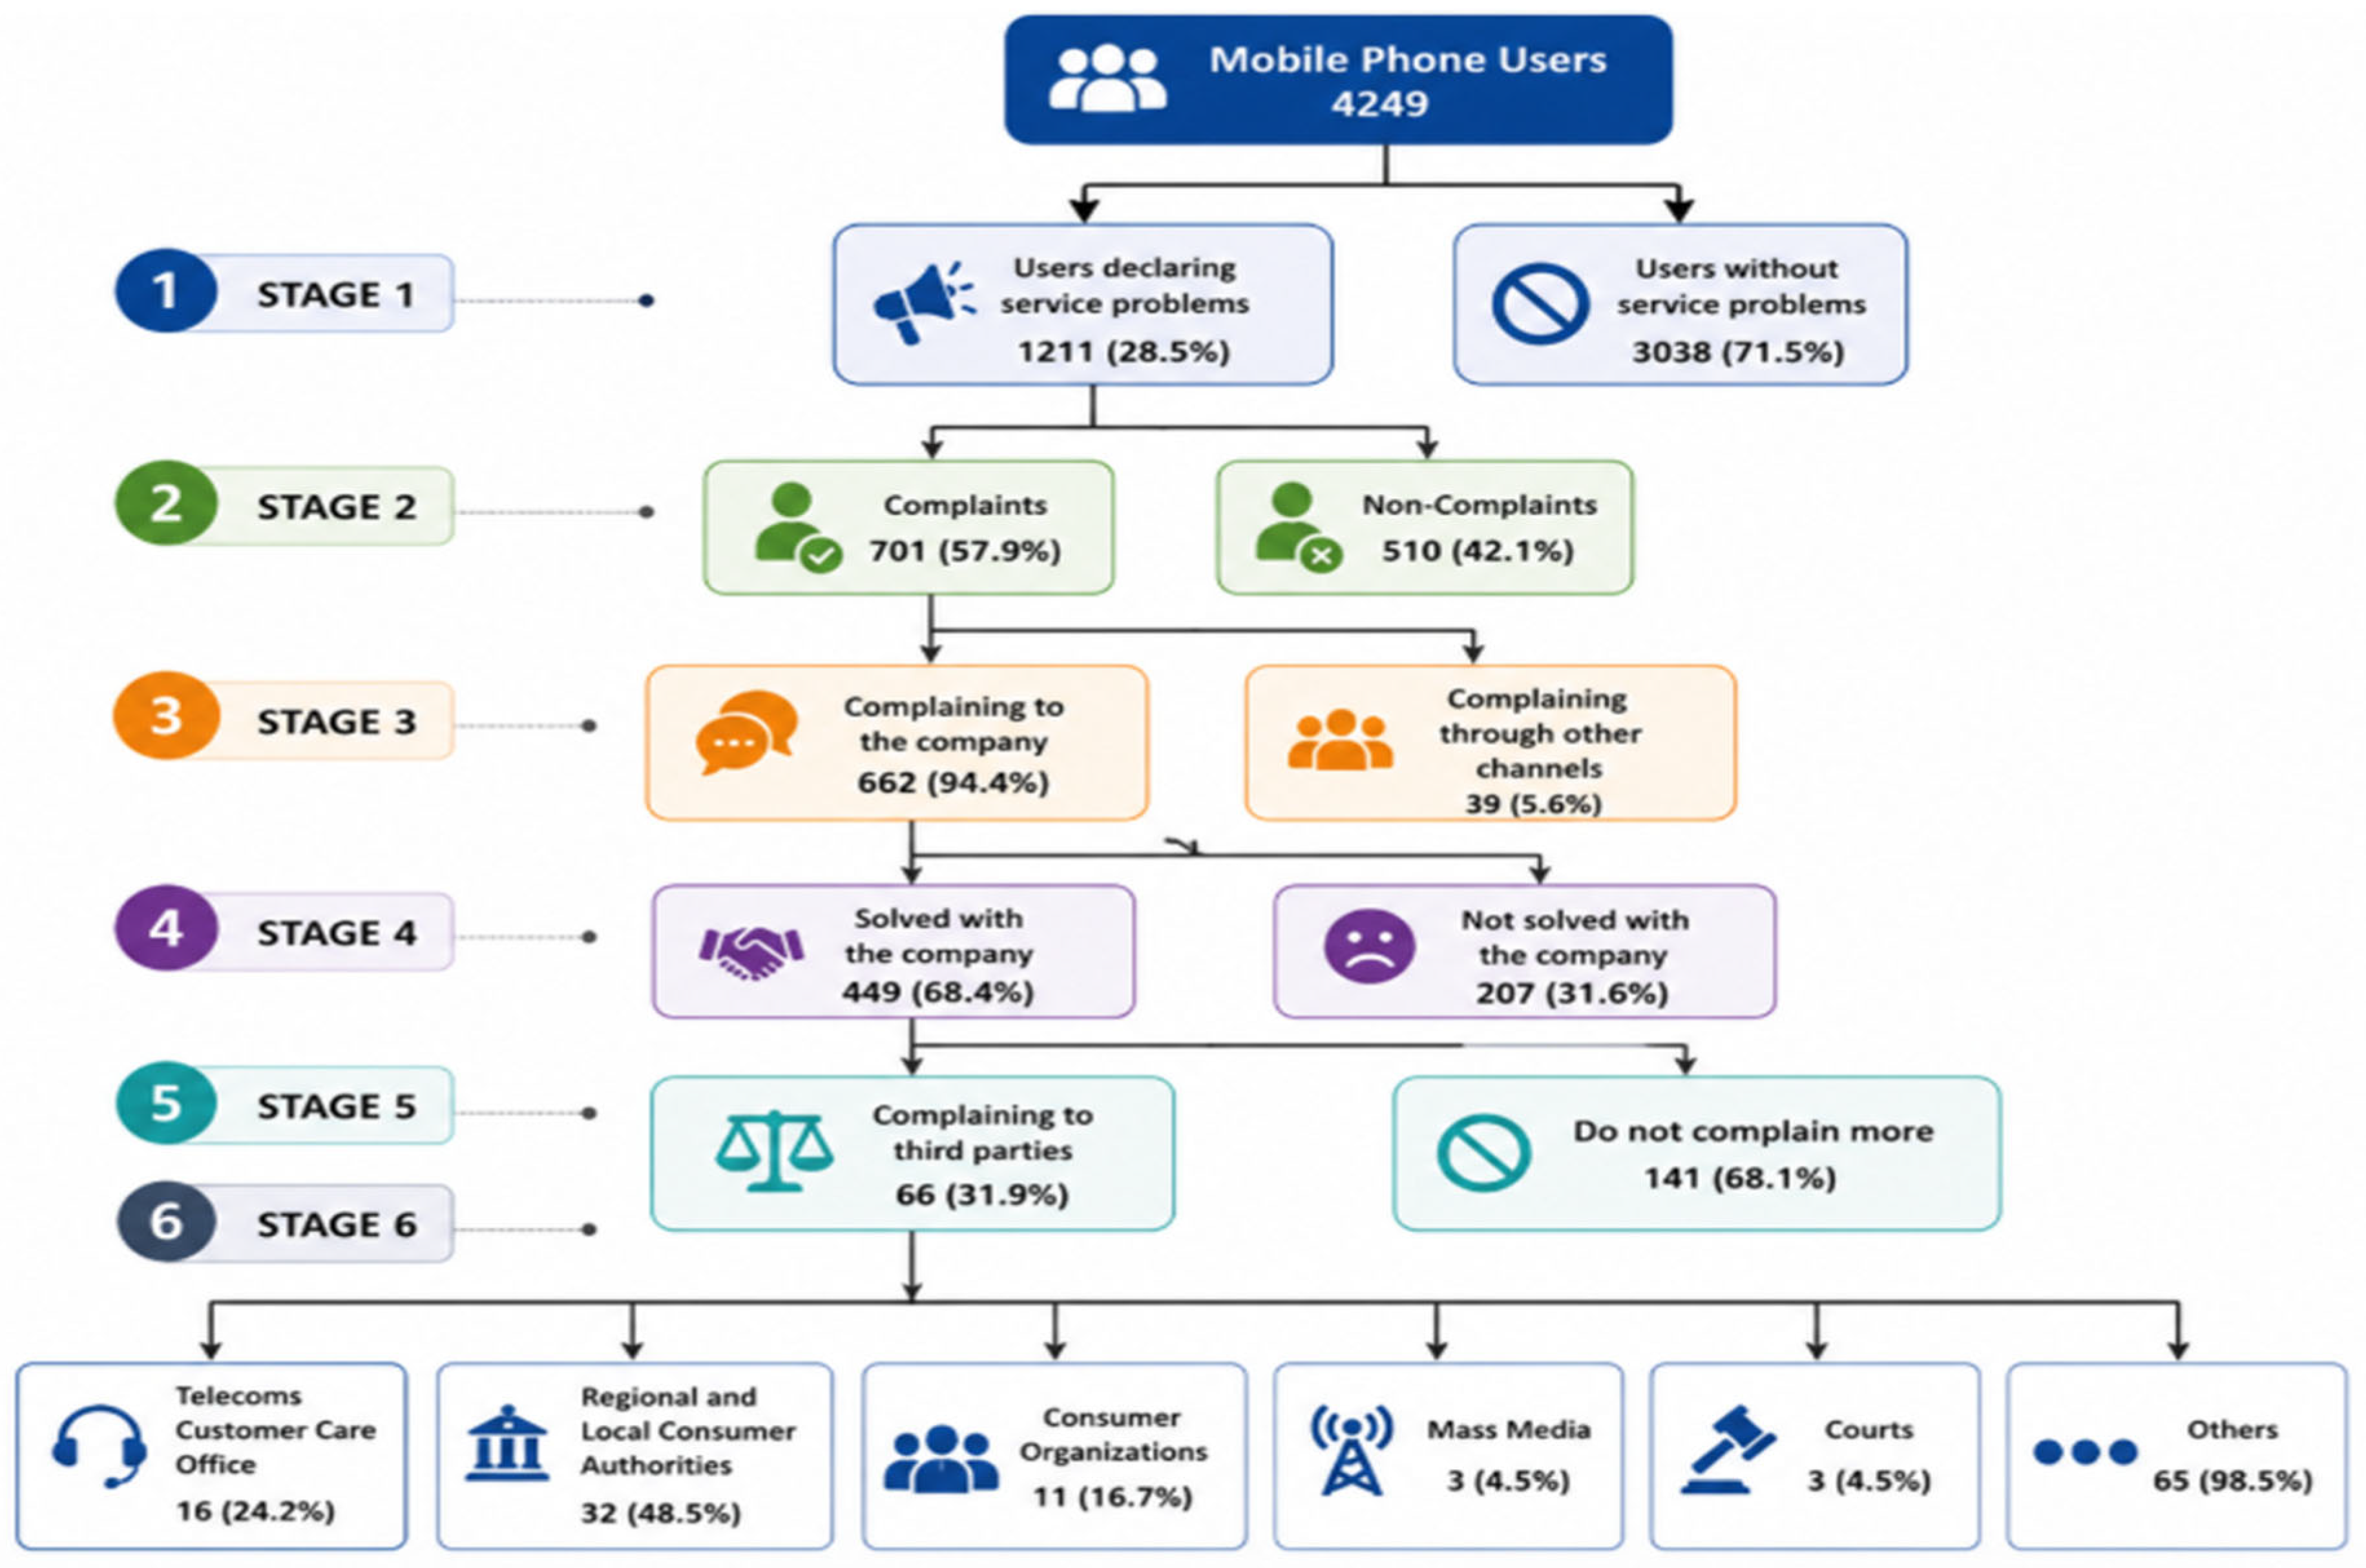
Additional factors affecting customer complaints were discussed in the literature, including customer experiences, socio-cultural values, psychological attributes, emotional dispositions, and personality traits [13,14,15]. Further, Garin-Munoz study has focused on customer complaint behavior within the mobile telecommunications sector. The study delineated six stages, where initially, in stage 1, 28.5% of users declared service problems. Subsequent stages unveiled only 57.9% of these customers who faced service problems actually lodged complaints, with the final stage indicating that 94% of those who did complain opted to directly contact the company [3].
Through a simple calculation in Figure 2, it becomes evident that only 54.42% of clients who encounter service issues proactively provide negative feedback to the company, leaving 45.58% of such clients undocumented in the company’s complaint database. This calculation is derived by multiplying the percentage of clients who voice complaints about services (57.9%) by the proportion of those who directly communicate their grievances to the company (94%):
P e r c e n t a g e   o f   c l i e n t s   p r o v i d i n g   n e g a t i v e   f e e d b a c k   t o   t h e   c o m p a n y   % = 0.579   x   0.94 = 0.54426 = 54.42 %
Subtracting this figure from 100%, representing the total client’s facing service problems, reveals that 45.58% of clients opt not to voice their grievances directly to the company. Instead, they may silently switch to another service provider, potentially disseminating negative perceptions about the product and the telecom company, which could manifest in a decreased statistical matrix for the company overall.
Further analysis reveals that only 15.51% of clients who encounter service problems choose to express their complaints directly to the company. This is calculated by multiplying the percentage of clients experiencing service issues by the proportion of clients who express complaints in any form, then by the percentage of clients who opt to communicate their complaints directly to the company:
P e r c e n t a g e   o f   c l i e n t s   e n c o u t e r i n g   s e r v i c e   p r o b l e m s   a n d   r e p o r t i n g c o m p l a i n t s   d i r e c t l y   t o   t h e   c o m p a n y   % = 0.285   × 0.579   × 0.94 = 0.1551 = 15.51 %
This leaves us to ponder the fate of the remaining 84.48% of clients. Are they content with the service, or are they contemplating switching providers in the near future?
Numerous studies have explored customer behavior in response to products or services that fail to meet their expectations; however, these studies have predominantly relied on survey and interview data, often lagging comprehensive integration of all client data into a unified model first. Additionally, they often struggle to predict whether a client will indeed lodge a complaint about a particular service or product.
This paper shifts its focus towards harnessing the capabilities of machine learning (ML) modeling to address these limitations. Specifically, we propose a modern strategy or novel approach leveraging various attributes extracted from a Lebanese telecom company’s database pertaining to customer data. Our approach utilizes ML Artificial Neural Networks (ANNs) to analyze and forecast customer complaints. First, through experimentation we conducted comparisons across multiple activation functions, loss functions, and learning rates to identify the most effective and accurate model for predicting client complaint behavior.

3. Research Objective and Process

As demonstrated earlier, a significant portion (45.58%) of unsatisfied clients refrain from lodging complaints with the company, while only 15.51% express negative feedback directly. Consequently, according to Garin-Munoz’s study, there arises a necessity for the company to devise a method to anticipate the satisfaction levels of the remaining 84.49% of clients [3].
This paper proposes the implementation of an Artificial Neural Network (ANN) model utilizing logistic regression (LR) to forecast whether a client encounters service issues. Throughout the project we delve into discussions and comparisons between various activation functions and parameter optimizers to identify the most suitable ones yielding the highest accuracy.
Subsequently, we employ a Recurrent Neural Network (RNN) to assess the company’s services, particularly focusing on network coverage and data consumption. This enables us to forecast whether service quality is expected to improve or deteriorate.

4. Data Processing

The study uses information from the Touch Demo database between 2016 and 2017. We obtain a sample of call records from Touch (Beirut, Lebanon) clients, during a six-month period, which are combined and aggregated into one dataset.
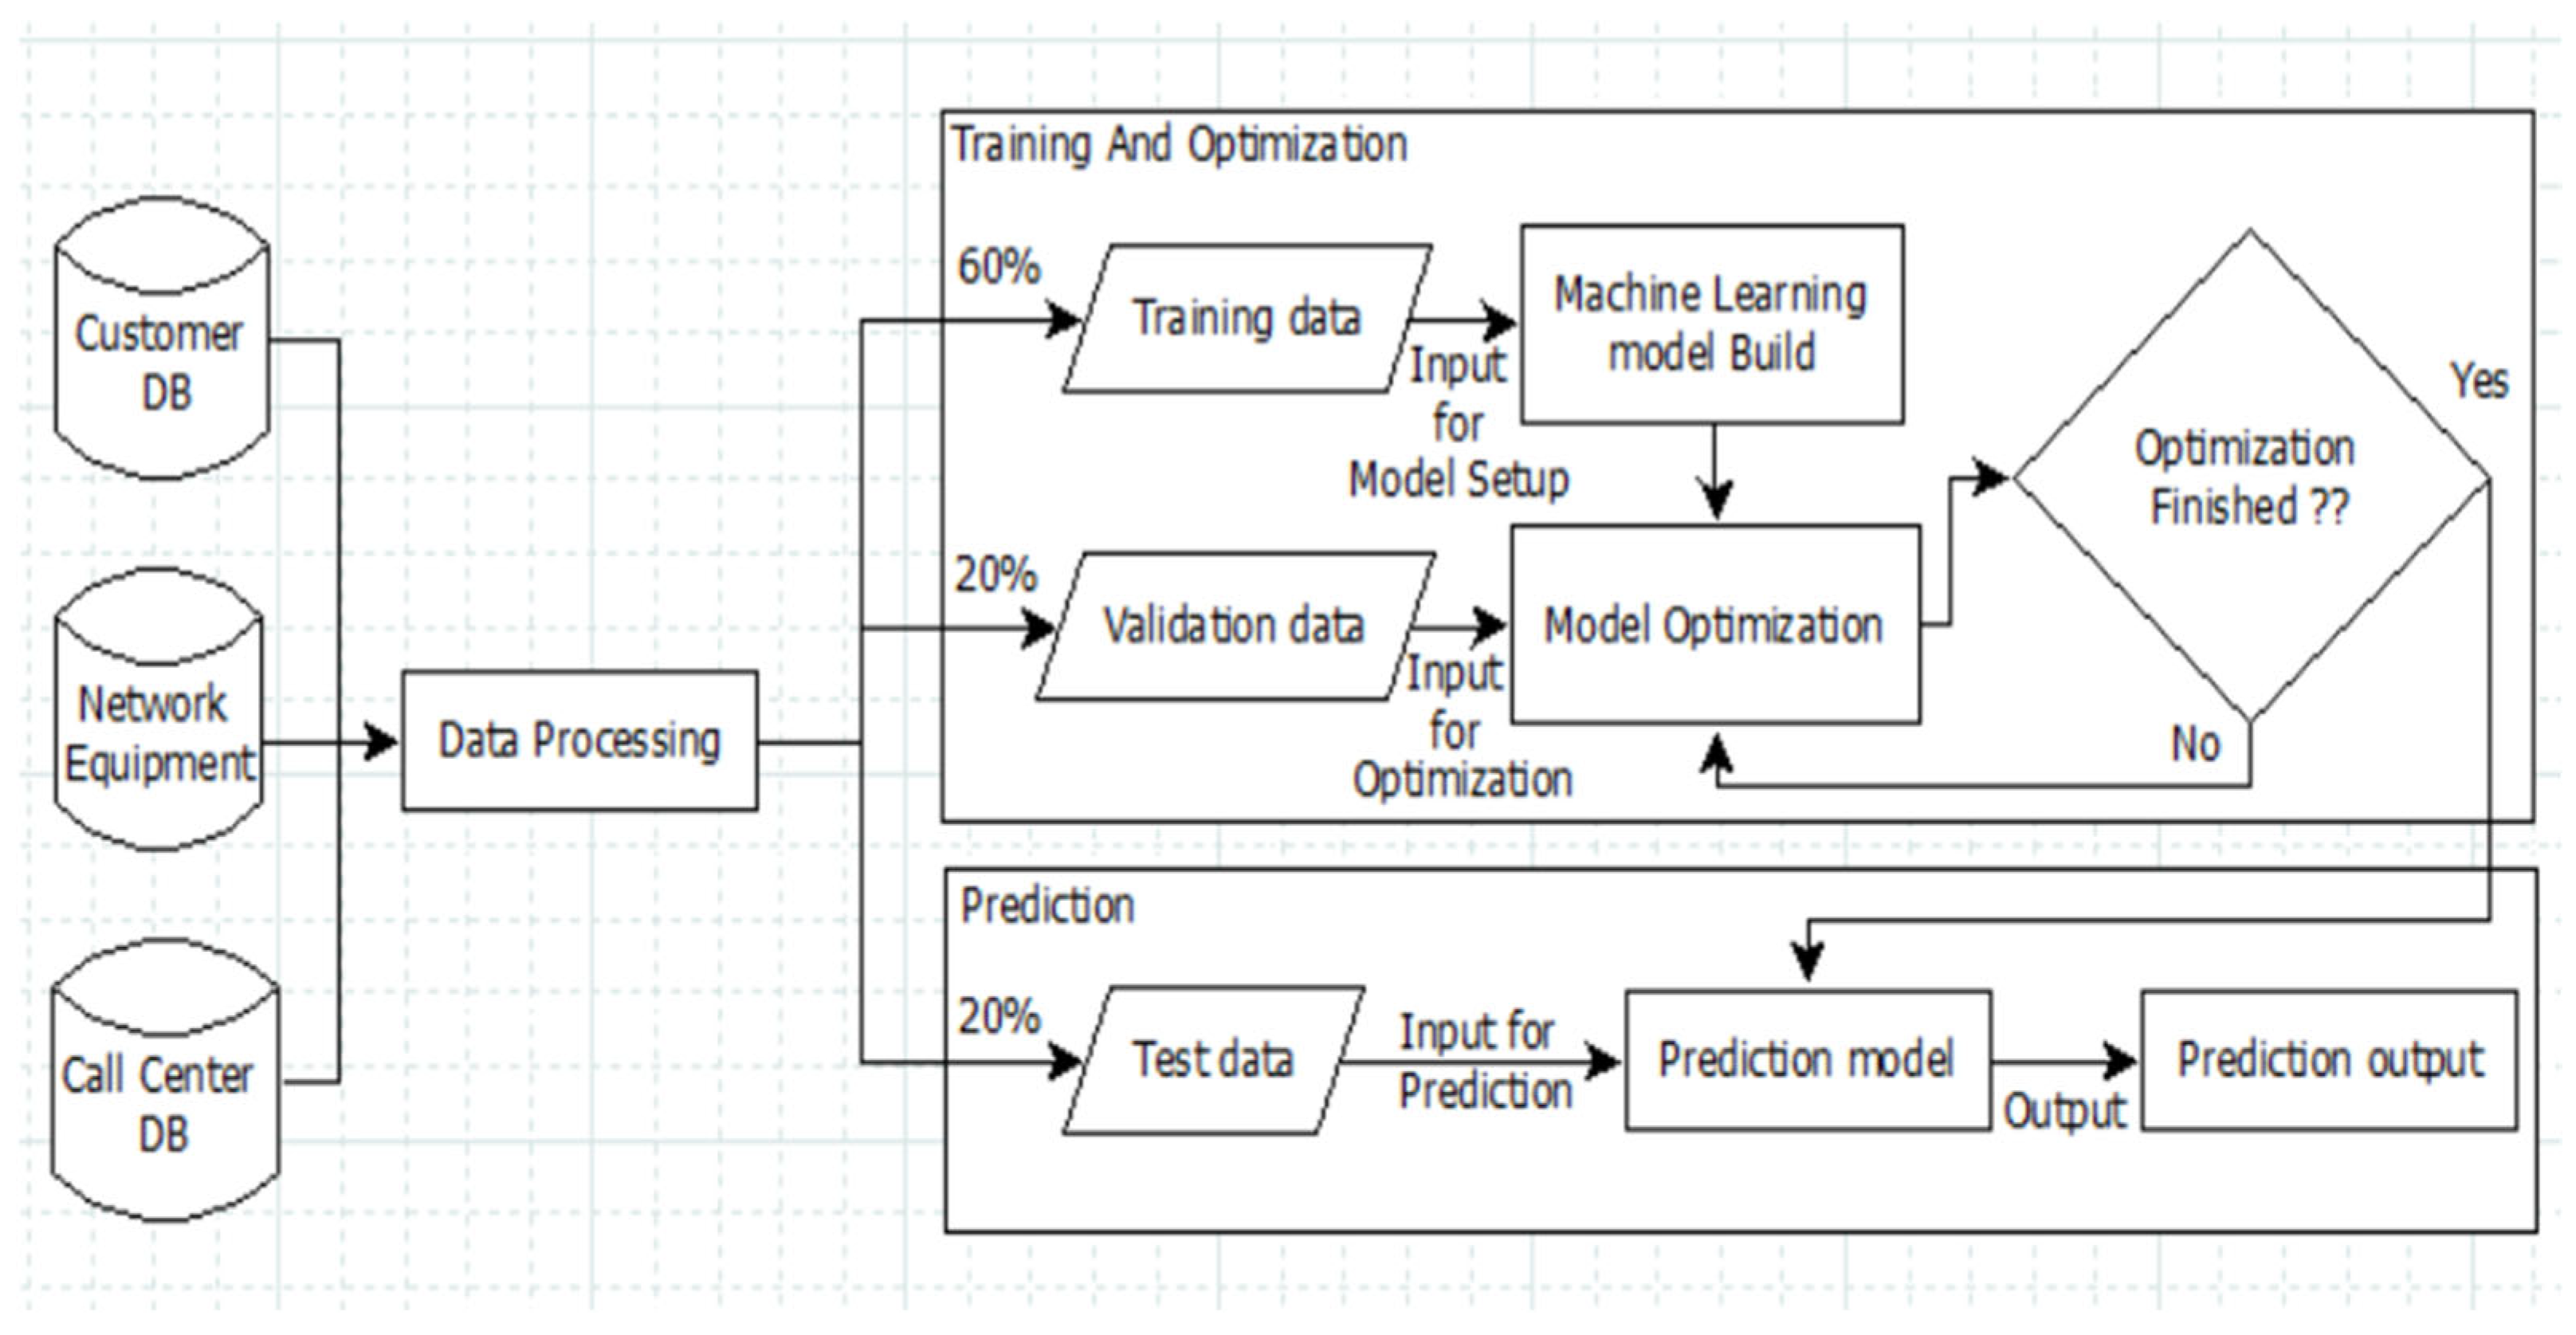
The dataset is evenly balanced between complaining customers and non-complainers, with each group comprising 50% of the data. To facilitate model development and evaluation, I partitioned the learning dataset into three distinct groups: a 60% training set, a 20% validation set, and another 20% test set.
Table 2 provides a summary of the definitions of each dataset, delineating their roles in the modeling process.
In the training set, we build the machine learning model using a selected optimizer based on the validation data values; as shown in the Figure 3, this phase will be repeated until we have an accurate result with an accurate model in the testing phase; we use the generated model to predict potential complaints and tack the related action on the spot.
The customer complaint prediction analysis focuses on the below main points:
  • Correlation between the dependent and independent variables (Device Module, Network Area, age, service kind and network coverage);
  • Decision making enhancement and new service launches (new bundles with customized apps, videos, TV channel…);
  • New marketing and broadcast promotions: dedicated offers for subscribers predicted to complain or experiencing service failure.

5. Modeling

5.1. Definition of Logistic Regression

Logistic regression was proposed in the late 1960s and early 1970s (Cabrera, 1994), and it became routinely available in statistical packages in the early 1980s [16].
Logistic regression is a statistical method for binary classification. It extends the idea of linear regression to scenarios where the dependent variable is categorical, not continuous. Typically, linear regression model is used when the outcome to be predicted belongs to one of two possible categories, such as “yes” or “no”, “success” or “failure”, “win” or “lose”, etc.
Logistic regression, on the other hand, is used to predict binary outcomes, such as whether a patient has a disease or not, or whether a customer will churn or leave a complaint.
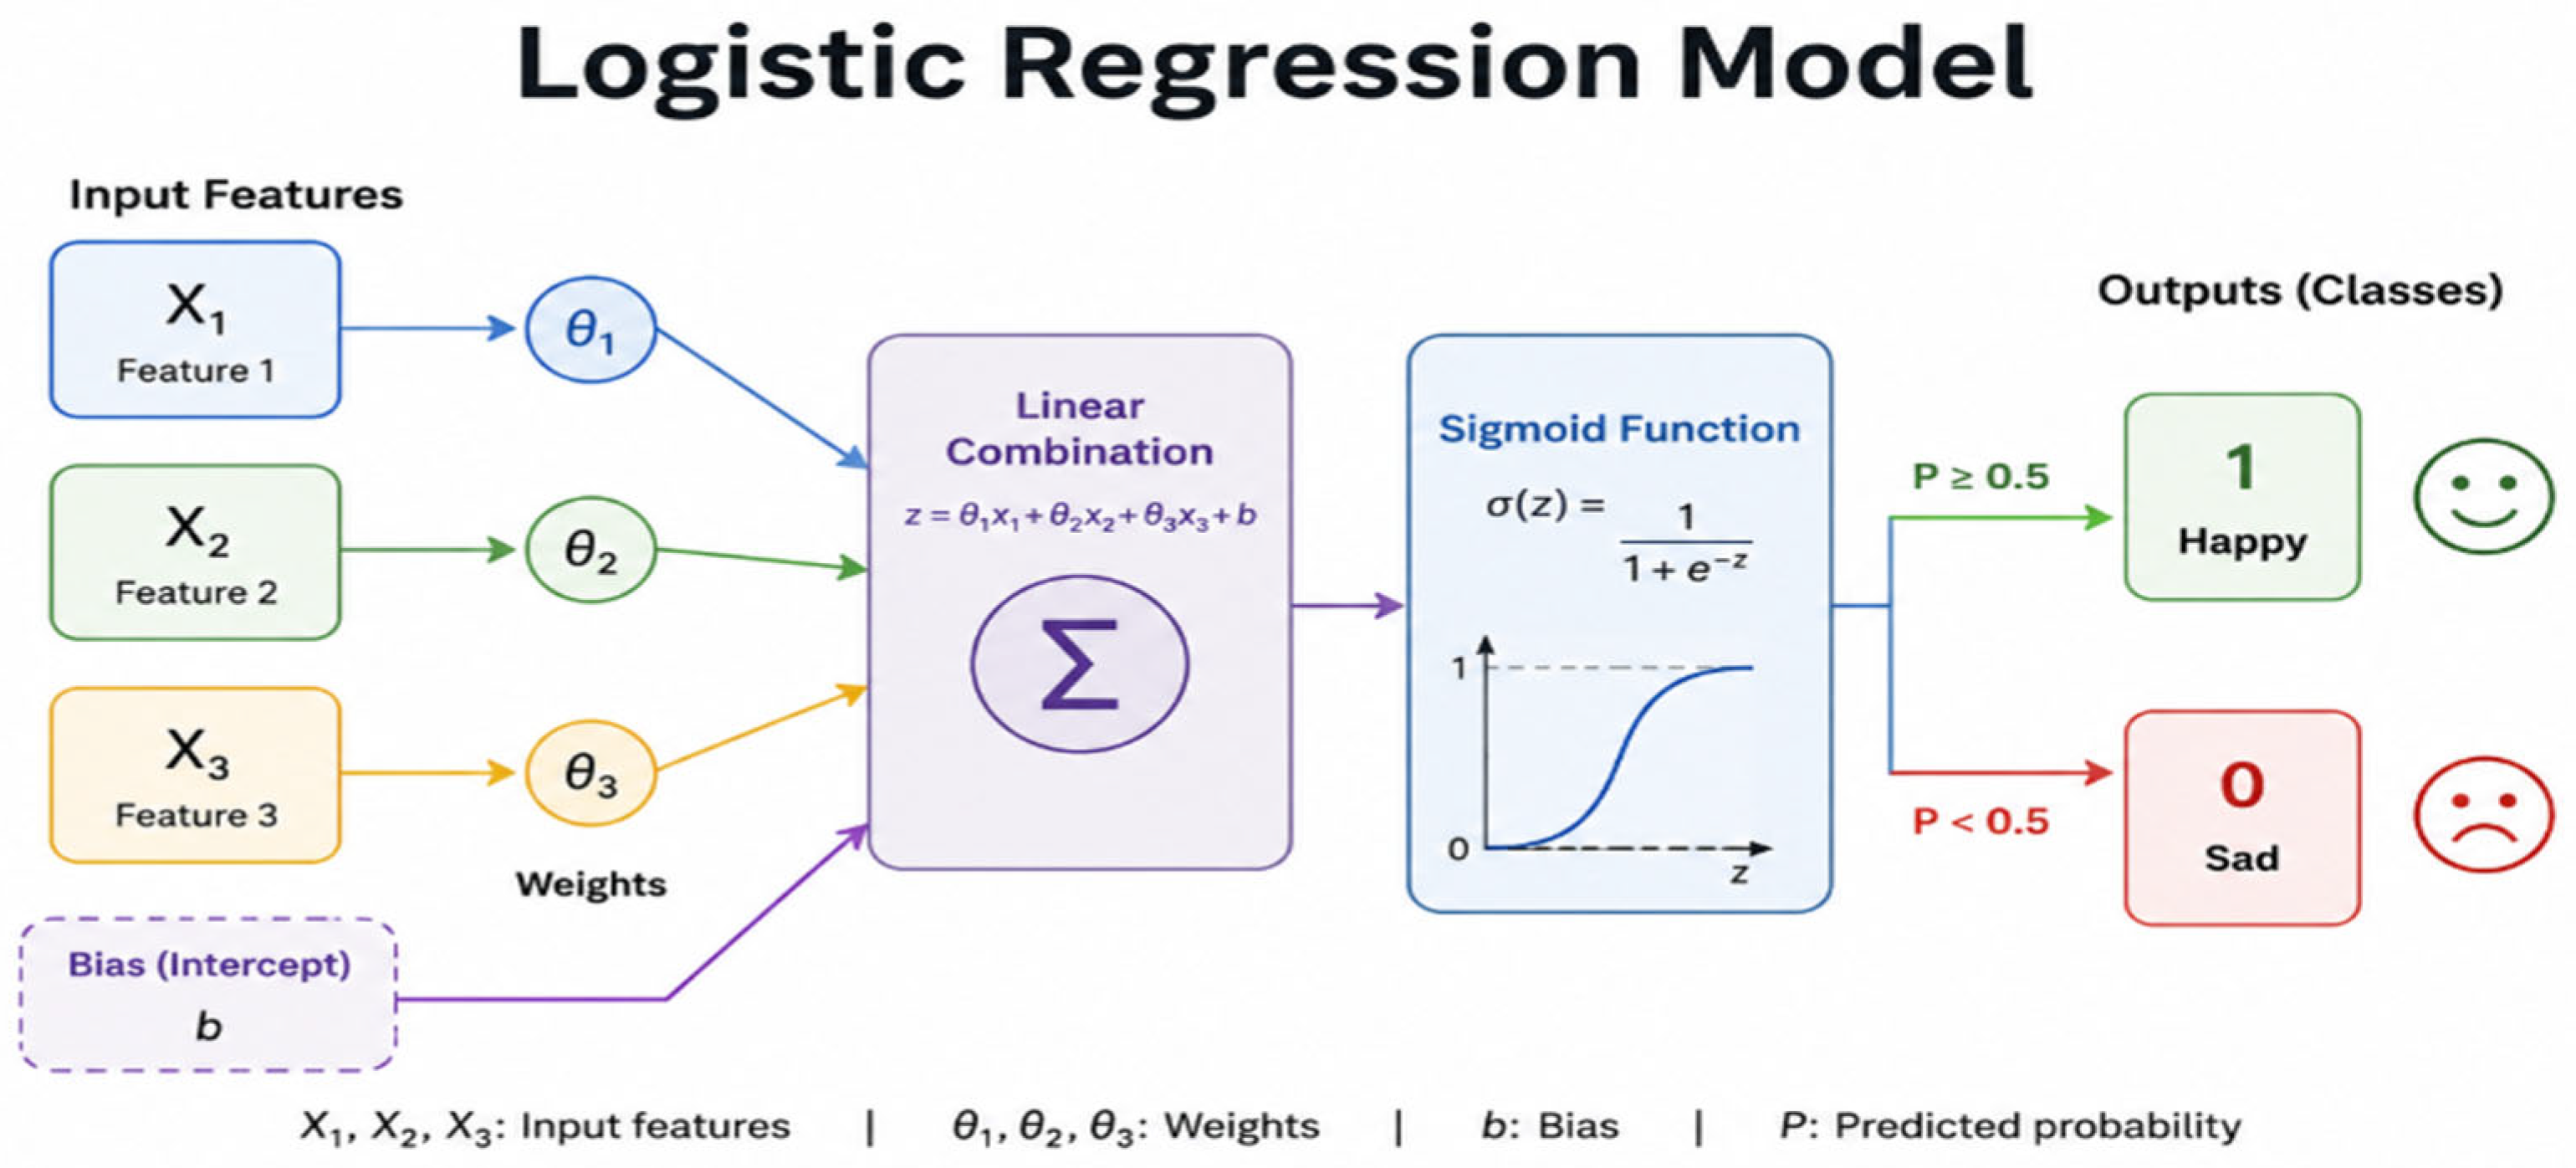
According to Peng et al. (2002), logistic regression relies on the mathematical concept of logarithms, particularly the natural logarithm of coefficients [17]. Figure 4 presents the conceptual architecture of the Logistic Regression model, where multiple input features are weighted and combined to estimate the probability of class membership, enabling binary classification of customer complaints.
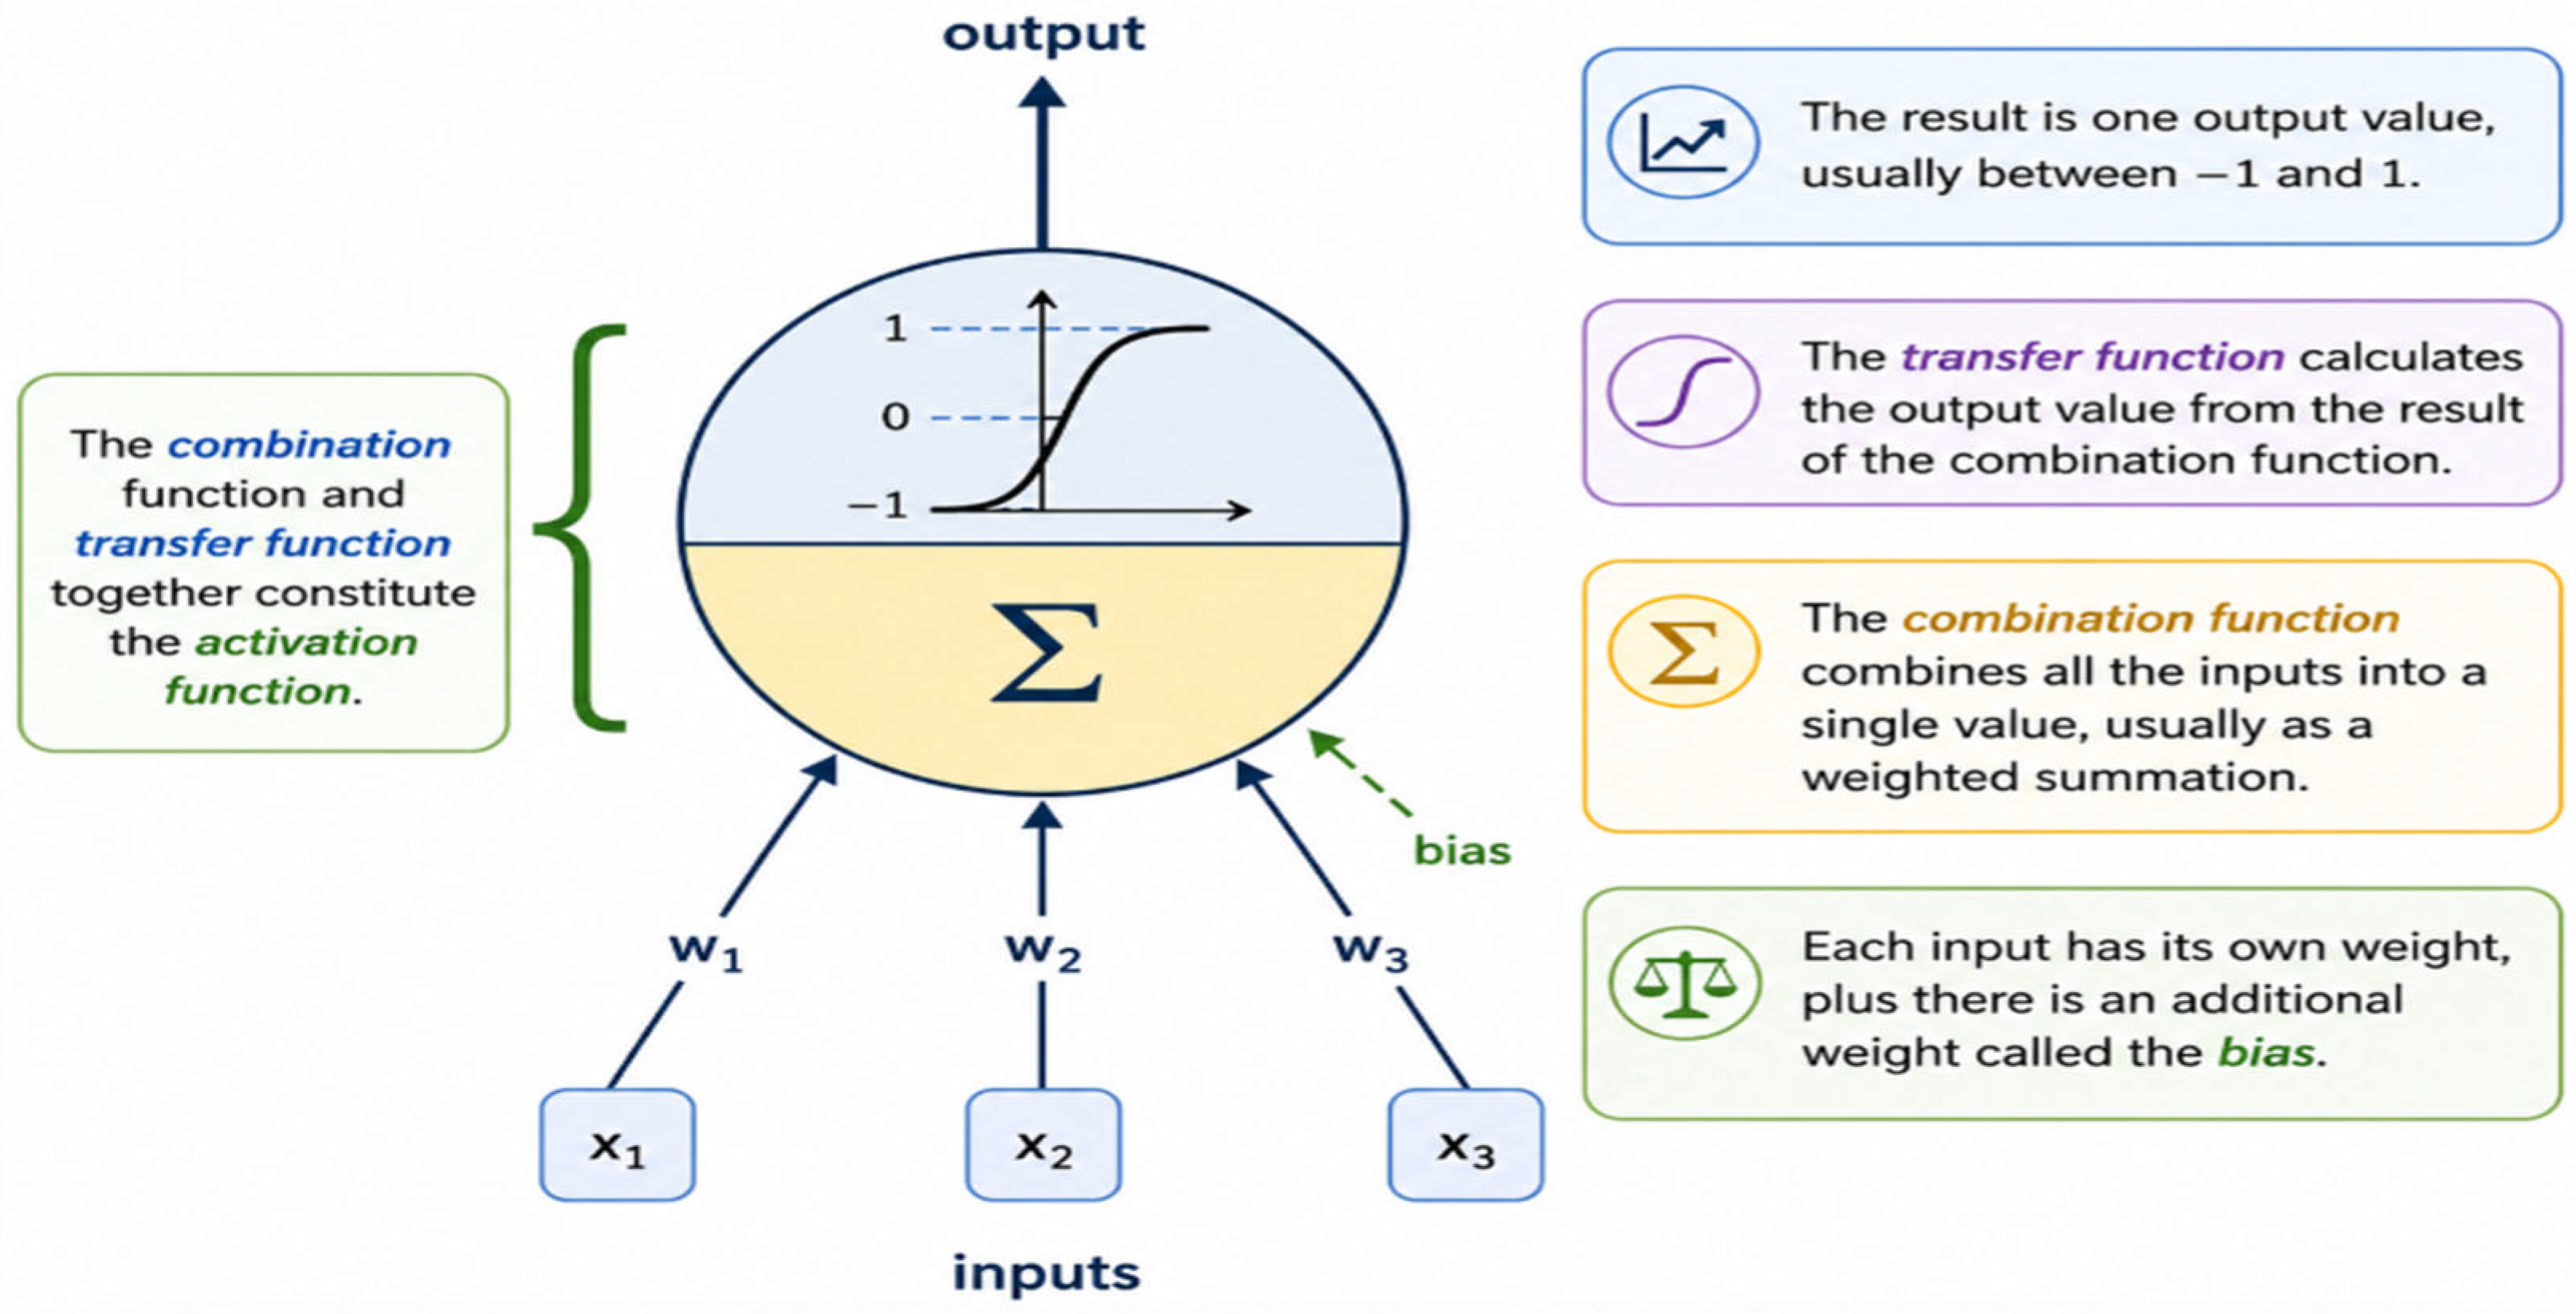
To fit a logistic regression model, you need to have a dataset with one or more independent variables (Figure 5) and a binary dependent variable (0, 1 or yes, no). The independent variables can be either continuous or categorical, but the dependent variable must be binary. Once you have your dataset, you can fit the logistic regression model by using an optimization algorithm (Adadelta, Adamax, Adam, etc.) or specific activation functions (Sigmoid, Softmax, ReLU) to maximize the likelihood of the observed data [18].

5.2. Activation Functions

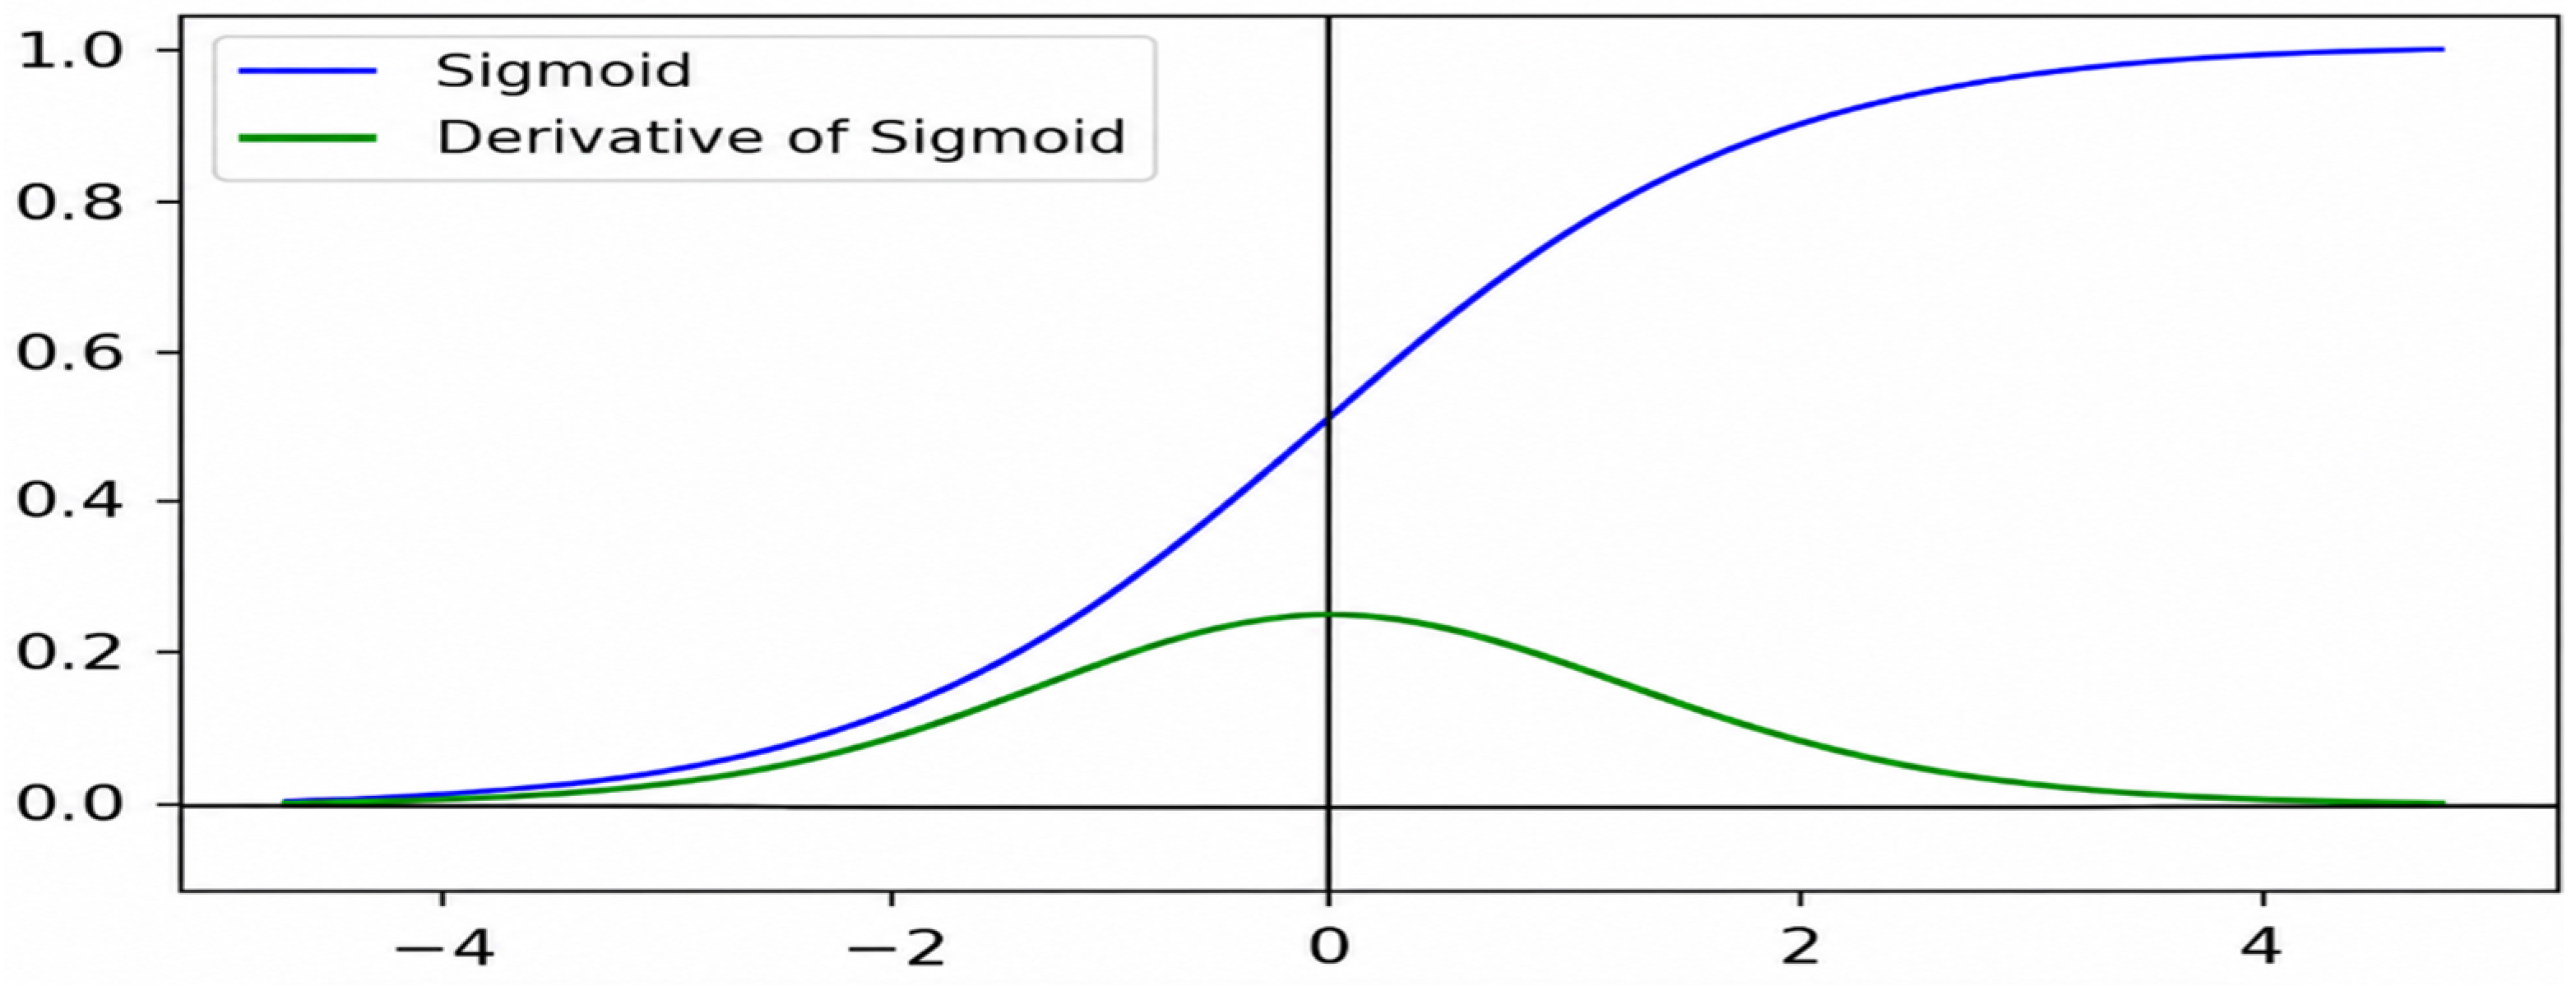
Activation functions play a critical role in shaping the architecture of ANNs, providing them with non-linear characteristics essential for learning complex representations. In the early stages of ANN development, the Sigmoid function emerged as the predominant choice for activation [20]. However, as ANN applications evolved across various domains, the shortcomings of Sigmoid, particularly its susceptibility to the vanishing gradient problem due to its small derivative, became apparent. Consequently, alternative activation functions like Softmax and ReLU gained prominence. Notably, ReLU offers a derivative of one for positive inputs, addressing some of the limitations encountered with Sigmoid [21].
  • Sigmoid
    The Sigmoid activation function serves to transform input values from the range (−∞; +∞) to a bounded range between [0;1]. It exhibits inherent non-linearity and possesses a smooth derivative, as depicted in Figure 6. However, due to its output being constrained within the [0;1] range, the output of each neuron is compressed, potentially leading to vanishing gradients, particularly in deep networks [22].
    σ x = 1 1 + e x
  • ReLU
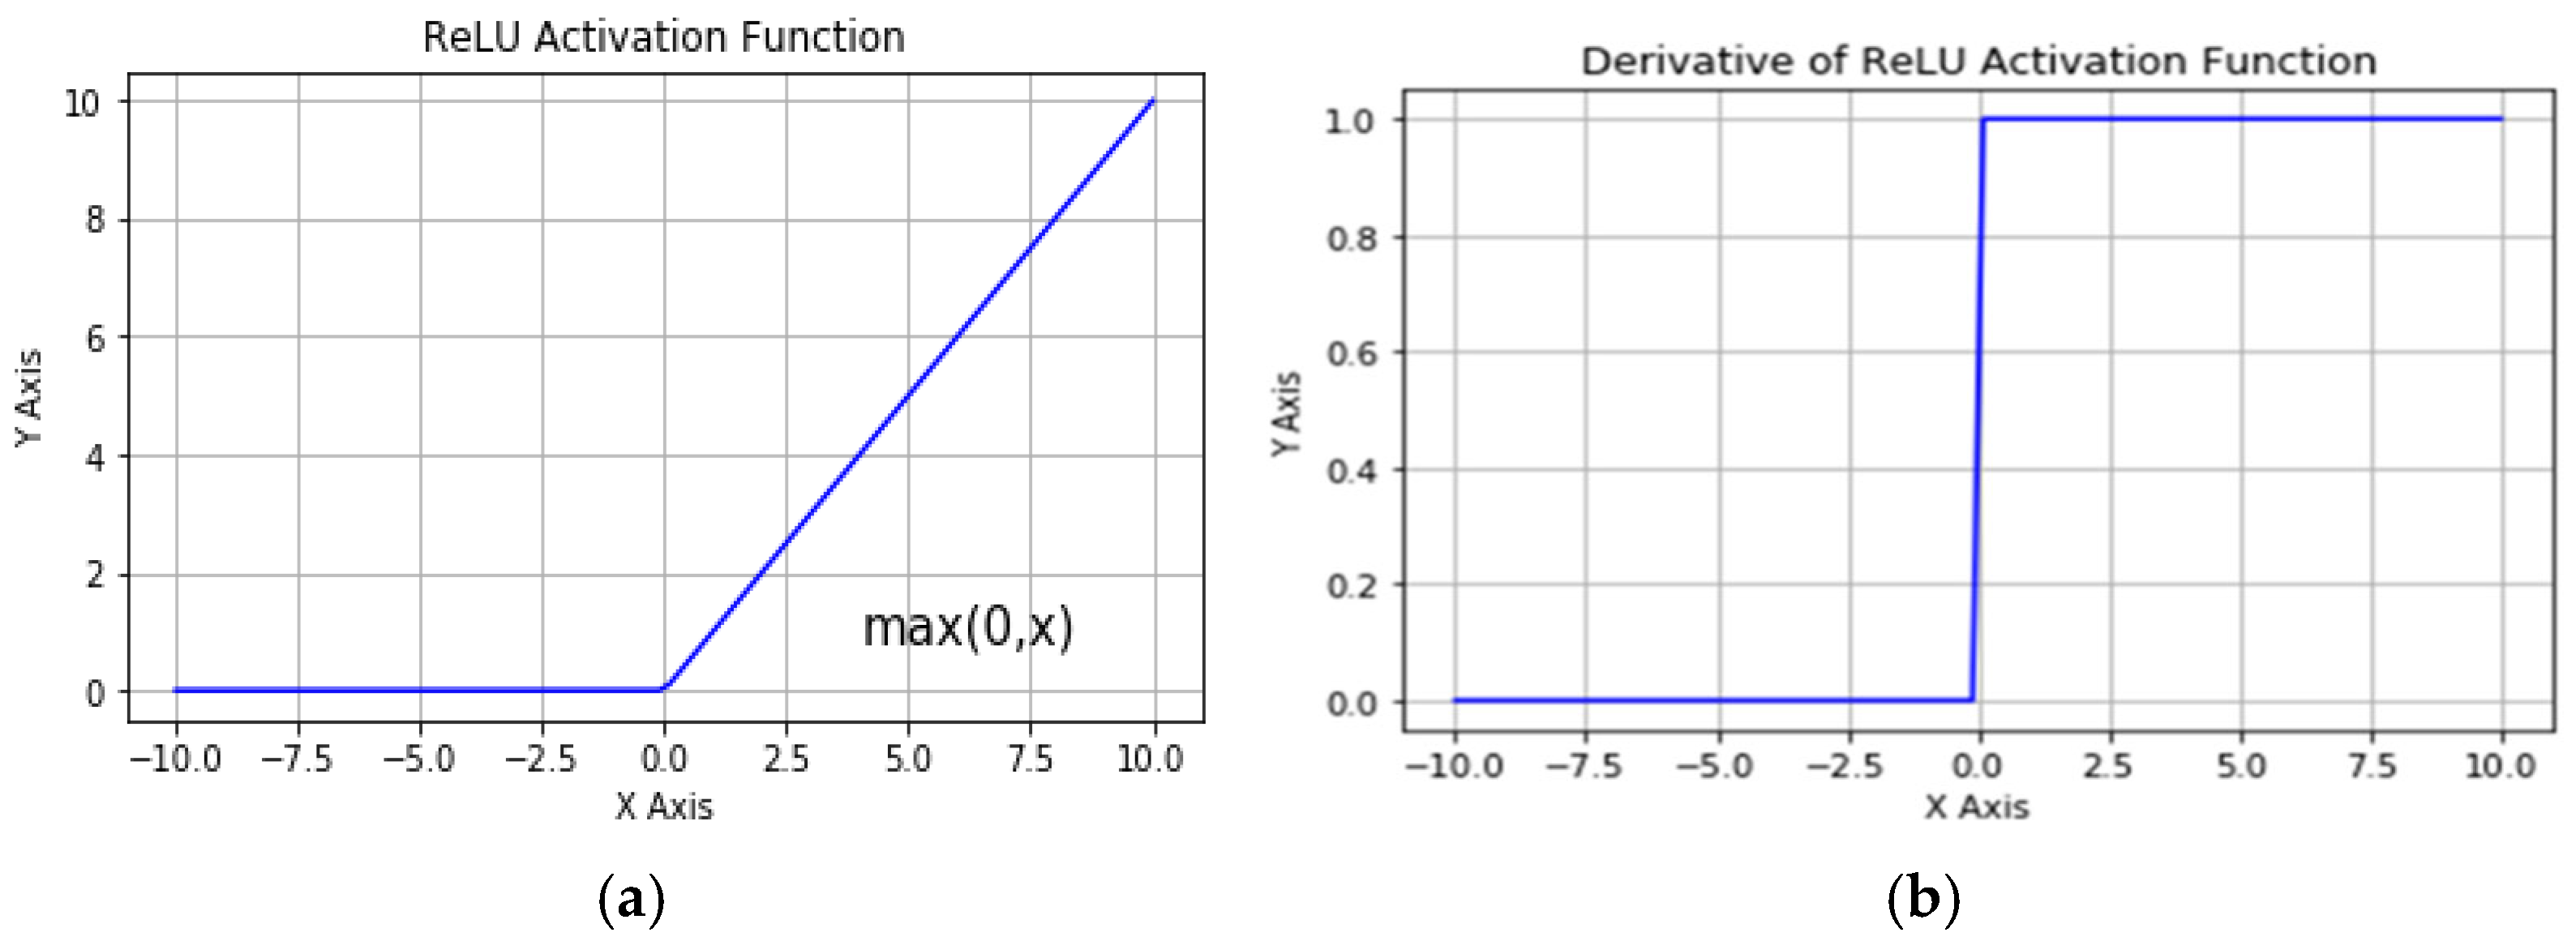
    ReLU, a linear activation function, effectively nullifies any negative input, preserving positive values unchanged. This simplicity is a notable advantage; however, the drawback lies in its tendency to transform all negative values to zero. This issue, known as “Dying ReLU” Figure 7, is a specific instance of the vanishing gradient problem. Once a neuron becomes negative, it tends to remain inactive, hindering its ability to recover and contribute to the network’s learning process [23].
    R e L u   x = max ( 0 , x )
  • Softmax
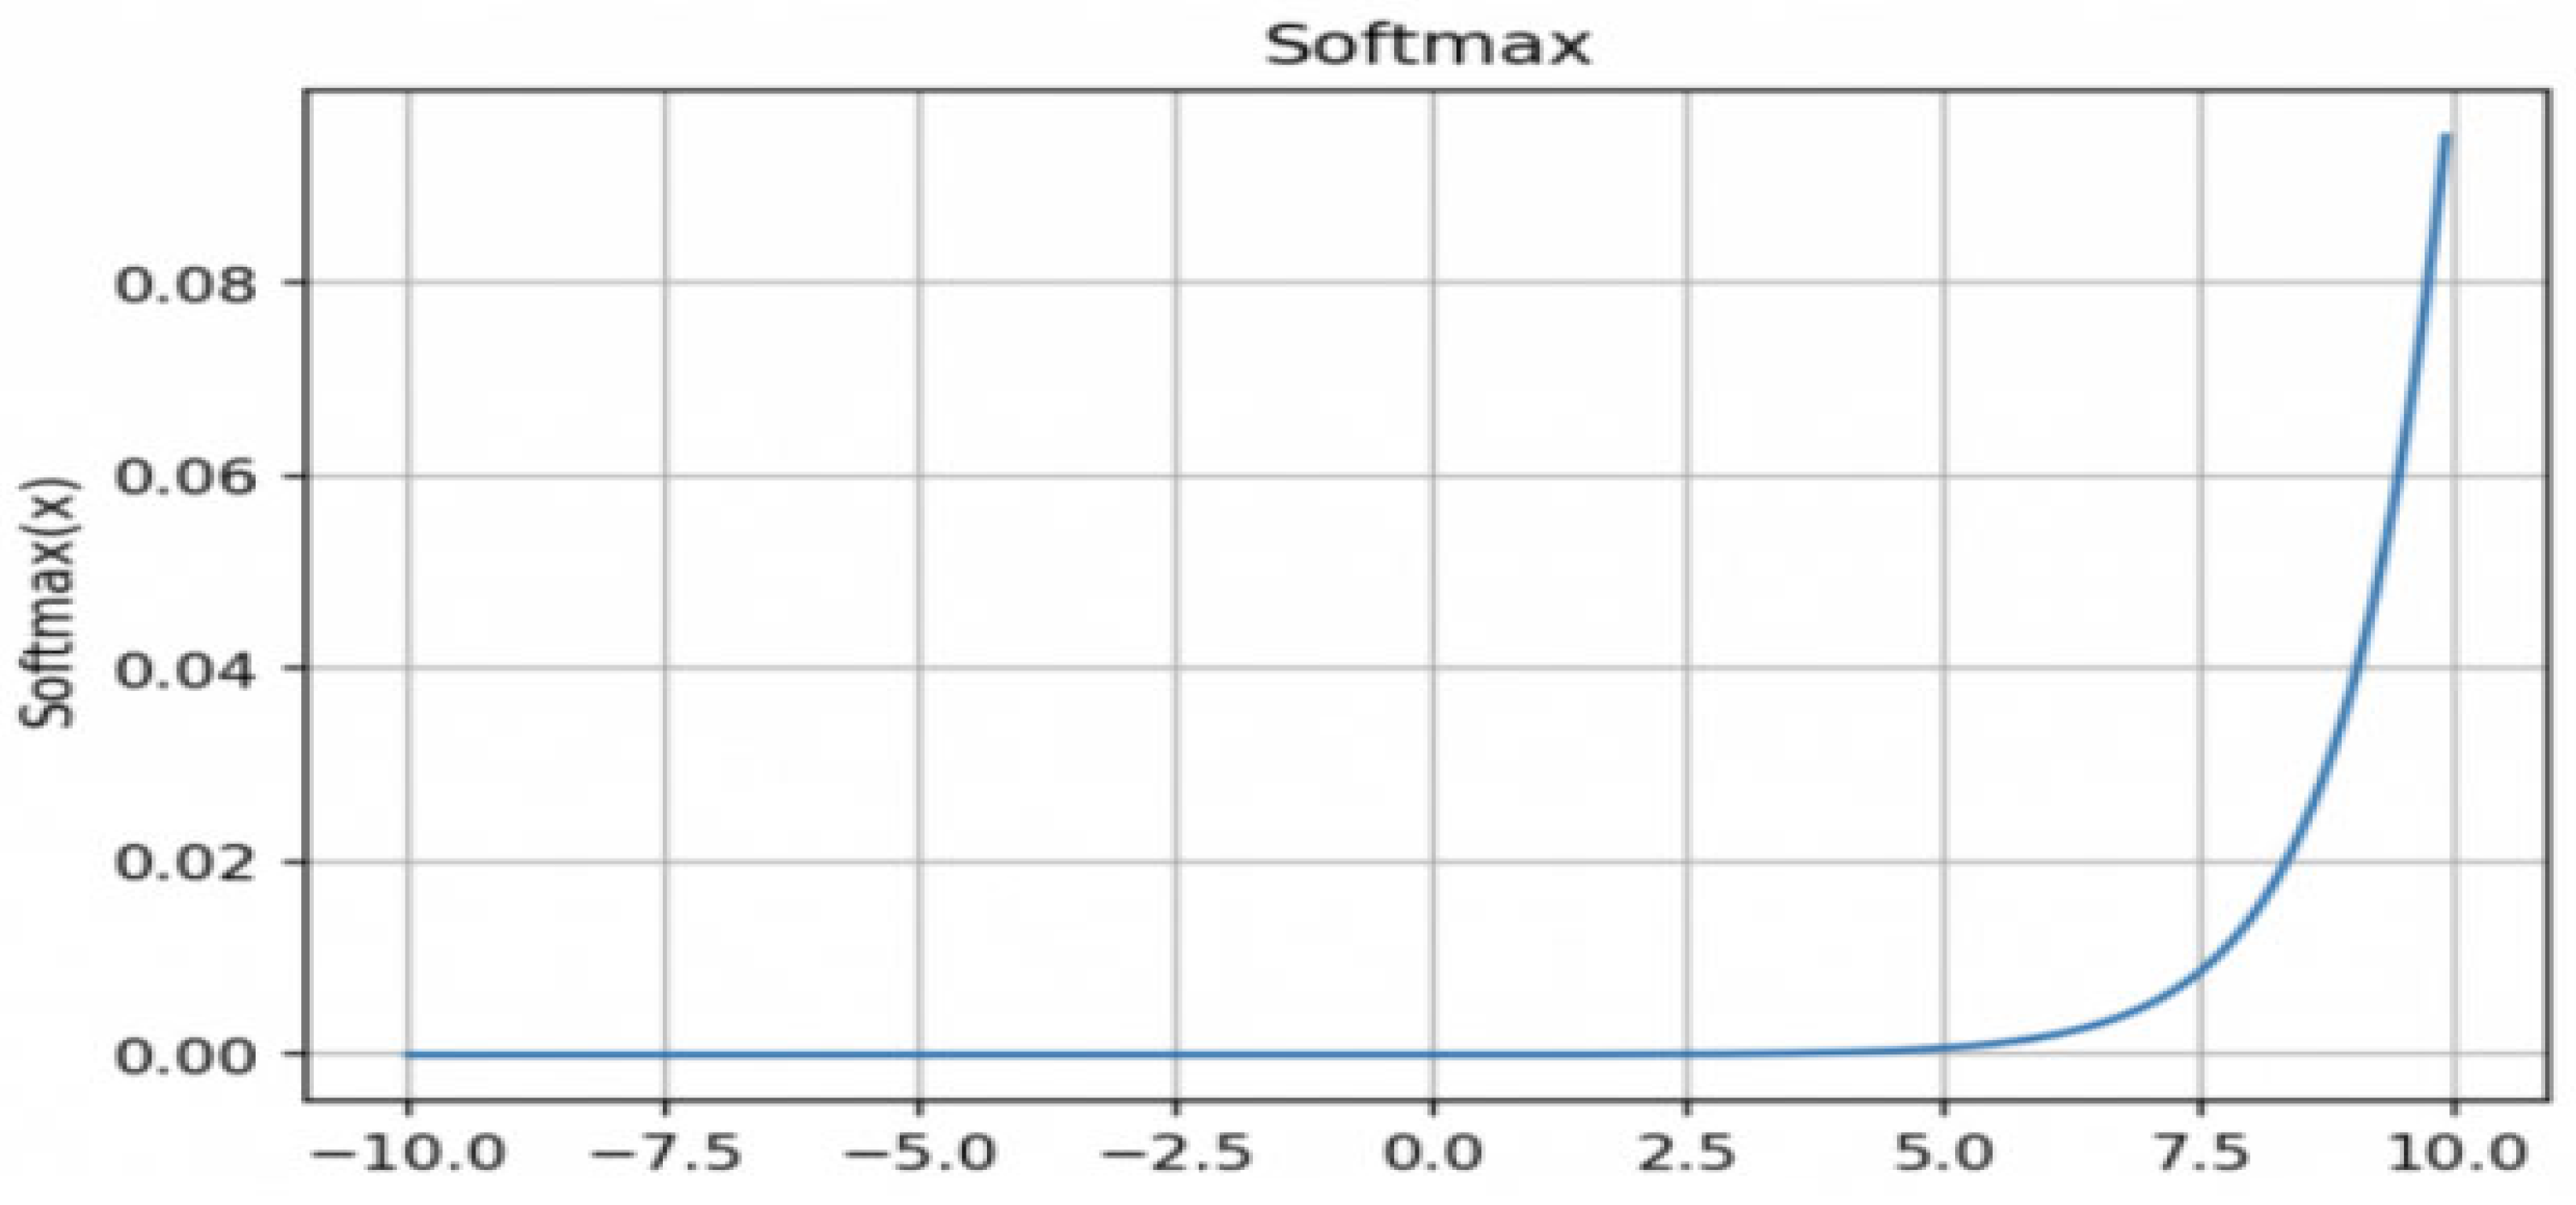
    The Softmax activation function is primarily employed in the output layer, especially in neural networks designed for classification tasks. In this configuration in Figure 8, each Softmax unit corresponds to a specific class in a multi-class classification problem. For instance, in a K-class classification scenario, such as the MNIST dataset where digits are classified, K represents the number of possible classes (e.g., K = 10 for digits 0 through 9). Each Softmax unit “i” computes the probability that the input belongs to class-i, providing a probability distribution over all possible classes [24].
    σ z j = e z j i = 1 K e z i

6. Methodology

6.1. Dataset Sample

This database was employed to collect information required for further analysis. Table 3 presents a sample of this dataset.
To strengthen its capabilities, we predominantly employed ReLU as the activation function and the input and hidden layers, while Softmax was utilized in the output layer. We conducted a comparative analysis across various optimizers paired with different learning grades to identify the most suitable optimizer for our project.

6.2. Analysis of ADADELTA Optimizer Learning Rate = 0.1, Epochs = 1000

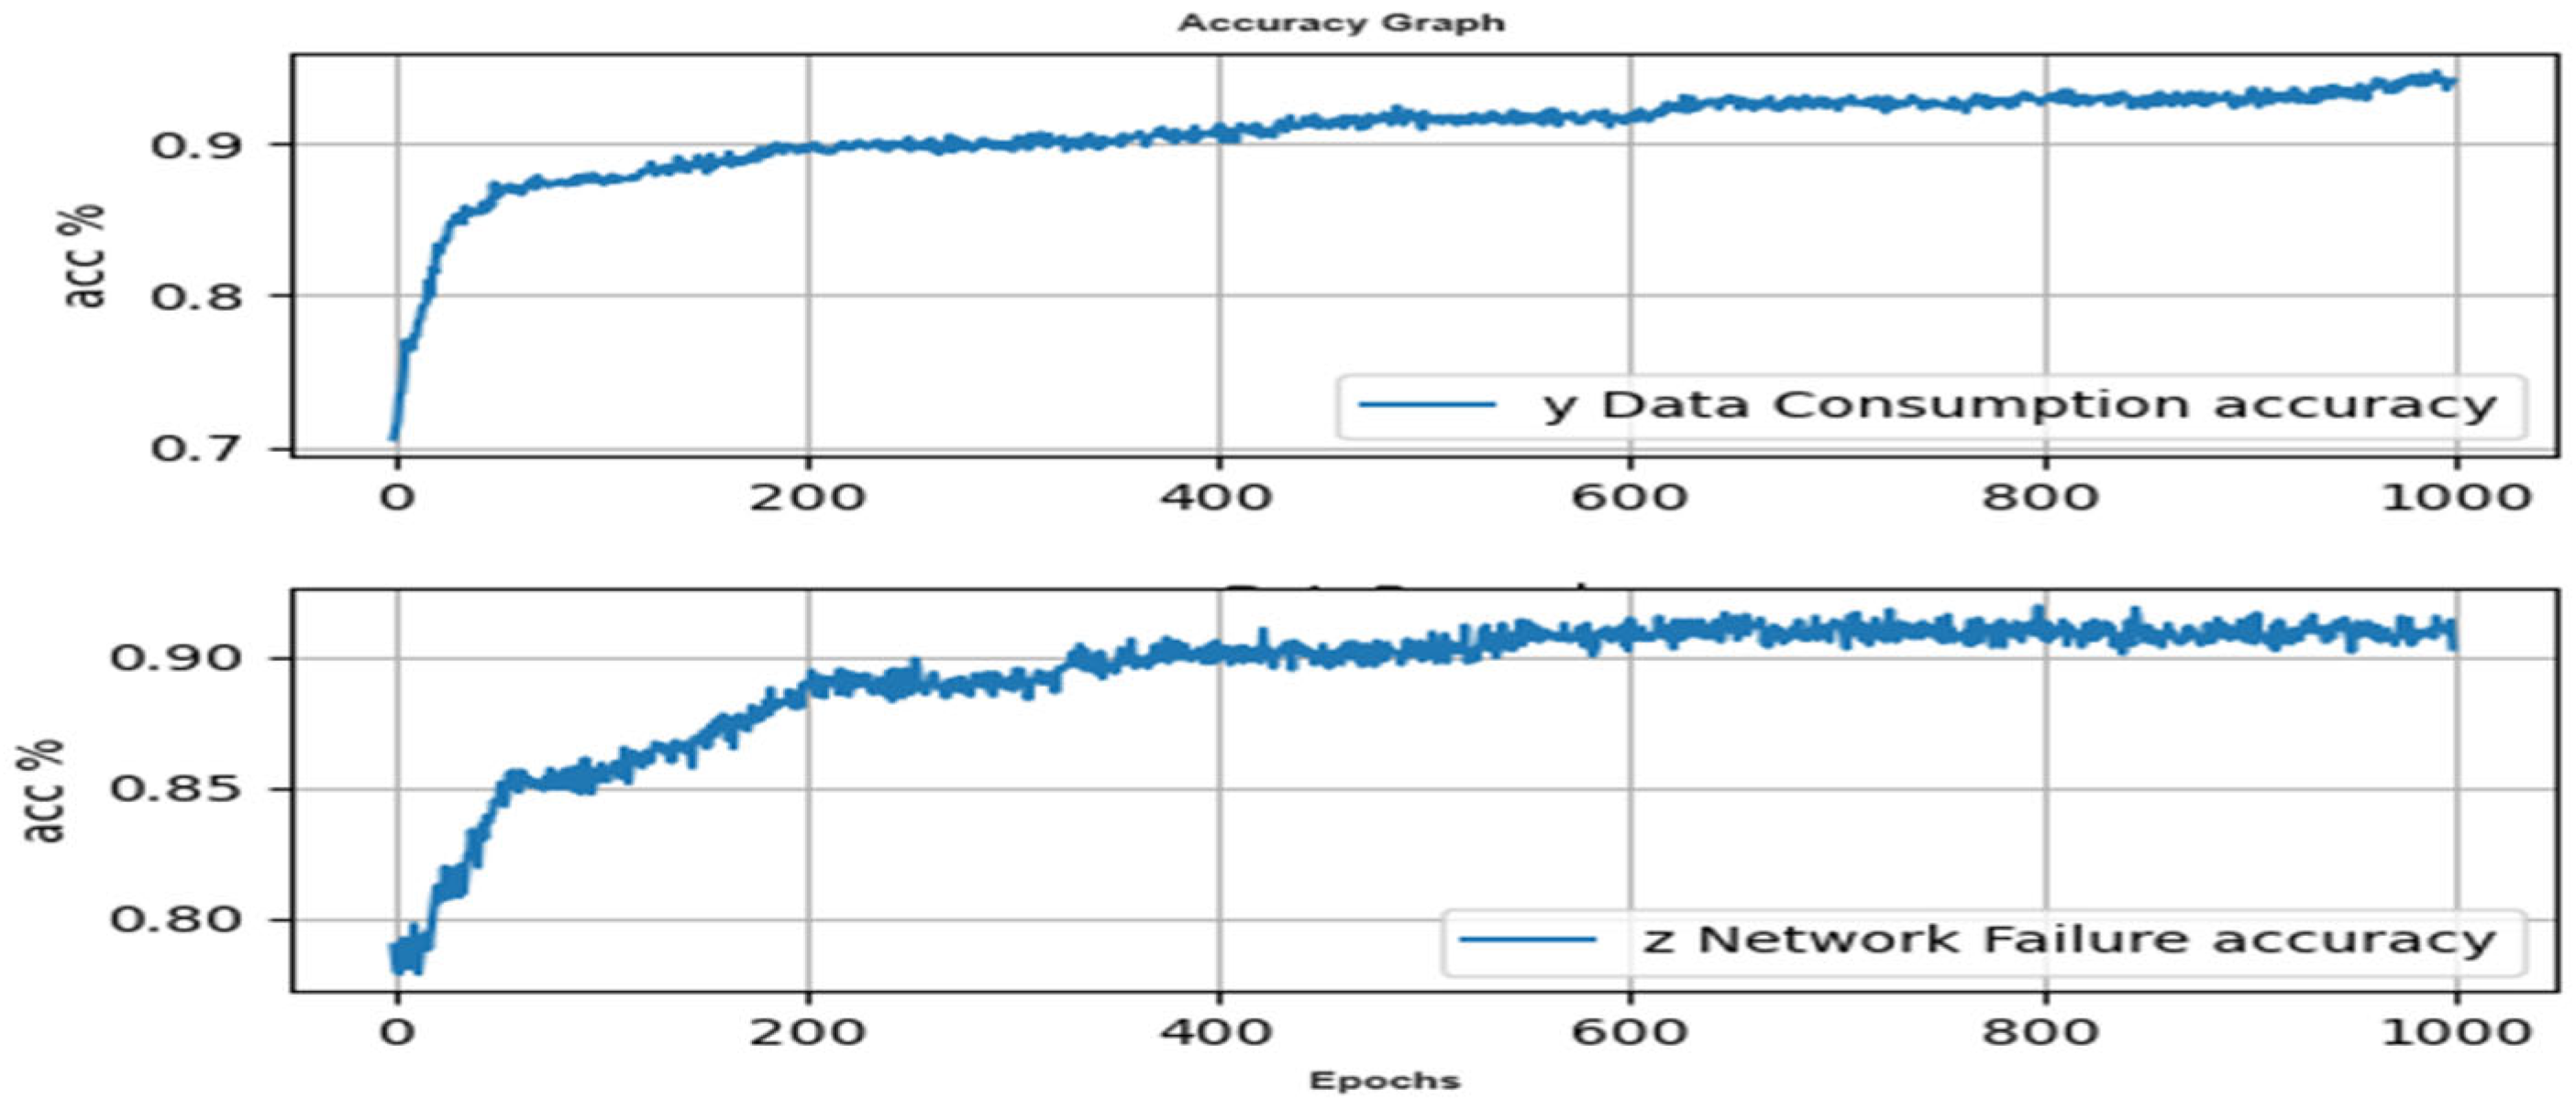
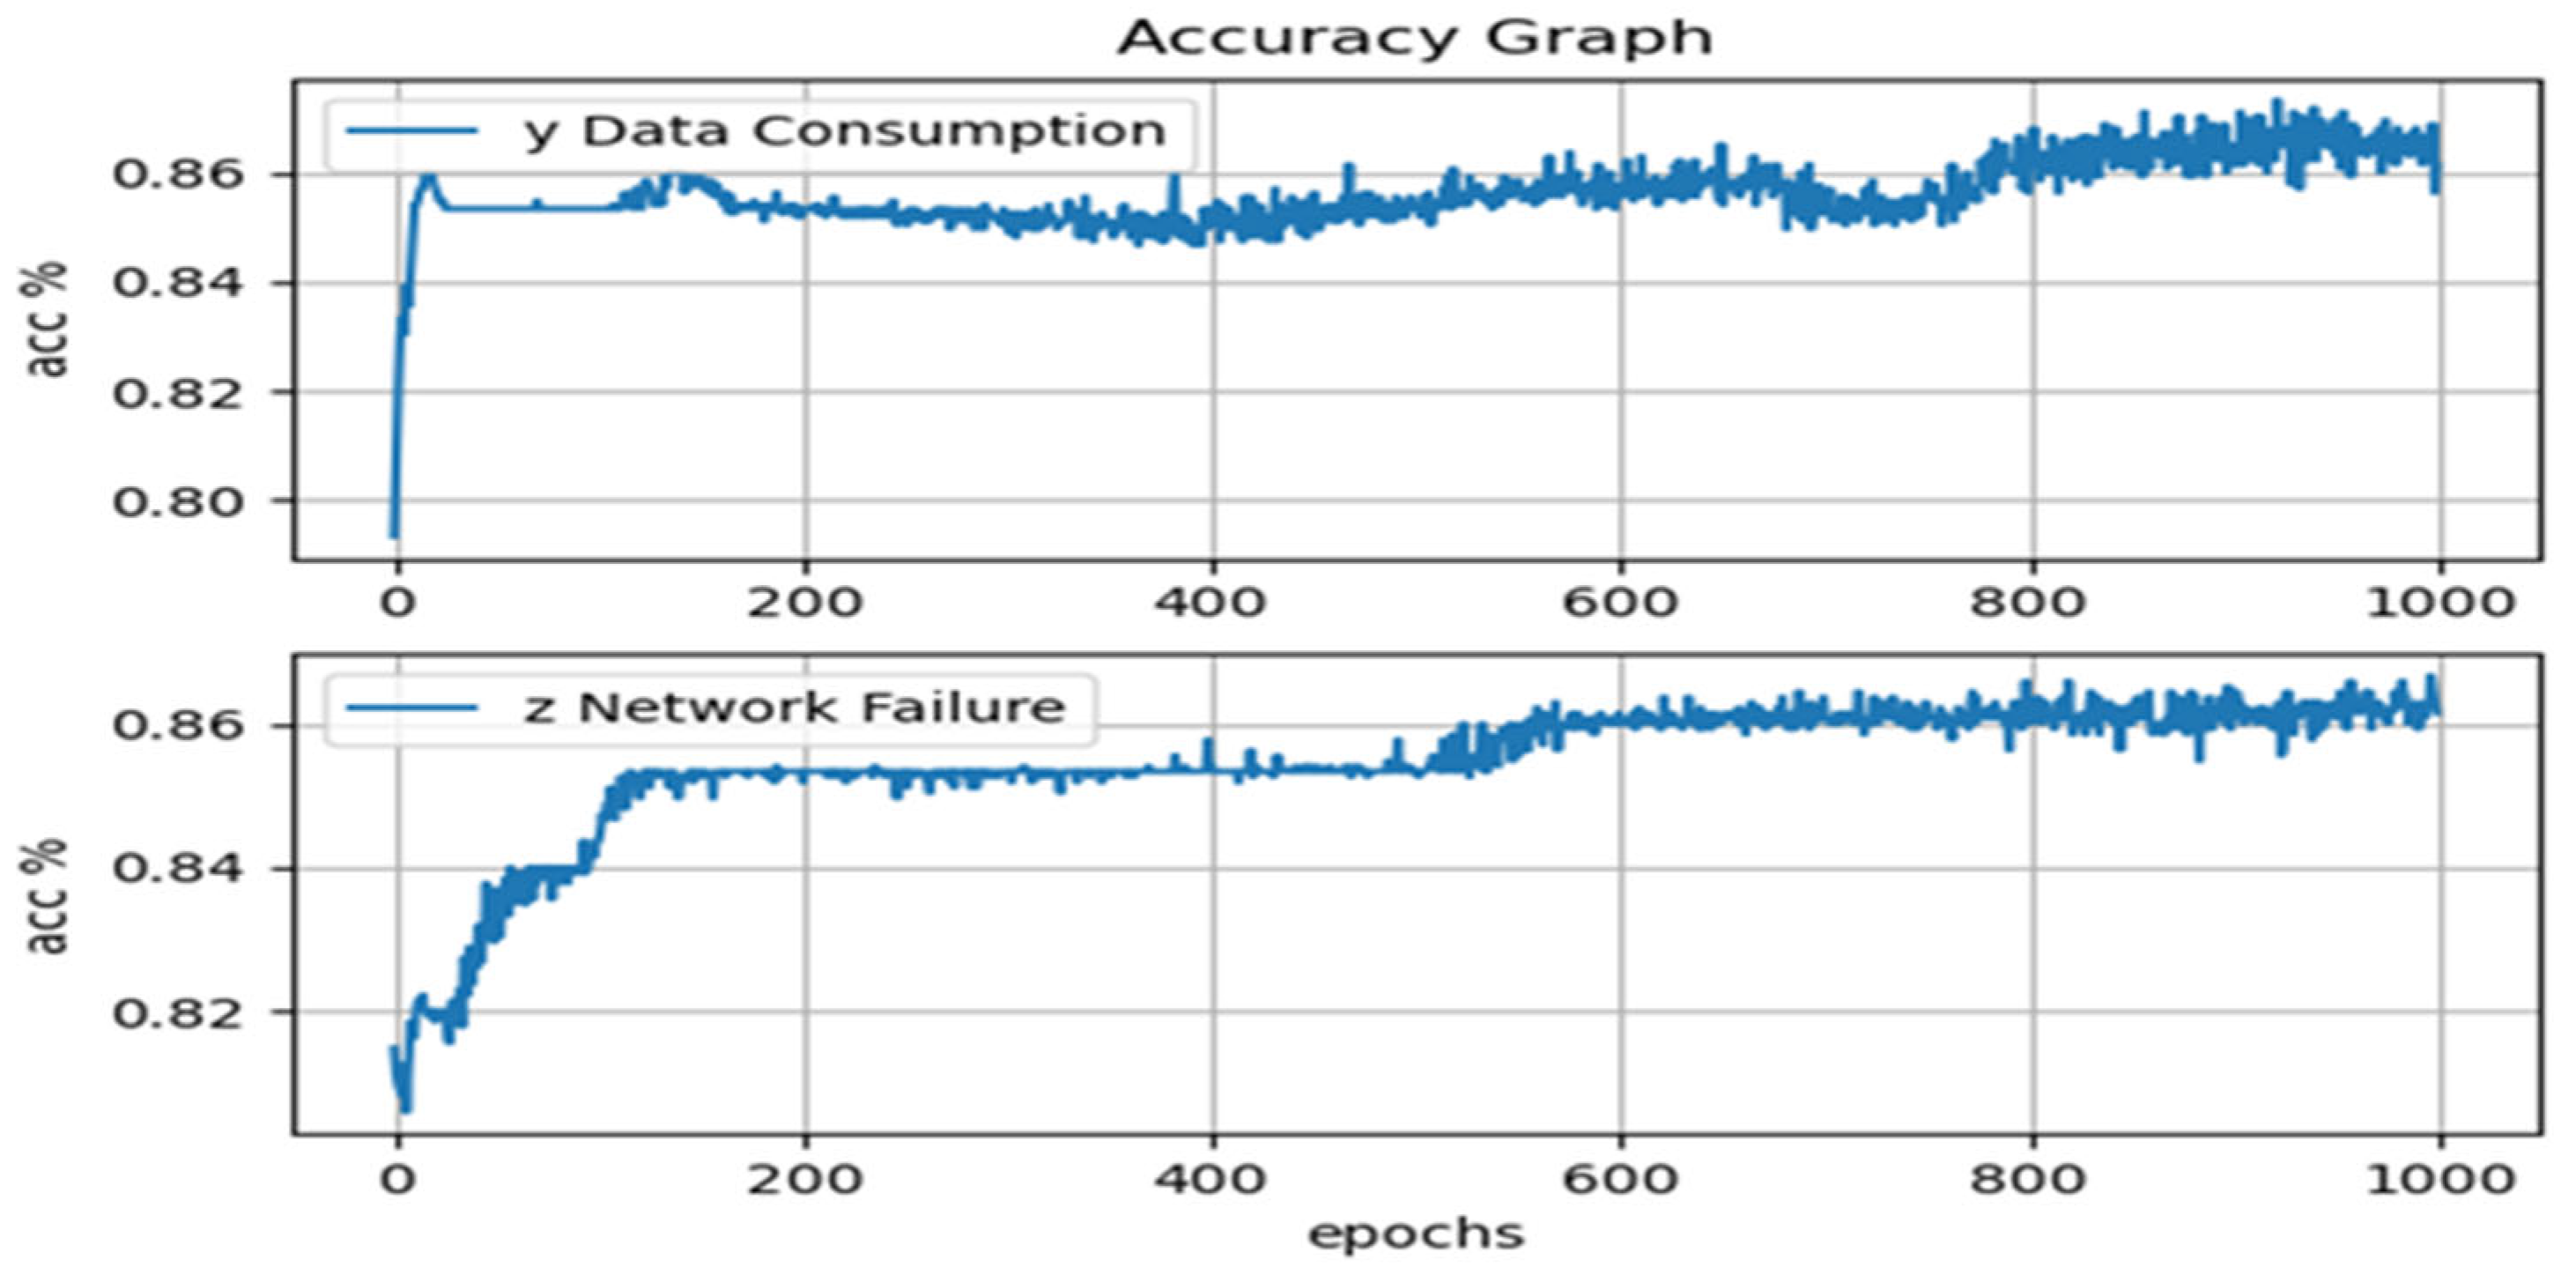
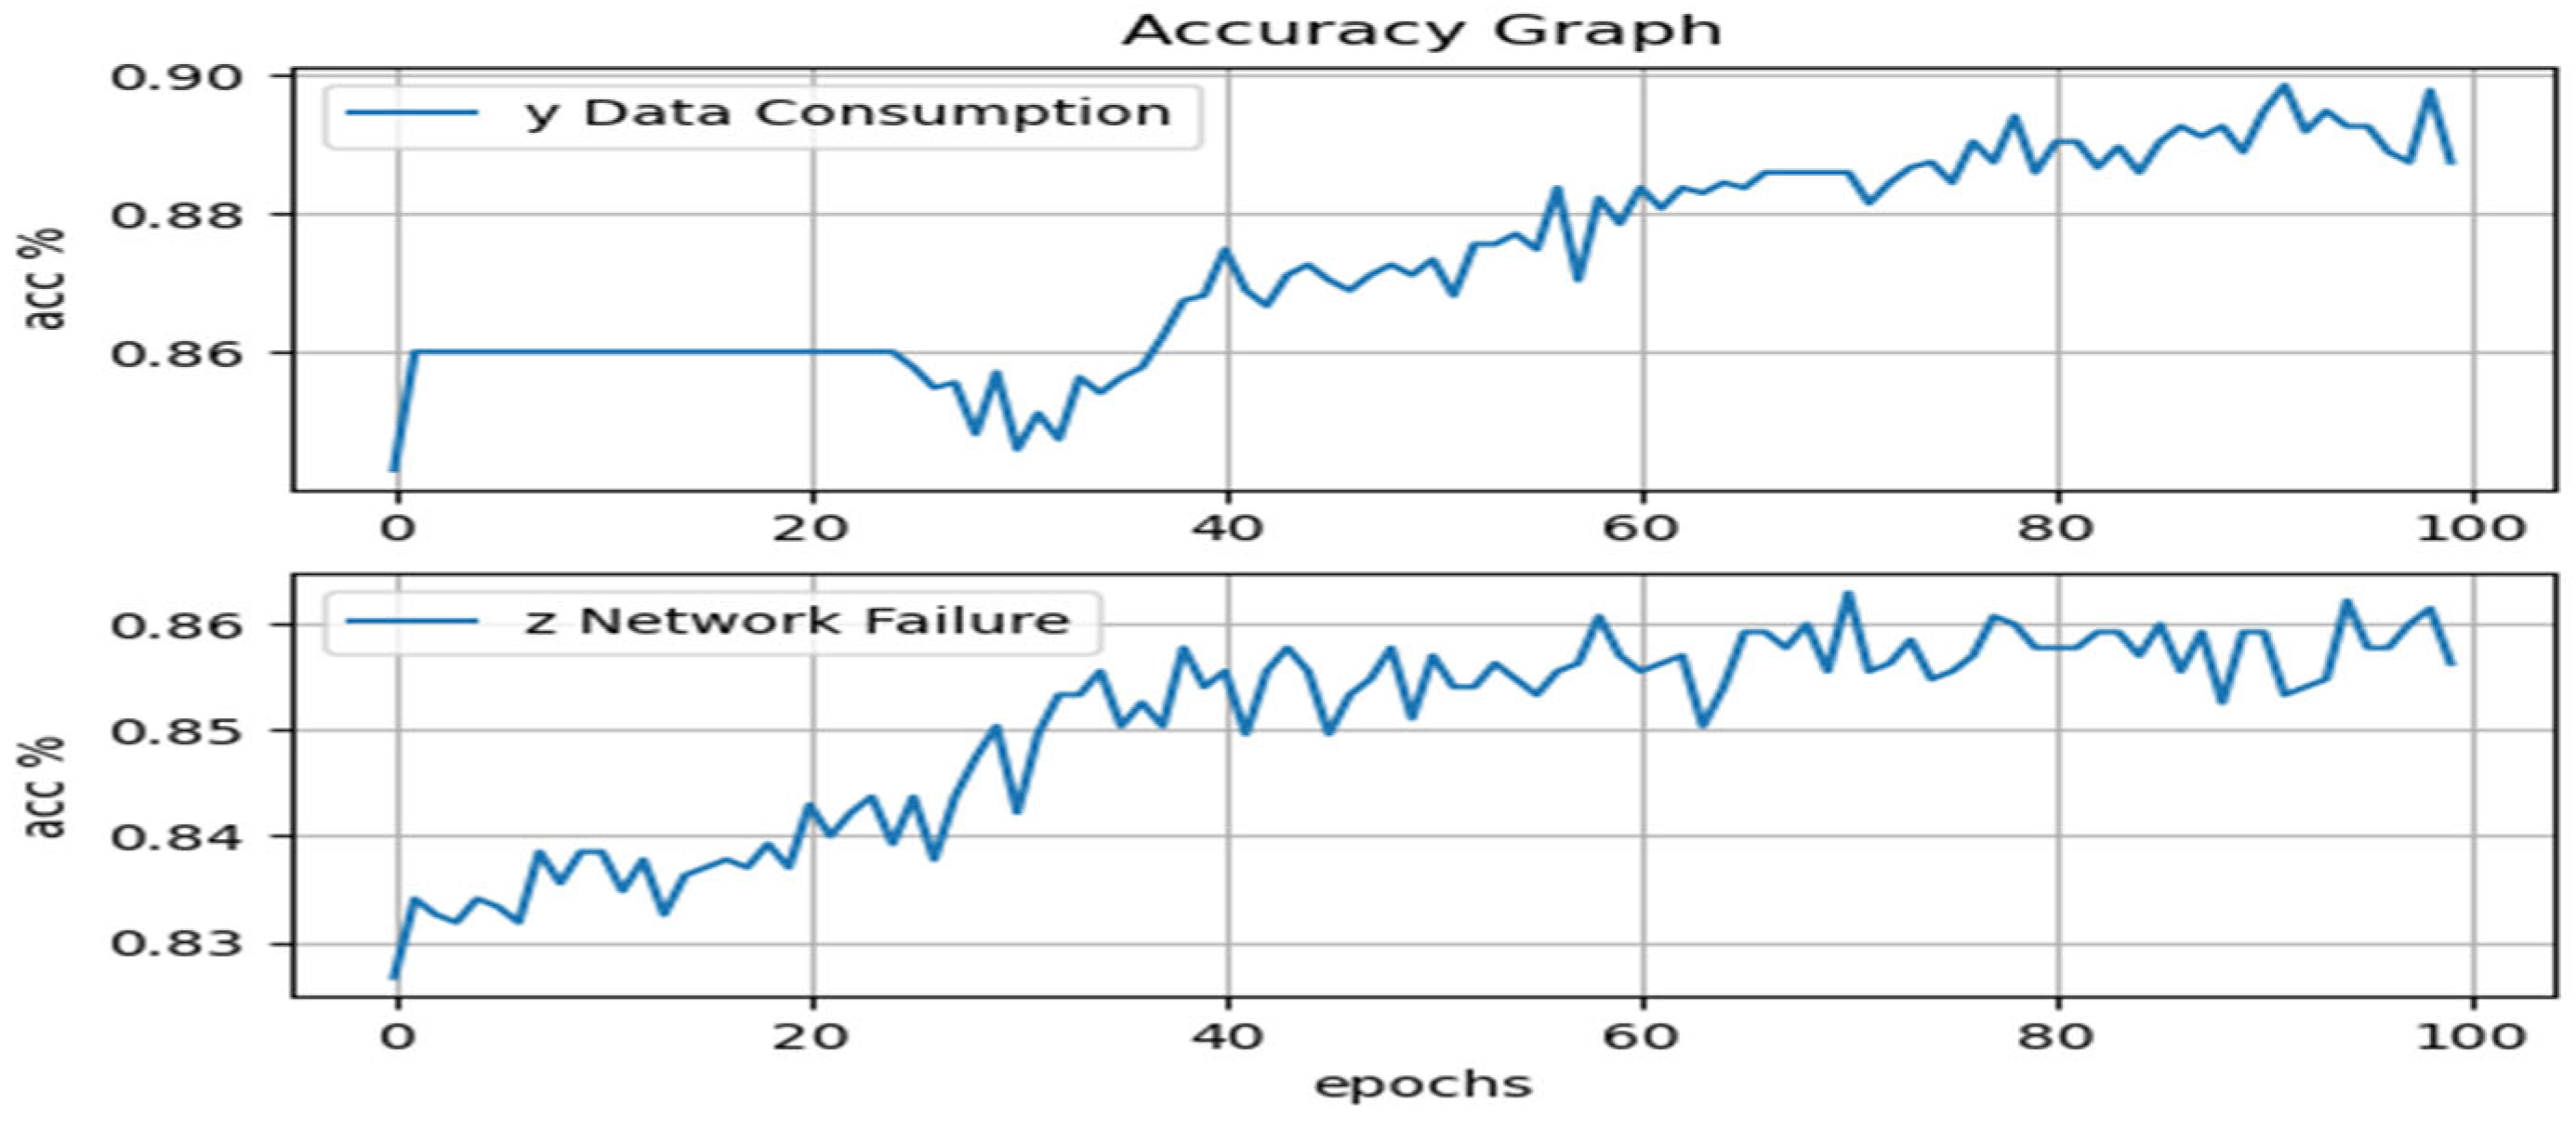
As shown in the Figure 9, the prediction accuracy for data consumption complaints surpasses 90% when utilizing a high learning rate of 1.0 and a normal number of training epochs, specifically 1000. This approach minimizes training time and CPU resource consumption, making it suitable for environments with limited server hardware capabilities. On the other hand, the prediction accuracy for network failure exhibits an ascending trend, also reaching above 90%.

6.3. Analysis of ADADELTA Optimizer Learning Rate = 0.001, Epochs = 1000

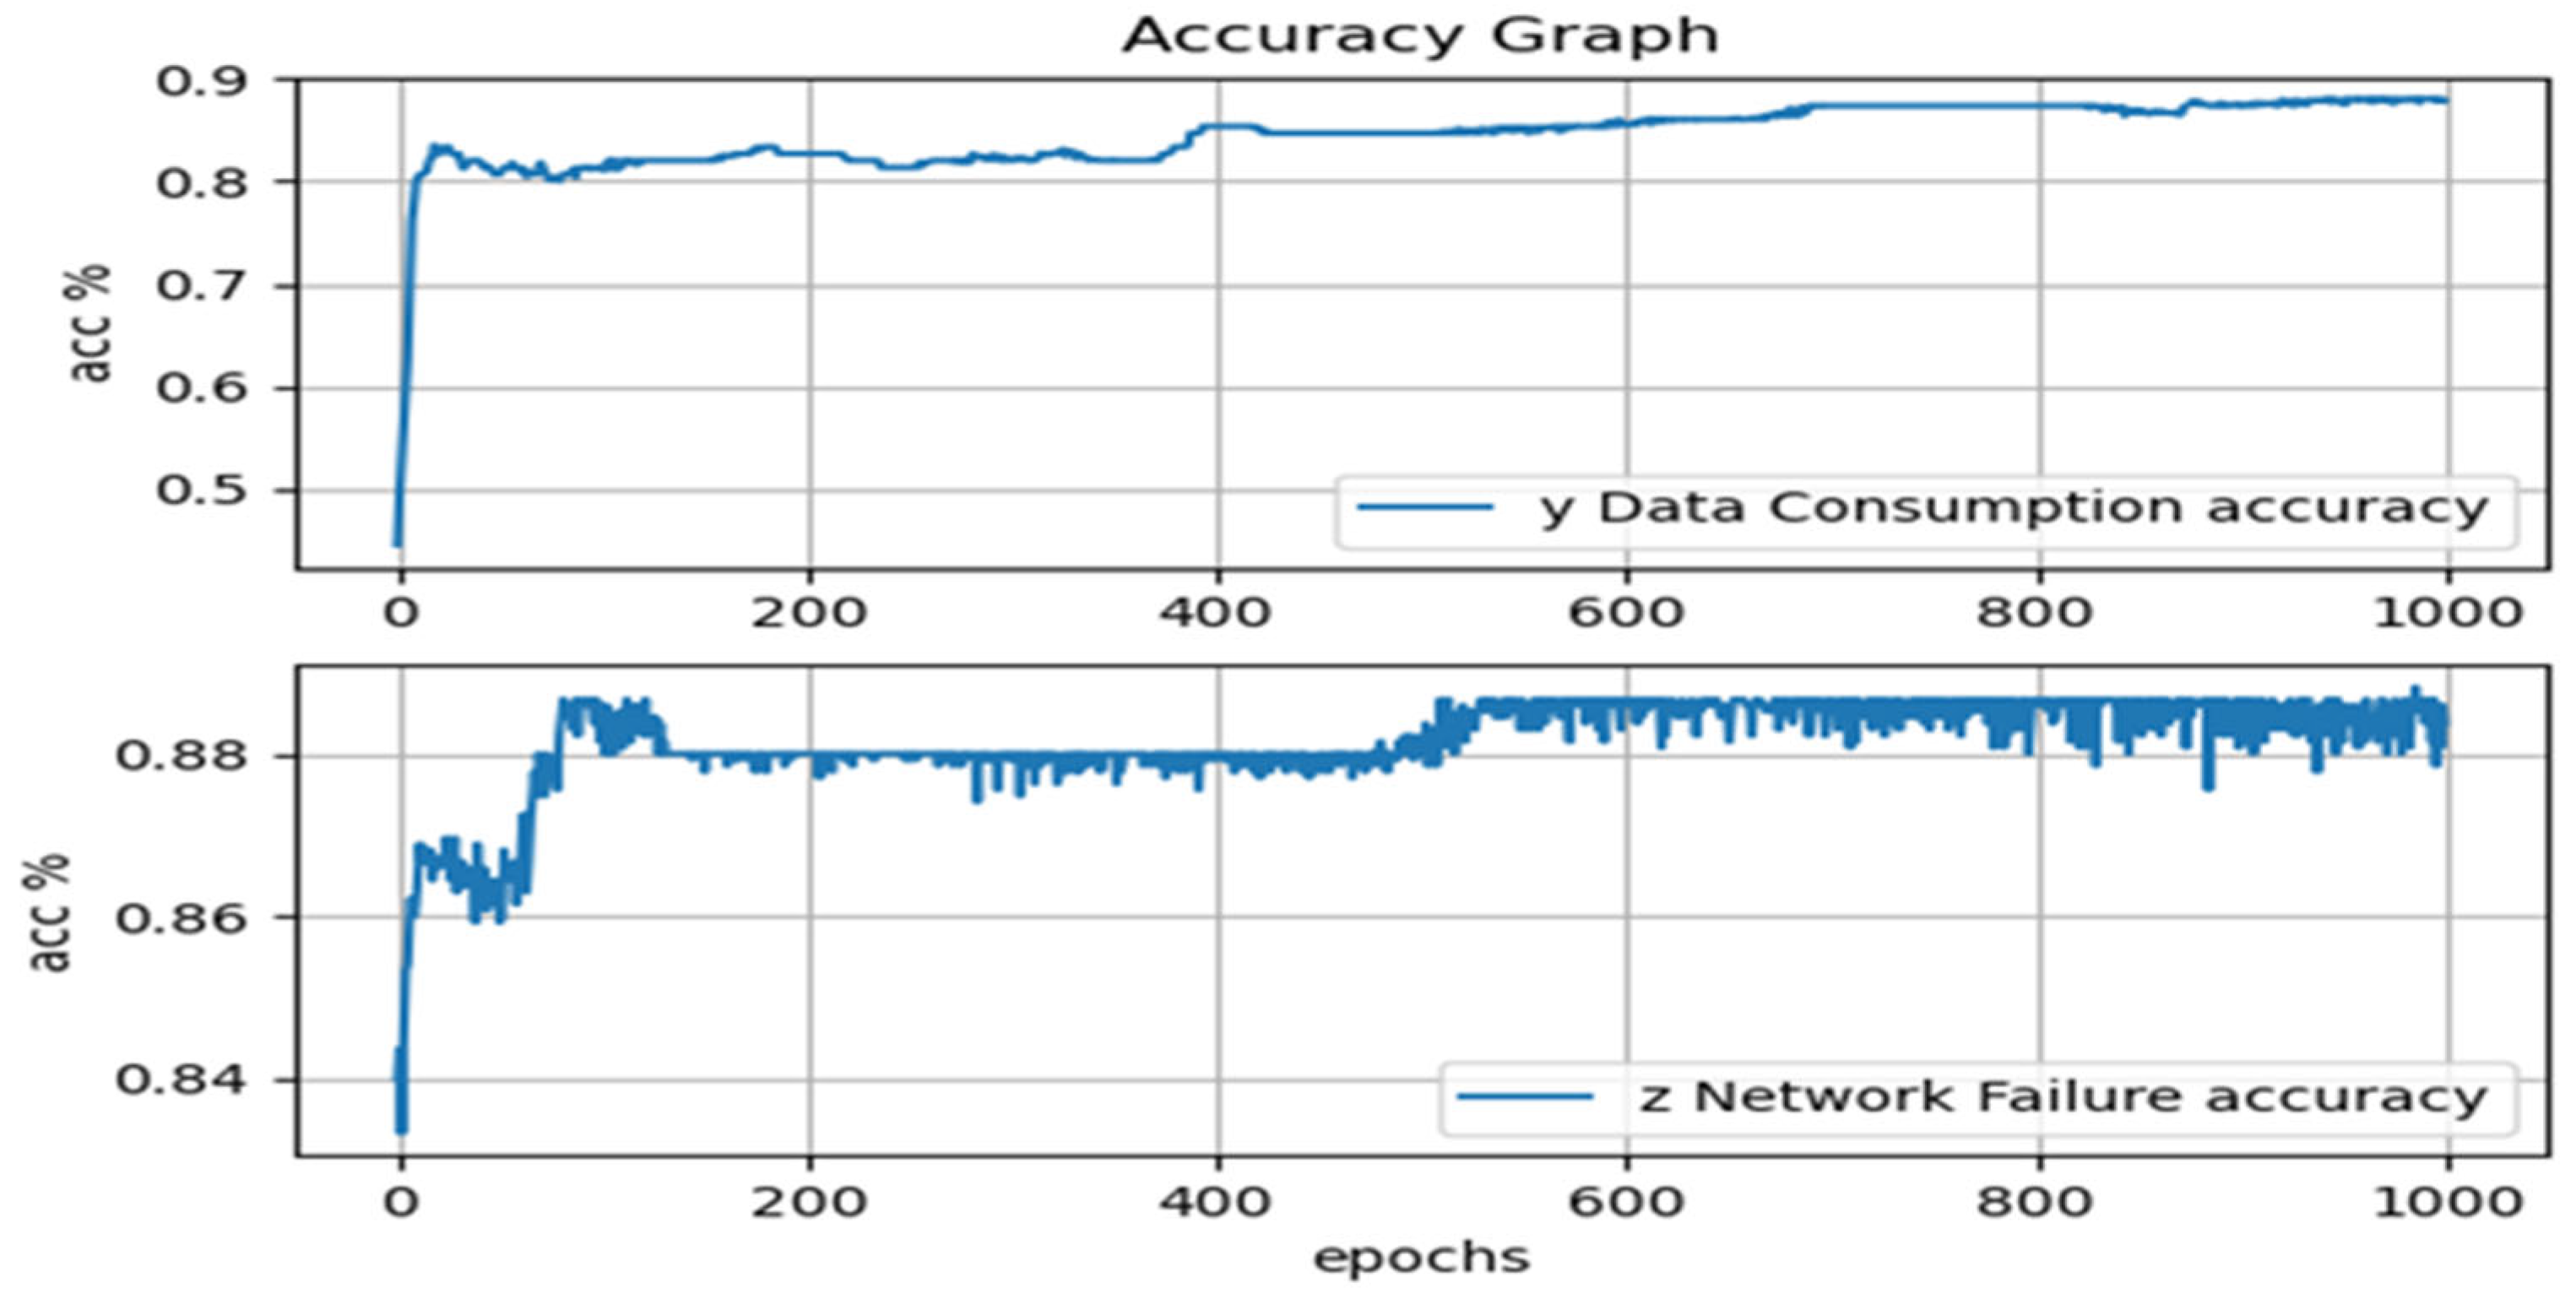
As shown in the Figure 10 conversely, the graphs indicate that for data consumption complaint prediction, using a high number of training epochs (Epochs 1000) results in lower accuracy rates (<90%) and a relatively straight-line pattern. This suggests that a longer training process is required, demanding significant hardware resources (CPU, Memory, etc.), yet yielding diminished accuracy.

6.4. Analysis of ADAGRAD Optimizer Learning Rate = 0.001, Epochs = 1000

The graphs in Figure 11 indicate the prediction accuracy for data consumption complaints falls below 90% when utilizing a low learning rate of 0.001 and a high number of training epochs (1000). This results in extended training times and increased CPU resource consumption, necessitating substantial server hardware capabilities. Conversely, the prediction graph (Figure 12) for network failure achieves an accuracy of 85% with a consistent, stable line pattern when trained with the maximum number of epochs, namely 1000.
Evidence of overfitting in the neural network is apparent in the observed curve, which exhibits a plateau with minimal variation. This plateau indicates that the accuracy levels have stabilized at approximately 0.866 for “y accuracy”, around 0.84 for “x accuracy”, and approximately 0.834 for “z accuracy”.

6.5. Analysis of ADAGRAD Optimizer Learning Rate = 0.01, Epochs = 1000

On the contrary, the graph depicting the performance of the ADAGRAD Optimizer (Figure 12) illustrates that using a low number of training epochs (100) for data consumption complaint prediction results in an accuracy rate below 85%. This suggests that additional training iterations are necessary to achieve higher accuracy, demanding significant hardware resources (CPU and memory).
It is worth mentioning that this curve (Figure 12) does not explicitly suggest overfitting of the network. However, it does indicate that while the results are not as precise as those obtained with ADADELTA, there may be some overfitting occurring in the trained set. Furthermore, the results indicate that the ADADELTA Optimizer stands out as a reliable and effective choice compared to other optimizers.

7. Conclusions

In the field of mobile telecommunication technologies and data sciences, mobile operators have access to a wealth of data regarding customer’s service experiences. This case study leverages these datasets to propose a novel methodology for predicting customer complaints using machine learning techniques. By utilizing a combination of real industry mobile operator datasets as learning input data, we introduce a new research approach that achieves a prediction accuracy exceeding 92%. While this accuracy is commendable, the best model parameters include two levels of Dense with “RELU” Activation and one Dense with “Softmax” activation using ADADELTA Optimizer with a small learning rate 0.1. Further enhancements could be attained through the utilization of larger training datasets and possibly by optimizing the combination of activation functions and their associated learning rates. Across various metrics, it becomes evident that despite their complexity, Artificial Neural Networks outperform other algorithms in terms of prediction performance.
Moving forwards, our future work will delve into segmented prediction techniques to explore the influence of demographic variables and device manufacturers on customer complaints. Specifically, we will be aiming to examine the relationship between gender, age, device manufacturers, and their impacts on predicting customer complaints.

Funding

This research received no external funding.

Institutional Review Board Statement

Not applicable.

Informed Consent Statement

Not applicable.

Data Availability Statement

The data supporting the findings of this study are not publicly available due to privacy and confidentiality restrictions imposed by the telecommunications company from which the data were obtained. Data may be available from the corresponding author upon reasonable request and with permission from the data owner.

Conflicts of Interest

The author declares no conflict of interest.

References

  1. Lu, J.; Liu, L.; Nie, Y.; Huang, H. Exploration to improve the service Quality and Reduce the power Customer Complaits. Adv. Comput. Sci. Res. 2017, 61, 91–95. [Google Scholar]
  2. Kolar, T. Evaluating the Performance of Call Centers From Consumers’ Perspective: Marketing Research Industry Example. Manag. J. Contemp. Manag. Issues Split 2006, 11, 53–76. [Google Scholar]
  3. Garín-Muñoz, T.; Pérez-Amaral, T.; Gijón, C.; López, R. Consumer complaint behaviour in telecommunications: The case of mobile phone users in Spain. Telecommun. Policy 2016, 40, 804–820. [Google Scholar] [CrossRef] [Scilit]
  4. Wang, H.; Xie, S.; Li, K.; Ahmad, M.O. Big Data-Driven Cellular Information Detection and Coverage Identification. Sensors 2019, 19, 937. [Google Scholar] [CrossRef] [Scilit] [PubMed]
  5. Yang, D.X.; Hu, Z.; Zhao, H.; Hu, H.F.; Sun, Y.Z.; Hou, B.J. Through-Metal-Wall Power Delivery and Data Transmission for Enclosed Sensors: A Review. Sensors 2015, 15, 31581–31605. [Google Scholar] [CrossRef] [Scilit] [PubMed]
  6. Lahey, S. Customer Dissatisfaction: A Guide to Handling Unhappy Customers. Zendesk. Available online: https://www.zendesk.com/blog/customer-dissatisfaction/ (accessed on 23 February 2024).
  7. Suresh, L.; Simha, J.B.; Velur, R. Analysis and prediction server with column store database—A case study in telecom churn. In Proceedings of the TENCON 2009-2009 IEEE Region 10 Conference, Singapore, 23–26 January 2009. [Google Scholar] [CrossRef] [Scilit]
  8. Choi, C. Predicting Customer Complaints in Mobile Telecom Industry Using Machine Learning Algorithms; Purdue University: Sifaye, IN, USA, 2018; Available online: https://docs.lib.purdue.edu/open_access_theses (accessed on 23 February 2024).
  9. Peek, S. The Science of Persuasion: How to Influence Consumer Choice. Available online: https://www.businessnewsdaily.com/10151-how-to-influence-consumer-decisions.html (accessed on 23 February 2024).
  10. Nimaki, S.G. Customer Dissatisfaction and Cpmlaining Responses towards Mobile Telephony Services. Afr. J. Inf. Syst. 2012, 4, 17. [Google Scholar]
  11. Kim, C.; Kim, S.; Im, S.; Shin, C. The effect of attitude and perception on consumer complaint intentions. J. Consum. Mark. 2003, 20, 352–371. [Google Scholar] [CrossRef] [Scilit]
  12. Singh, J. Consumer Complaint Intentions and Behavior: Definitional and Taxonomical Issues. JSTOR 1988, 52, 93–107. [Google Scholar] [CrossRef] [Scilit]
  13. Shavitt, S.; Barnes, A.J. Culture and the Consumer Journey. J. Retail. 2020, 96, 40–54. [Google Scholar] [CrossRef] [Scilit]
  14. Smith, T.A. The role of customer personality in satisfaction, attitude-to-brand and loyalty in mobile services. Span. J. Mark.—ESIC 2020, 24, 155–175. [Google Scholar] [CrossRef] [Scilit]
  15. Tronvoll, B. Customer Complaint Behavior in Service. Ph.D. Thesis, Karlstad University, Karlstad, Sweden, 2008. Volume 14. Available online: https://www.diva-portal.org/smash/get/diva2:5576/FULLTEXT01.pdf (accessed on 25 February 2024).
  16. Carbera, A. Logistic Regression Analysis in Higher Education: An Applied Perspective. in Creative Education; Agathon Press: New York, NY, USA, 1994; pp. 225–256. Available online: https://www.sciepub.com/reference/210823 (accessed on 25 February 2024).
  17. Peng, C.Y.J.; Lee, K.L.; Ingersoll, G.M. An introduction to logistic regression analysis and reporting. J. Educ. Res. 2002, 96, 3–14. [Google Scholar] [CrossRef] [Scilit]
  18. Ranganathan, P.; Pramesh, C.; Aggarwal, R. Common pitfalls in statistical analysis: Logistic regression. Perspect. Clin. Res. 2017, 8, 148. [Google Scholar] [CrossRef] [Scilit] [PubMed]
  19. Tareen, A.K.; Tareen, F. (PDF) Convolutional Neural Networks for Beginners. SSRN Electronic Journal. Available online: https://www.researchgate.net/publication/373813288_Convolutional_Neural_Networks_for_Beginners (accessed on 23 February 2024).
  20. Jagtap, A.; Karniadakis, G.E. How Important Are Activation Functions in Regression and Classification? A Survey, Performance Comparison, and Future Directions. CS.LG. 2022. Available online: https://arxiv.org/pdf/2209.02681.pdf (accessed on 25 February 2024).
  21. Nwankpa, C.; Ijomah, W.; Gachagan, A.; Marshall, S. Activation Functions: Comparison of Trends in Practice and Research for Deep Learning. CS.LG. 2018. Available online: https://arxiv.org/pdf/1811.03378.pdf (accessed on 26 February 2024).
  22. Mulindwa, D.B.; Du, S. An n-Sigmoid Activation Function to Improve the Squeeze-and-Excitation for 2D and 3D Deep Networks. Electronics 2023, 12, 911. [Google Scholar] [CrossRef] [Scilit]
  23. Munir, N.; Park, J.; Kim, H.J.; Song, S.J.; Kang, S.S. Performance enhancement of convolutional neural network for ultrasonic flaw classification by adopting autoencoder. NDT E Int. 2020, 111, 102218. [Google Scholar] [CrossRef] [Scilit]
  24. Kagalkar, A.; Raghuram, S. CORDIC Based Implementation of the Softmax Activation Function. In Proceedings of the 2020 24th International Symposium on VLSI Design and Test (VDAT), Bhubaneswar, India, 23–25 July 2020. [Google Scholar] [CrossRef] [Scilit]
Figure 1. Customer responses to complaints behavior (adapted by the authors based on Singh, 1988 [12]).
Engproc 150 00058 g001
Figure 2. Analysis of user mobile phone distributions and decision tree phases following problem encounters (adapted by the authors based on T. Garín-Muñoz [3]).
Engproc 150 00058 g002
Figure 3. Data training and structure in customer complaint algorithm development.
Engproc 150 00058 g003
Figure 4. Conceptual Architecture of the Logistic Regression Model.
Engproc 150 00058 g004
Figure 5. Artificial Neural Network Neuron Architecture for Nonlinear Input Combination (adapted by the authors based on P. Ranganathan, C. Pramesh, and R. Aggarwal [18,19]).
Engproc 150 00058 g005
Figure 6. Plot of the Sigmoid function and its derivative.
Engproc 150 00058 g006
Figure 7. ReLU function graph (a) and derivate graph (b).
Engproc 150 00058 g007
Figure 8. Softmax function graph.
Engproc 150 00058 g008
Figure 9. Accuracy graph using ADADELTA Optimizer (TensorFlow 2.1.0 backend), learning rate of 0.1, Epochs = 1000.
Engproc 150 00058 g009
Figure 10. Accuracy graph using ADADELTA Optimizer (TensorFlow 2.1.0 backend), learning rate of 0.001, Epochs = 1000.
Engproc 150 00058 g010
Figure 11. Accuracy graph using ADAGRAD Optimizer (TensorFlow 2.1.0 backend), learning rate of 0.001, Epochs = 1000.
Engproc 150 00058 g011
Figure 12. Accuracy graph using ADAGRAD Optimizer (TensorFlow 2.1.0 backend), learning rate of 0.01, Epochs = 1000.
Engproc 150 00058 g012
Table 1. Complaint distribution among users based on reason categories [3].
Coverage ProblemDifficulty Obtaining InformationIncorrect BillingIncorrect ChargesBreach of ContractDifficulty UnsubscribingDelayed Service
Number of Users53673373427139
Number of Complainers15363353123128
Percentage of Complainers (%)28.586.394.691.285.292.388.9
Table 2. Description of the learning dataset.
Learning DatasetDescription
Training SetUsed to train the machine-learning model by learning the network parameters (e.g., weights and biases). One epoch represents a complete pass through the entire training dataset.
Validation SetUsed to tune the model’s hyper-parameters (e.g., network architecture, number of hidden layers, learning rate) and to optimize model performance during training.
Test SetUsed exclusively to evaluate the final model’s predictive performance on unseen data after training and hyper-parameter tuning have been completed.
Table 3. Dataset sample.
Device_ModelAreaPSTN_IDAgeTitleLocal CallRoaming CallAVG Voice Call Duration/CycleAVG Data Call Duration/CycleNbr Voice Call/CycleNbr Data Call/CycleService TypeSpeedNetwork Coverage Traffic FailureData Consumption Failure
Apple A1981/Apple iPhone 14 Pro MaxBEIRUT340CMr.YESNO669853232HS54G10
Apple A1577/Apple iPhone 12 ProBEIRUT61BMr.YESYES145631128HS44G00
Samsung SM-G920F/Samsung Galaxy S6BEIRUT72BEng.YESNO187892359HS34G00
Samsung SM-G610FDS/Samsung Galaxy J7 PrimeBEIRUT590AMr.NONO993653222HS43G00
Apple A1708/Apple iPhone SEBEIRUT341BMSNOYES898992512HS34G00
Samsung SM-J200X/Samsung Galaxy J2BEIRUT577BEng.YESNO4810253631HS34G01
Samsung SM-J730FDS/Samsung Galaxy J7 PrimeBEIRUT345AMr.YESNO36117022229HS14G10
Apple A1758/Apple iPhone 11BEIRUT501CEng.YESNO2879653339HS14G00
Disclaimer/Publisher’s Note: The statements, opinions and data contained in all publications are solely those of the individual author(s) and contributor(s) and not of MDPI and/or the editor(s). MDPI and/or the editor(s) disclaim responsibility for any injury to people or property resulting from any ideas, methods, instructions or products referred to in the content.