1. Introduction
In recent years, the concept of Mechanical Power (MP) has emerged as a comprehensive parameter integrating vital ventilator settings contributing to energy delivery to the respiratory system. In mechanical ventilation, MP is the total energy transferred from the ventilator to the lungs and chest wall per minute, typically expressed in joules per minute (J/min). This metric provides a holistic view of mechanical load, accounting for the combined effects of tidal volume, respiratory rate, airway pressure, and flow [
1]. Elevated MP levels are independently associated with an increased risk of Ventilator-Induced Lung Injury (VILI) and higher mortality rates in patients with acute respiratory distress syndrome (ARDS) [
2].
This research is part of the wider personalized medicine paradigm, which aims to move beyond standardized protocols towards interventions tailored to the individual’s unique physiological profile. In the Intensive Care Unit (ICU), this shift is characterized by physiologically guided ventilation, where the clinician’s decision is informed by pulmonary mechanics in real time [
3]. The integration of data-points from multi-modal clinical time series into a single digital twin framework would enable continuous risk assessment and optimization of ventilator settings to suit the needs of individual patients [
4].
Despite the clinical significance of MP, its integration into these personalized digital twin systems remains challenging. Most modern ventilators do not provide real-time MP calculations, especially for pressure-controlled ventilation (PCV). The existing analytical equations are often too simplistic to be accurate or too computationally intensive to be used at the bedside, which prevents the formation of highly reliable respiratory twins. To bridge this gap, this research is exploring a deep learning approach - the One-Dimensional Convolutional Neural Network with Bidirectional LSTM layers (1D CNN-BiLSTM architecture) to model the relationship between the standard parameters of a ventilator and the resulting mechanical output.
2. Methodology
Our previous study involved a detailed analysis of parameters within existing Mechanical Power equations, correlations between parameters, and the individual importance of each parameter [
5]. In this study, 251,237 samples linked to pressure-controlled ventilation (PCV) were extracted, and a one-dimensional (1D) convolutional neural network (CNN) was used, incorporating bidirectional Long Short-Term Memory (BiLSTM) layers and trained on calculated Mechanical Power (MP).
2.1. Data Source and Pre-Processing
For both studies, the VitalDB database was used, a high-fidelity multi-parameter vital signs database. The bio-signals included in the dataset are recorded at a high sampling rate, with waveforms ranging from 500 Hz to bio-signal readings taken at intervals between 1 and 7 s [
6].
2.1.1. Data Source
The model processes 11 MP key features: set inspiratory pressure, set respiratory rate, tidal volume, peak inspiratory pressure, PEEP, plateau pressure, airway compliance, set inspiratory time, airflow, airflow resistance, inspiratory rise time. Although PCV is the main focus of our study, we also use parameters related to VCV. This is because our ultimate goal is that all mechanical ventilation modes should be compatible with the developed architecture. We have studied the Simplified Becher (sB) Equation (
1) [
7], Comprehensive Becher (cB) Equation (
2) [
7], Van der Meijden (VdM) Equation (
3) [
8] and Linear Model (LM) Equation (
4) [
1] to calculate MP, so we can use the obtained values to train our model.
For Equations (
1) to (
4):
is Peak Pressure [
];
is the change in
during inspiration [
];
is the positive end-expiratory pressure [
];
is the total inspiratory time [s];
is inspiratory rise time in [s];
is the tidal volume [l];
is the respiratory rate [breaths/min] with
as a correction factor to obtain the result in J/min;
C is the compliance [
];
R is the resistance [
].
2.1.2. Pre-Processing
To ensure data integrity, missing clinical values were addressed through a univariate median imputation strategy [
9], followed by a standardization process that scales each feature to a mean of zero and a standard deviation of one [
10]. This transformation homogenizes disparate physiological units, such as airway flow and pressure, ensuring they contribute equitably to the learning process of the neural network.
2.1.3. Features Masking
However, while these standard preprocessing steps stabilize the data, they do not inherently protect the model from dynamic sensor failures, transducer disconnections, or the computational delays frequent in intensive care environments. Without a specific mechanism to identify these absences, a model may interpret a missing signal as a true numerical value, potentially leading to inaccurate or uncalibrated predictions.
To mitigate this clinical risk, the model underwent a specialized training regimen utilizing feature masking, where parameters were intentionally hidden during the training phase. By augmenting the input with an explicit status indicator, the network is forced to leverage the underlying physiological correlations between the remaining active parameters, ensuring robust performance and reliable estimation even in the presence of hardware limitations. This design follows the standard missing-indicator augmentation technique [
11,
12], which explicitly encodes the absence of data to prevent the network from confusing a missing sensor with a true reading of zero.
2.2. Deep Learning Architectures
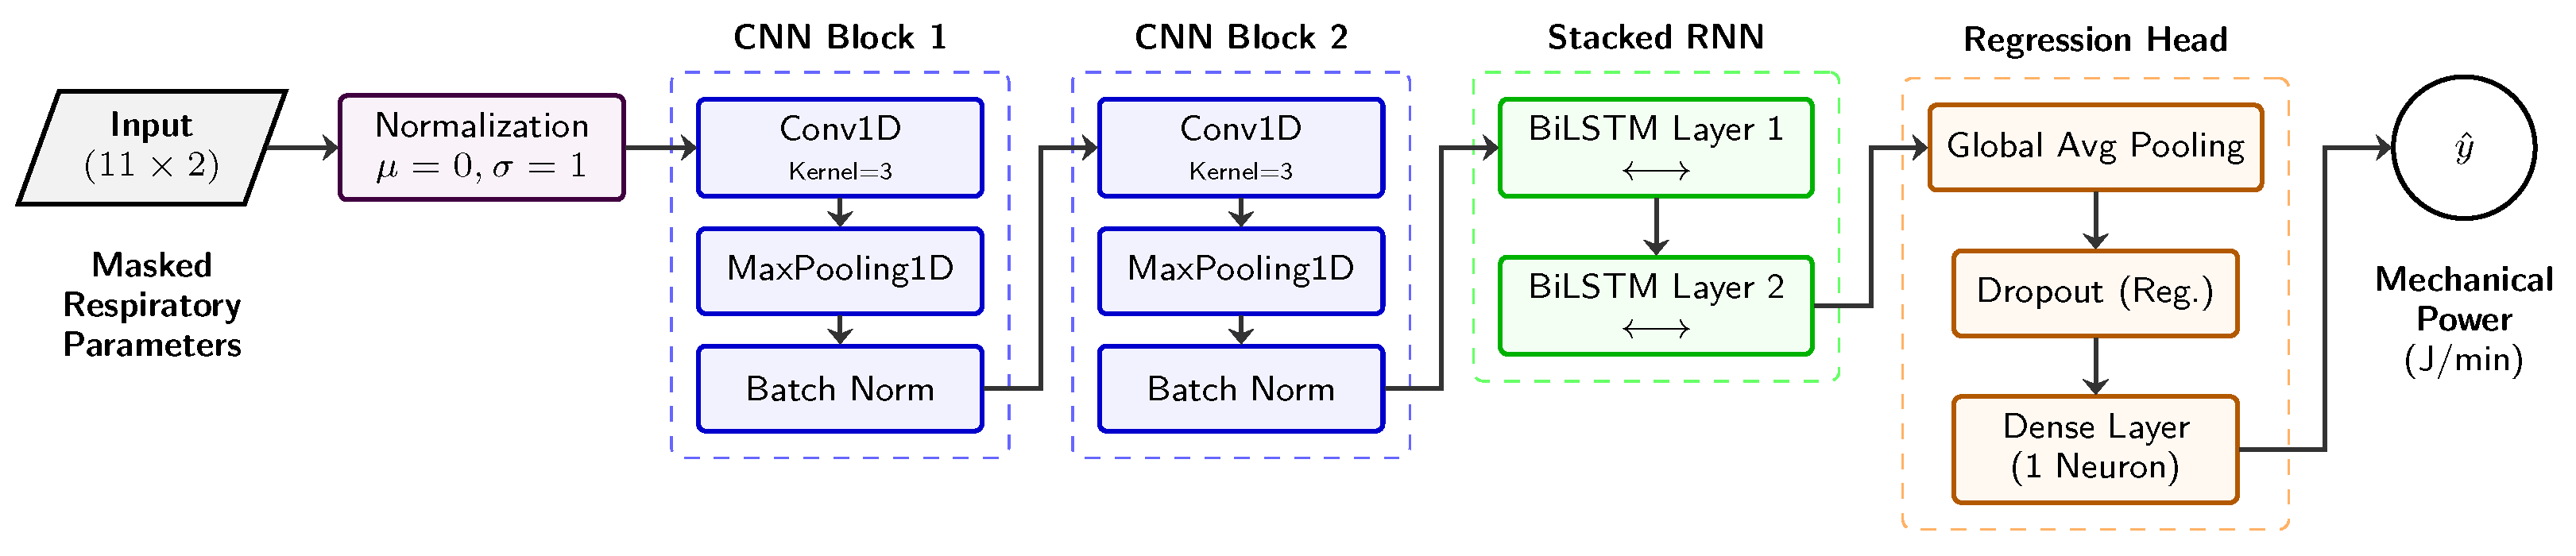
The model we proposed is a hybrid 1D Convolutional Neural Network (CNN) integrated with Bidirectional Long Short-Term Memory layers. The architecture comprises two convolutional blocks, each consisting of a convolutional, pooling, and normalization layer. This design is chosen to capture both local spatial features and long-range temporal dependencies in respiratory data. The architecture is illustrated in
Figure 1.
2.2.1. Input Normalization
The initial stage utilizes a normalization layer that standardizes input data to a mean of 0 and a variance of 1. The normalization parameters were calculated based on the training dataset distribution prior to model training, ensuring consistent feature scaling during both the learning and inference phases [
10].
2.2.2. Feature Extraction (CNN Blocks)
For feature extraction, we used a CNN, a deep learning model that automatically and adaptively learns spatial hierarchies of features, ranging from low-level to high-level patterns. The architecture of a CNN typically comprises three types of layers: Convolutional, Pooling, and Fully Connected [
13].
The core of the feature extraction in the architecture proposed by us consists of two 1D Convolutional blocks, each consisting of the following:
Conv1D Layers: These layers employ multiple filters with a kernel size of 3 to identify local patterns and dependencies between adjacent features.
MaxPooling1D: This downsampling technique reduces dimensionality by selecting the most prominent features, thereby decreasing computational complexity.
Batch Normalization: Applied after each pooling stage, this stabilizes the learning process by re-scaling layer outputs to accelerate convergence.
2.2.3. Sequence Modeling (BiLSTMs)
To model the dependencies between respiratory parameters, we utilized Bidirectional Long Short-Term Memory (BiLSTM) networks. BiLSTM is an extension of traditional LSTMs—a type of Recurrent Neural Network (RNN) capable of learning long-range dependencies in sequence data. Unlike standard LSTM that processes information in a single direction, BiLSTMs allow data to flow both forward and backward, capturing vital contextual information from both past and future states, a capability particularly well-suited for medical signal analysis [
10]. Our implementation employs stacked BiLSTM layers configured to propagate the full temporal context through the model, ensuring the relationship between successive breaths is accurately captured.
2.2.4. Regression Head
The final stage transforms the high-level features into a single numerical prediction using:
Global Average Pooling 1D: Flattens multidimensional features into a single vector by calculating the mean across the temporal dimension.
Dropout: A regularization technique that deactivates a portion of neurons during training to prevent overfitting and improve generalization.
Output Layer: A fully connected layer with a single neuron and linear activation, optimized to predict the continuous value of Mechanical Power.
2.2.5. Adam Optimizer
Adaptive Moment Estimation (Adam) is a computationally efficient algorithm for the gradient-based optimization of stochastic objective functions. The approach is targeted at machine learning problems involving large datasets and/or high-dimensional parameter spaces. It calculates individual adaptive learning rates for different parameters based on running estimates of the mean and uncentred variance of the gradients. Adam combines the strengths of AdaGrad’s sparse gradient handling and RMSProp’s non-stationary objective management, yielding a robust, low-memory solution that is highly effective for large-scale optimization problems [
14]. The model was compiled with a learning rate of 0.001, utilizing Mean Absolute Error (MAE) as the primary loss function during training.
2.3. Performance Metrics
The following types of metrics were used to evaluate the performance of our model:
Mean Absolute Error (MAE): A risk metric corresponding to the expected value of the absolute error loss [
9];
Root Mean Squared Error (RMSE): Measures the average squared difference between the predicted and actual values [
10];
Coefficient of Determination (R
2): Regression score function. Best possible score is 1.0, and it can be negative (because the model can be arbitrarily worse) [
9];
Symmetric Mean Absolute Percentage Error (sMAPE): An accuracy metric that overcomes the limitations of traditional MAPE by providing both lower and upper bounds while treating over-predictions and under-predictions with equal weight. In this implementation, errors are expressed as relative values rather than standard percentages—meaning a 200% error is represented as a value of 2—to provide a normalized scale for assessing forecast performance [
10].
3. Results
Table 1 summarizes the model’s performance when trained against various established MP equations. The model demonstrated high precision regardless of the specific formula used for ground truth.
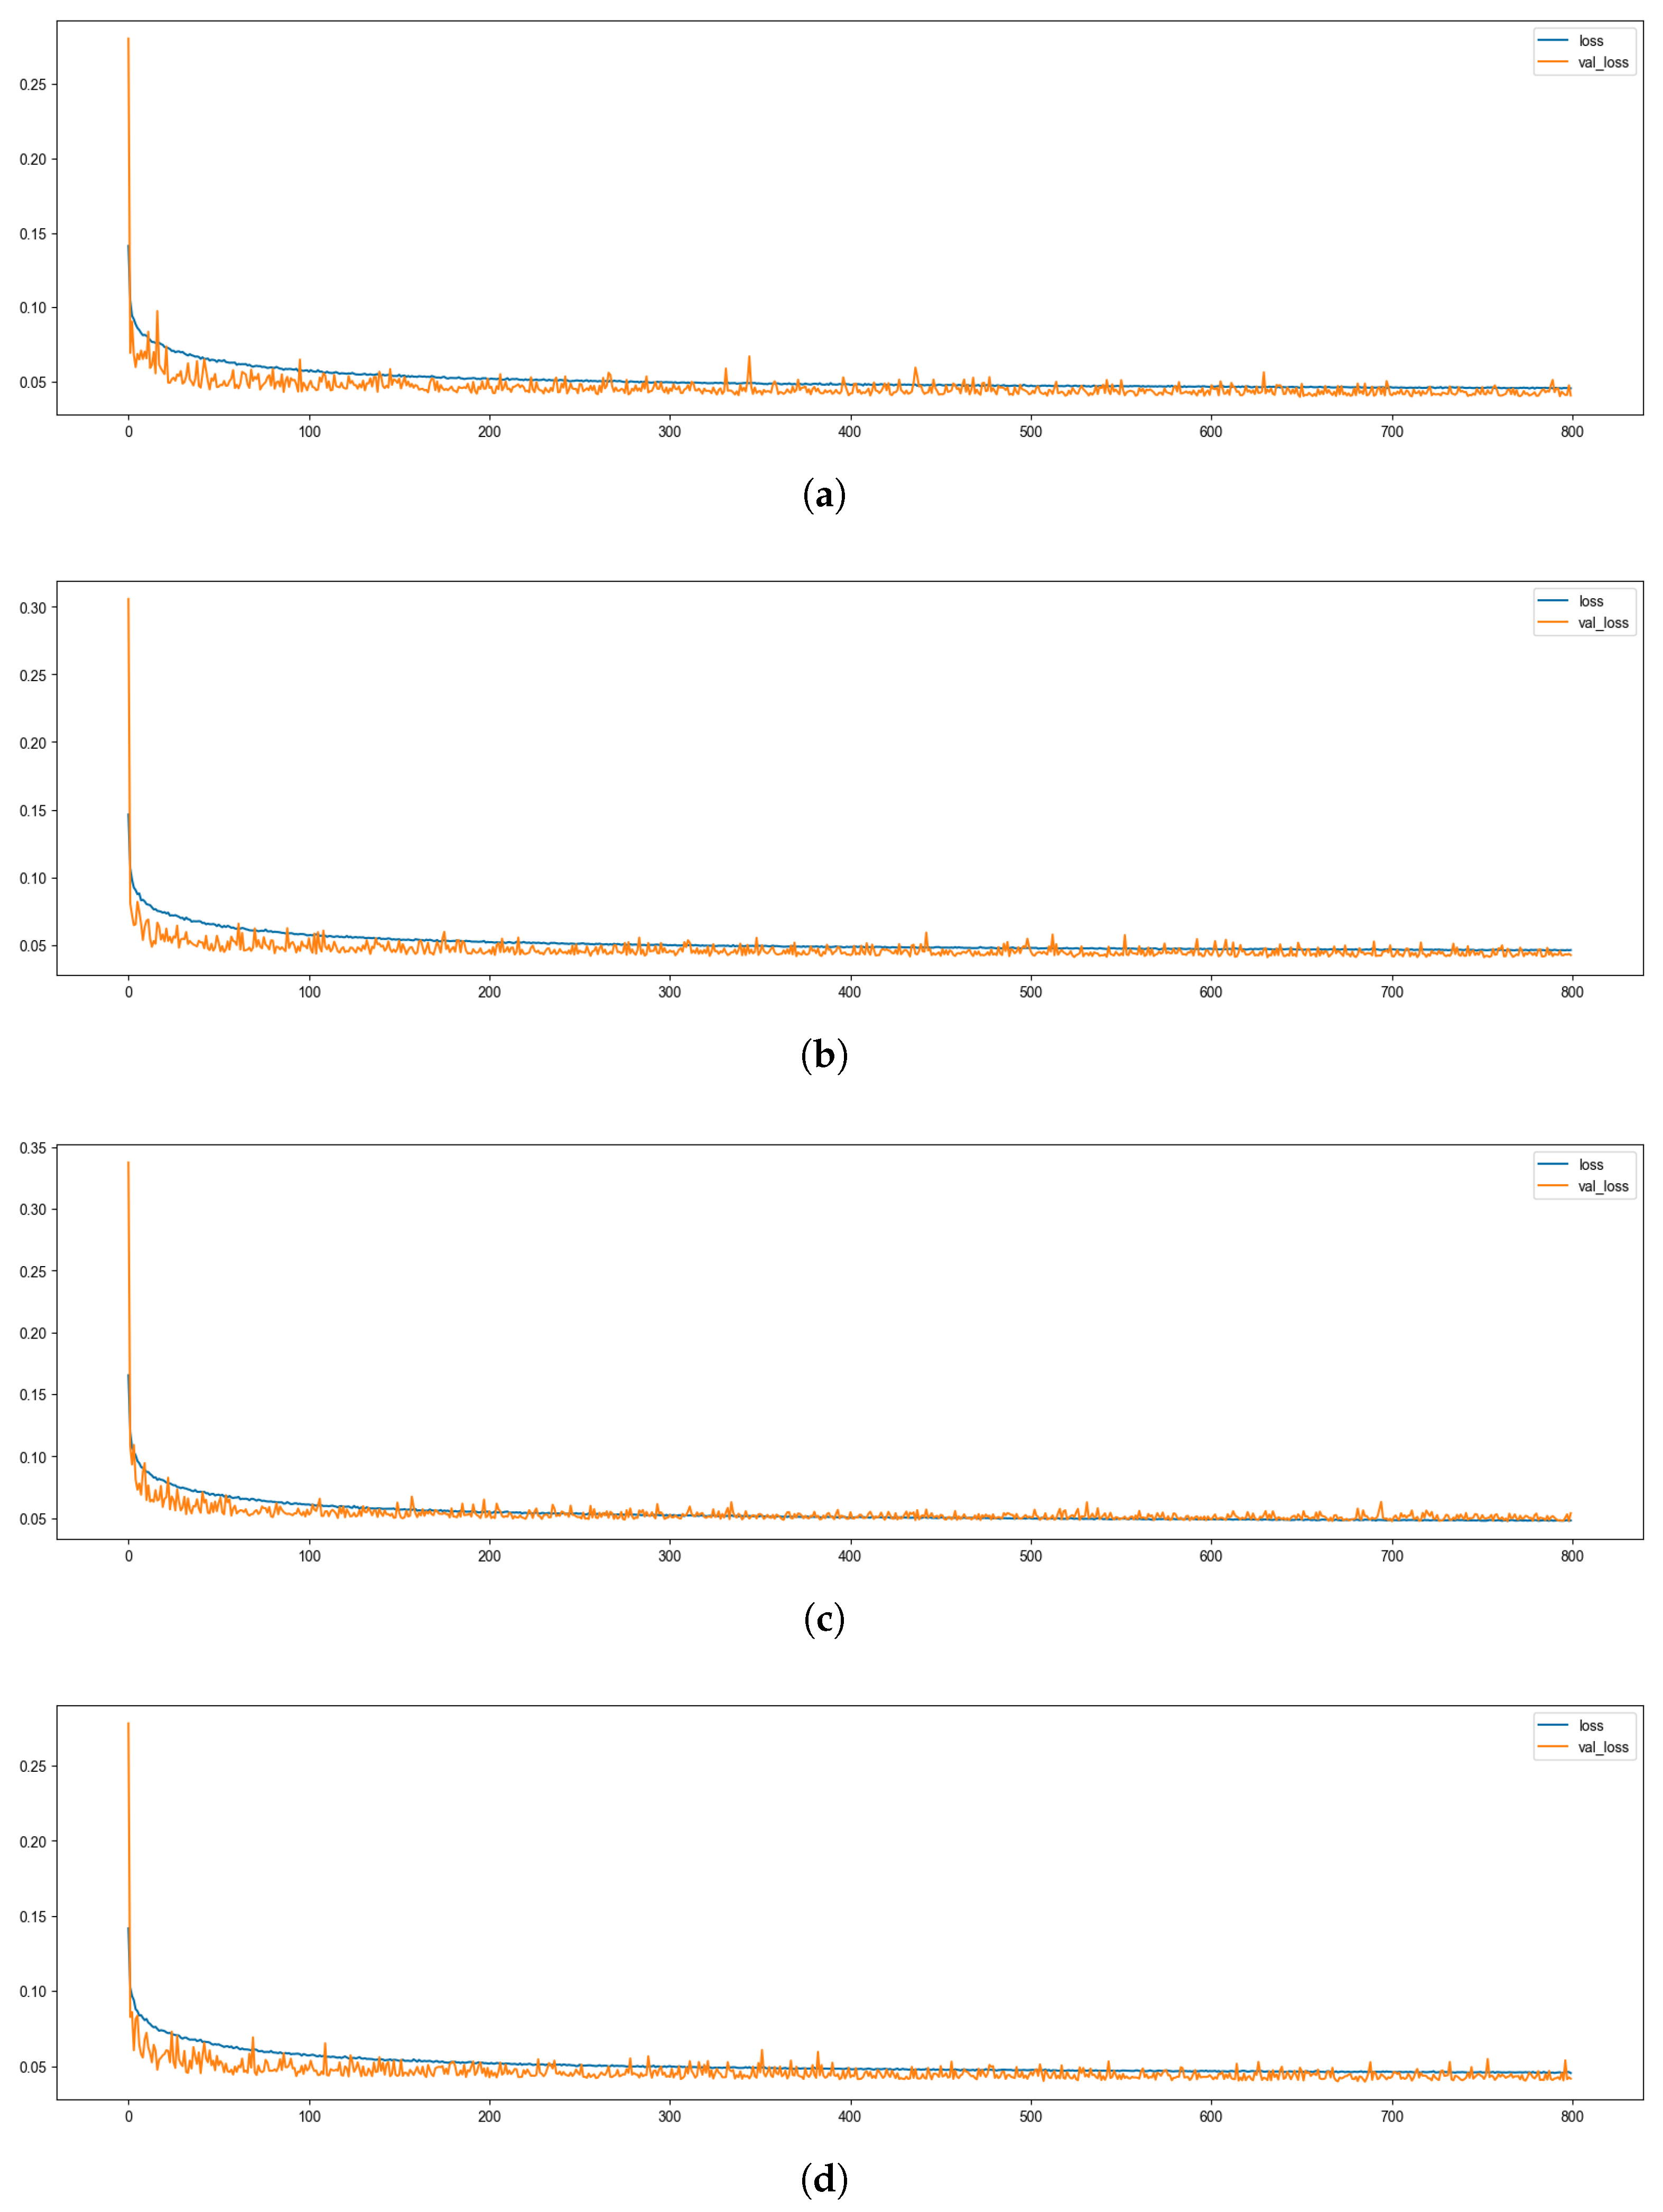
The model was trained for 800 epochs with an early stopping patience of 170. Stable convergence was achieved, as evidenced by the loss curves (
Figure 2). Performance evaluation on the test set revealed exceptional predictive accuracy across four different MP calculation methods (
Table 1).
The model achieved a peak of 0.9994 across the Simplified Becher (sB), Comprehensive Becher (cB), and Linear Model (LM) equations. This indicates that the architecture explains 99.94% of the variance in these Mechanical Power calculations. The recorded MAE (ranging from 0.0112 to 0.0140) and sMAPE (ranging from 3.80% to 4.87%) confirm the model’s robustness and high fidelity across varying scales of MP.
Figure 2 illustrates the training and validation loss over 800 epochs. The rapid initial descent followed by a long plateau confirms that the model efficiently learned the underlying patterns in the respiratory data. The absence of a gap between the training and validation loss curves suggests high model stability and robustness.
Visual Correlation and Error Distribution
The model’s predictive performance is further validated through visual analysis of the correlation between predicted and actual values across all four Mechanical Power equations: Simplified Becher (sB), Comprehensive Becher (cB), Van der Meijden (VdM), and Linear Model (LM).
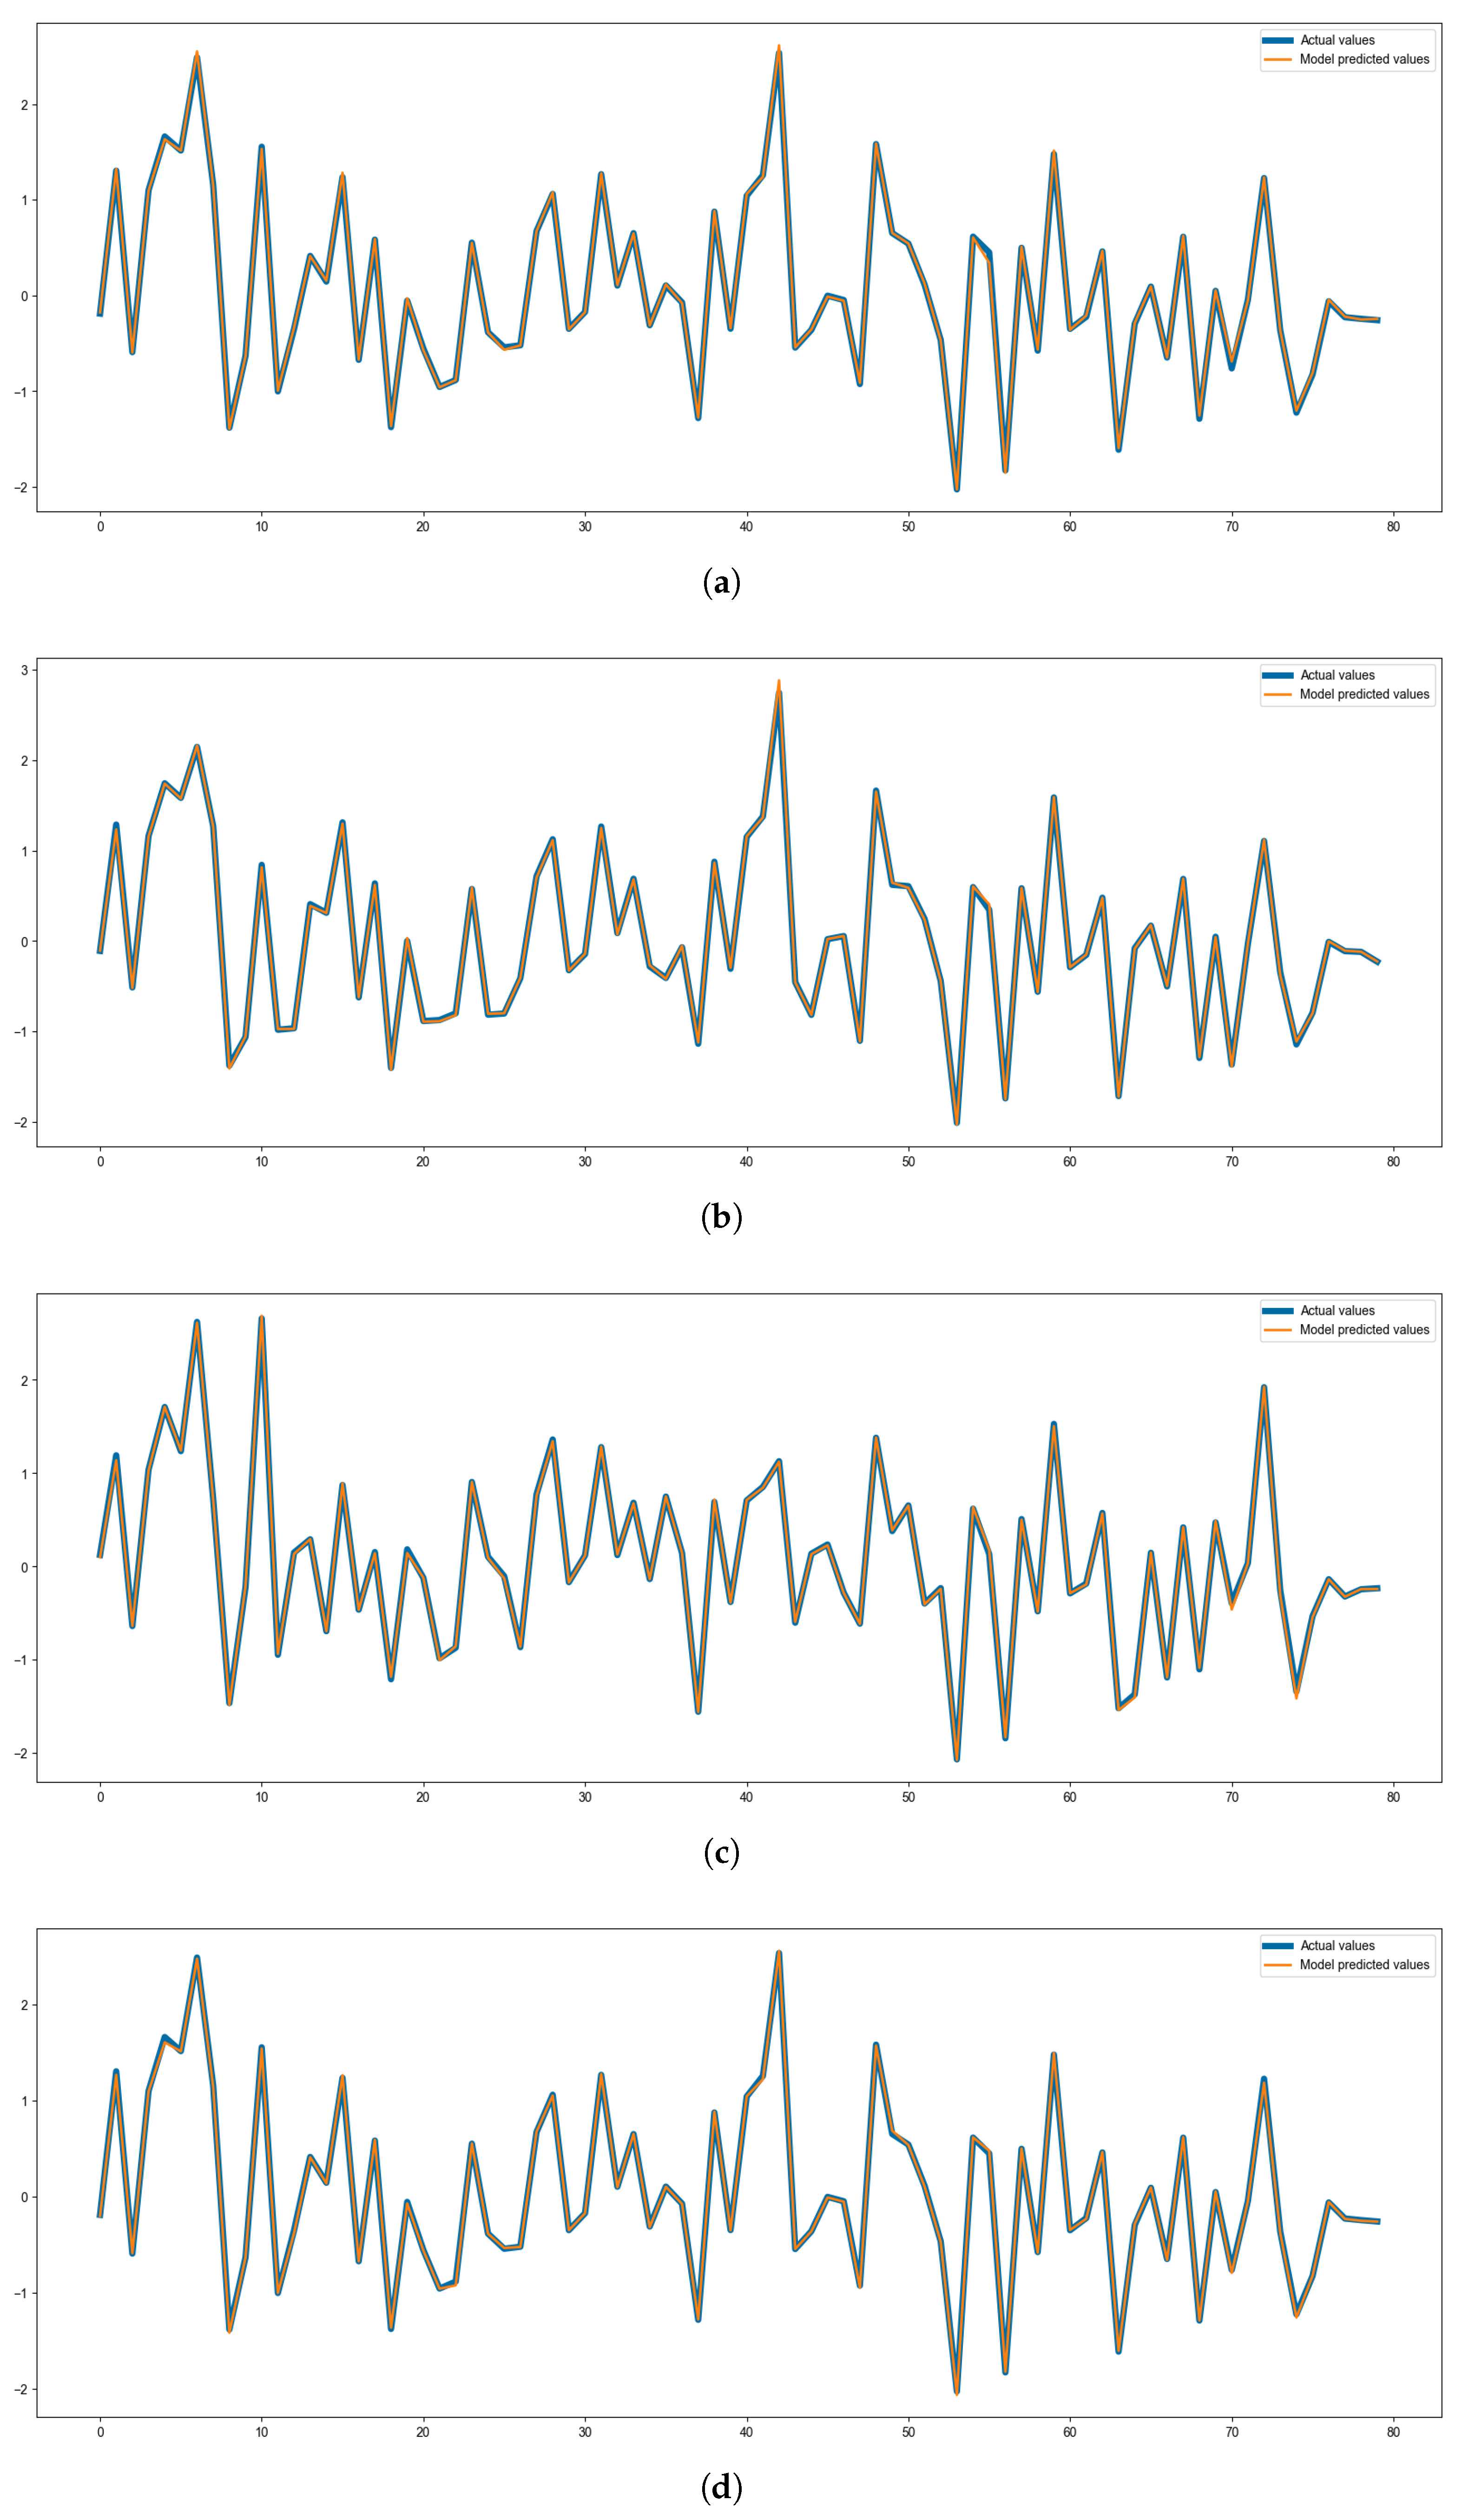
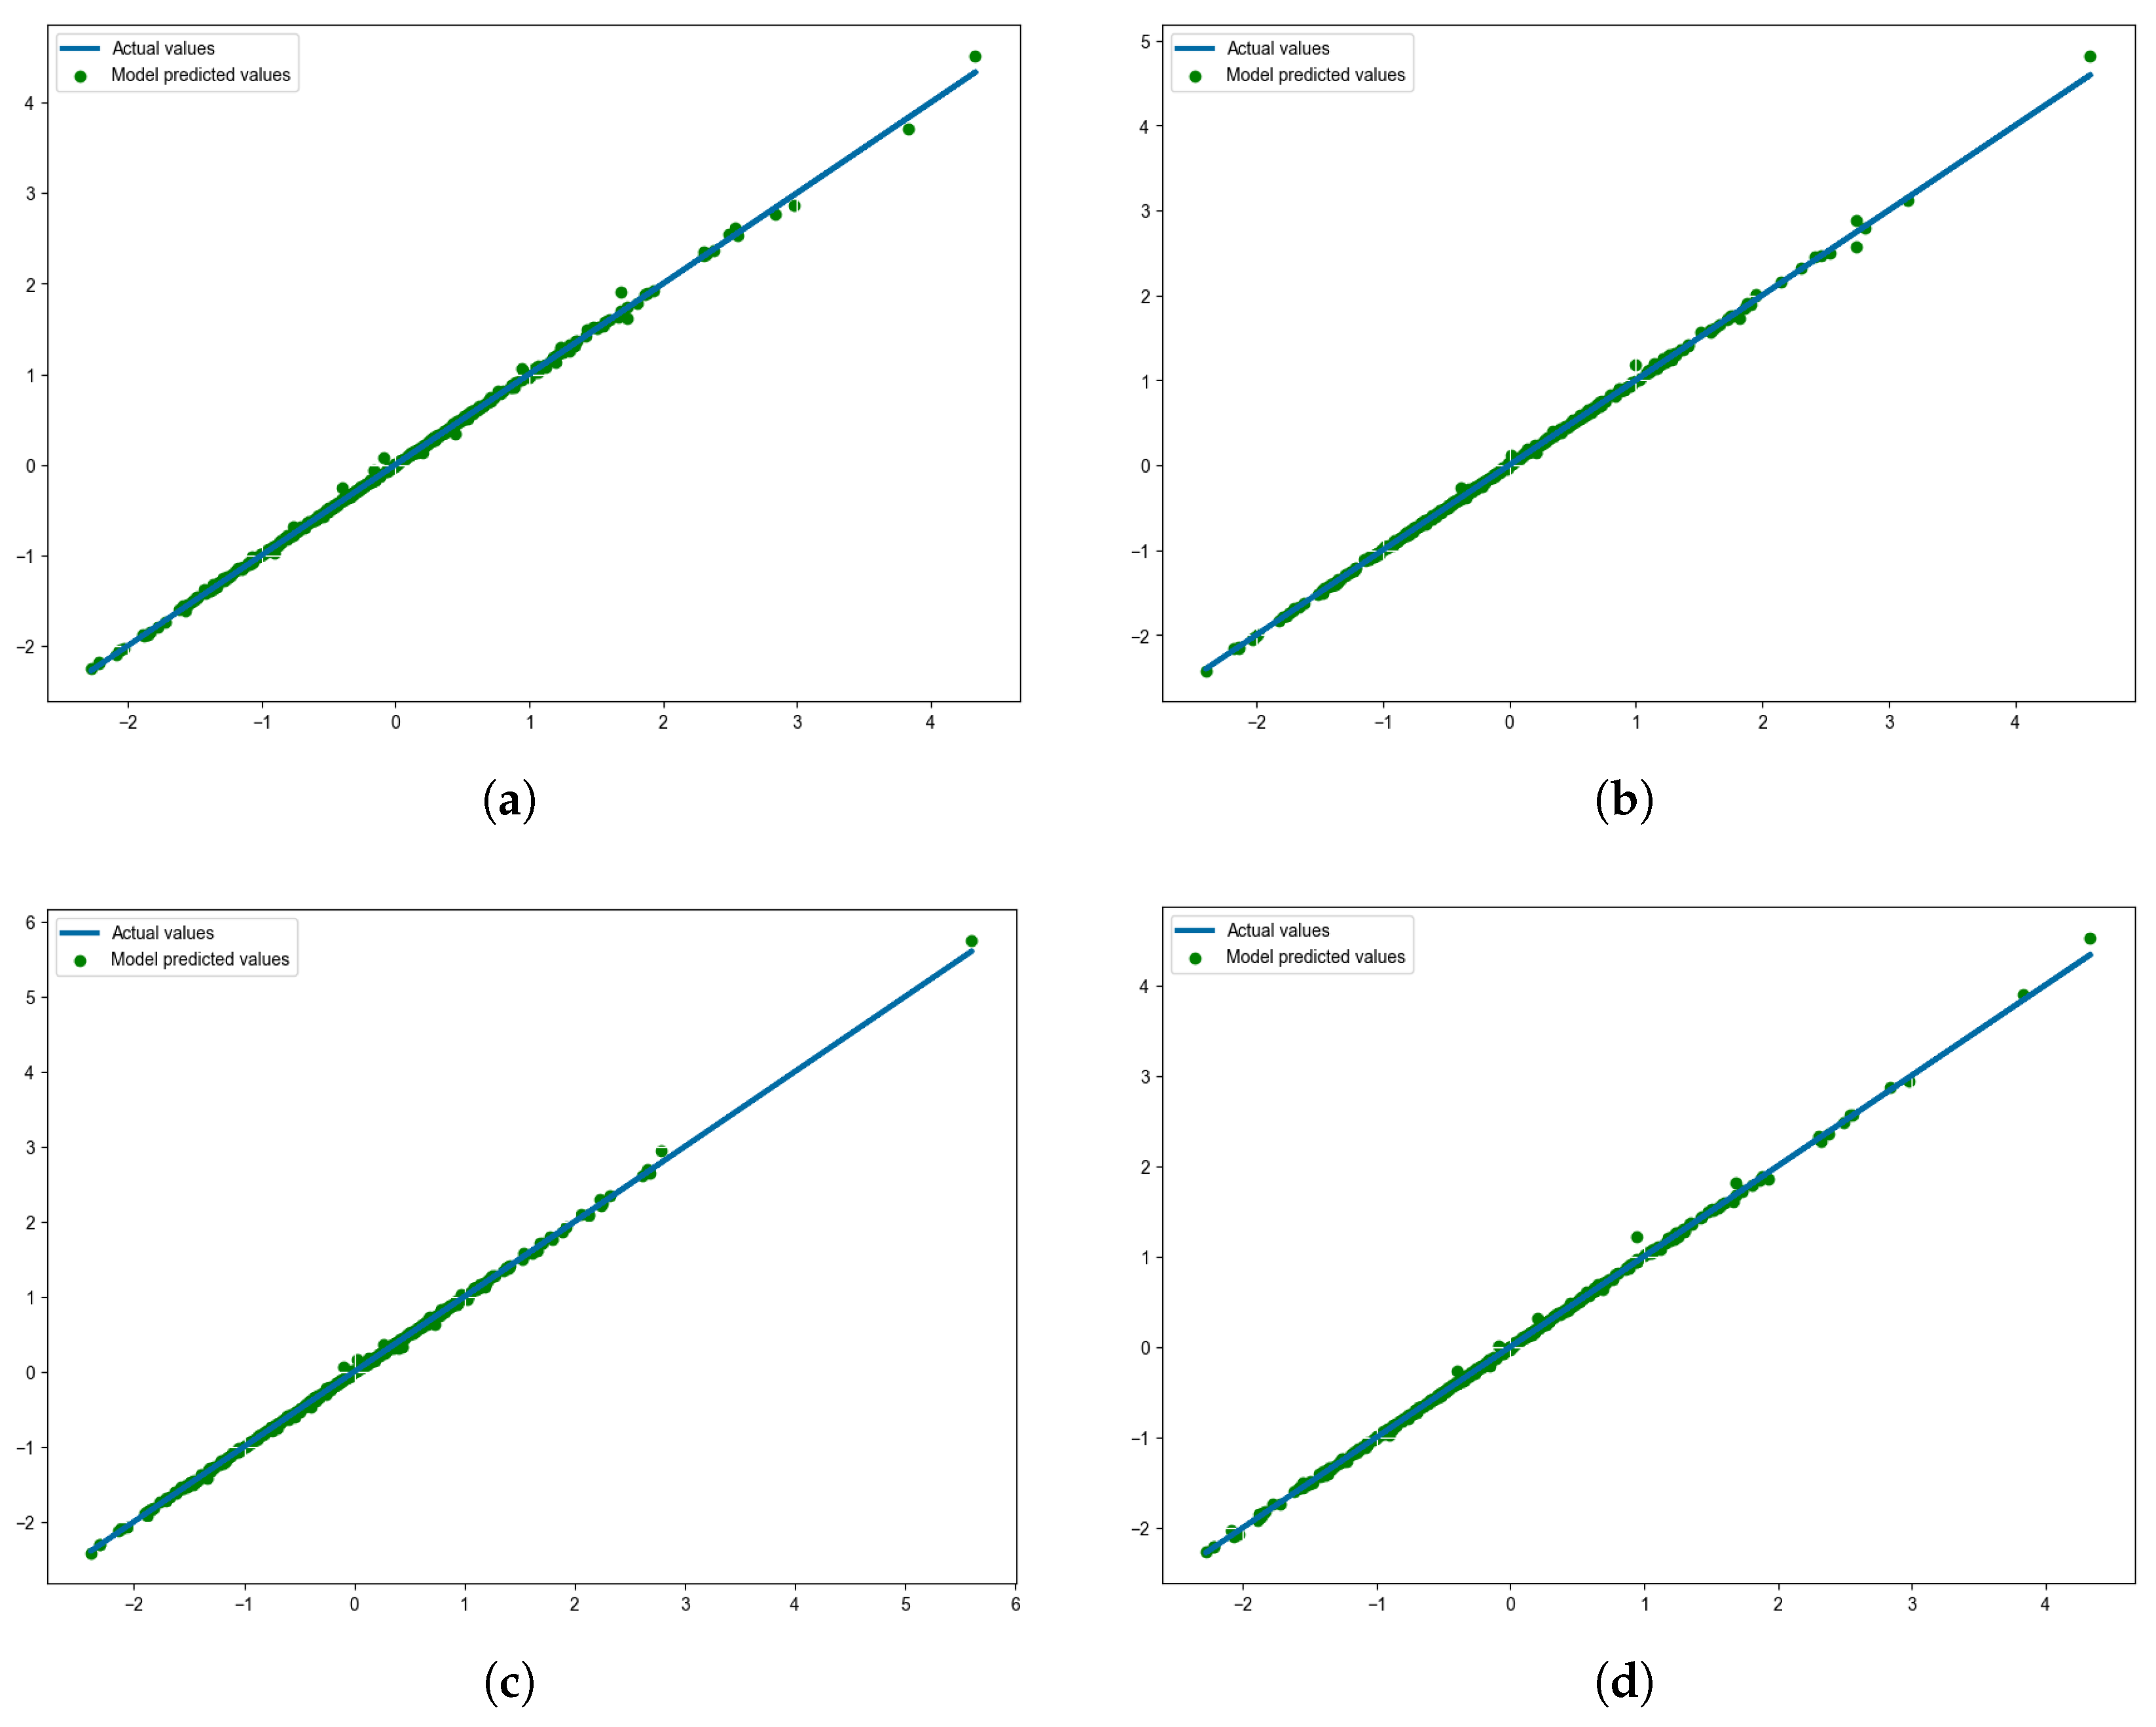
Figure 3 and
Figure 4 provide a visual comparison and regression analysis of the predicted Mechanical Power versus the ground truth values for all four calculation methods. The comparison plots (
Figure 3) show a near-perfect overlap between the predicted and actual values across a sample of test cases for each equation. Correspondingly, the data points in the regression plots (
Figure 4) form tight, linear clusters along the identity line, confirming a near perfect correlation across the entire range of MP values regardless of the target equation used for training. This visual evidence, combined with the high R
2 values ranging from 0.9989 to 0.9994, demonstrates that the hybrid CNN-BiLSTM architecture universally captures the physical laws governing energy transfer in pressure-controlled ventilation and effectively models both simplified and complex analytical formulas.
The distribution of residuals across all models consistently centres around zero in a Gaussian-like manner. The deep learning approach does not demonstrate systematic bias, as it neither consistently overestimates nor underestimates the mechanical power for any of the established equations. The consistently low sMAPE values (3.80% to 4.87%) in
Table 1 indicate that the relative error remains minimal across both low and high power settings for all calculation methods. Consistency is crucial for clinical safety, as it ensures reliable energy monitoring across the spectrum of respiratory conditions encountered in protective ventilation strategies.
4. Discussion
While analytical Equations (1)–(4) provide a theoretical basis for Mechanical Power, their bedside application is often hindered by the need for high-fidelity inputs like airway resistance and compliance, which are not always displayed in real-time on standard ventilators. Our 1D CNN-BiLSTM model offers a “sensor-fusion” advantage: it can learn to estimate MP even when specific variables are noisy or difficult to measure manually. Unlike static equations, the bidirectional LSTM layers capture the temporal dynamics of the respiratory cycle, allowing the model to adapt to breath-to-breath variations that simplified models might miss.
For the clinicians, this model could be integrated into ventilator software to provide continuous MP monitoring, alerting the clinicians to risks of Ventilator-Induced Lung Injury (VILI) without requiring manual calculations. The exceptionally high values (from 0.9989 to 0.9994) reflect the model’s ability to perfectly capture the physical relationships defined by the equations. The minimal error rates (sMAPE < 5%) suggest that the model is suitable for clinical applications where real-time monitoring of energy delivery is essential to prevent lung injury. Future validation on external clinical datasets is required to ensure generalization across different ventilator brands and patient cohorts.
Future research will focus on assessing the impact of feature reduction on model performance. We aim to determine whether predictive accuracy remains reliable when using a more simplified set of mechanical power parameters. We will systematically exclude lower-ranking variables, based on the feature importance rankings established in our prior work [
5], to determine the minimal optimal feature subset.
5. Conclusions
This research successfully demonstrates that a 1D CNN-BiLSTM hybrid model can accurately estimate Mechanical Power in pressure-controlled ventilation with near-perfect correlation to established physical equations. By integrating feature extraction through CNN blocks and temporal sequence modeling via BiLSTMs, the architecture overcomes the limitations of static analytical formulas, adapting to breath-to-breath variations. Notably, the inclusion of a feature-masking regimen ensures that the model remains clinically viable even during sensor disconnections or data delays, providing a robust “graceful degradation” rather than failure. These findings suggest that deep learning-based MP monitoring can be seamlessly integrated into digital twin frameworks to assist clinicians in mitigating VILI risks in real-time. Future work will investigate the minimal optimal feature subset required to maintain this high degree of accuracy, potentially simplifying the model for broader hardware compatibility.
Author Contributions
Conceptualization, R.P. and S.A.-S.; methodology, R.P.; software, R.P.; validation, R.P., S.A.-S. and I.M.; formal analysis, R.P., S.A.-S. and N.S.; investigation, R.P.; resources, I.M.; data curation, R.P.; writing-original draft preparation, R.P.; writing-review and editing, S.A.-S., N.S. and I.M.; visualization, R.P.; supervision, S.A.-S.; project administration, S.A.-S.; funding acquisition, R.P. All authors have read and agreed to the published version of the manuscript.
Funding
This research was funded by the European Regional Development Fund within the Operational Programme “Education 2021–2027”, Project № BG05SFPR001-3.004-0018-C01 “Support for project-based PhD studies” in the professional field of “Electrical Engineering, Electronics and Automation” at the “Technical University—Sofia”.
Institutional Review Board Statement
Not applicable.
Informed Consent Statement
Not applicable.
Data Availability Statement
The data used in this study are openly available in VitalDB, a high-fidelity multi-parameter vital signs database of surgical patients maintained by the Department of Anesthesiology and Pain Medicine, Seoul National University College of Medicine. The dataset is freely accessible upon registration at
https://vitaldb.net accessed on 12 May 2026. The database is described in detail at
https://doi.org/10.1038/s41597-022-01411-5.
Acknowledgments
We would like to express our gratitude to the programme “Research, Innovation and Digitalisation for Smart Transformation” 2021-2027, funded by the European Union, Project BG16RFPR002-1.014-0007 “Center for Competence “PERIMED-2” for supporting this article.
Conflicts of Interest
The authors declare no conflicts of interest. The funders had no role in the design of the study; in the collection, analyses, or interpretation of data; in the writing of the manuscript; or in the decision to publish the results.
Abbreviations
The following abbreviations are used in this manuscript:
| ICU | Intensive Care Unit |
| MP | Mechanical Power |
| VILI | Ventilator-Induced Lung Injury |
| ARDS | Acute Respiratory Distress Syndrome |
| VCV | Volume-Controlled Ventilation |
| PCV | pressure-controlled ventilation |
| DT | Digital Twin |
| sB | Simplified Becher |
| cB | Comprehensive Becher |
| VdM | Van der Meijden |
| LM | Linear Model |
| PEEP | Positive End-Expiratory Pressure |
| R2 | Coefficient of Determination |
| 1D | One-Dimensional |
| CNN | Convolutional Neural Network |
| LSTM | Long Short-Term Memory |
| BiLSTM | Bidirectional Long Short-Term Memory |
| RNN | Recurrent Neural Network |
| Adam | Adaptive Moment Estimation |
| MAE | Mean absolute error |
| RMSE | Root Mean Squared Error |
| sMAPE | Symmetric Mean Absolute Percentage Error |
| MAPE | Mean Absolute Percentage Error |
References
- Trinkle, C.A.; Broaddus, R.N.; Sturgill, J.L.; Waters, C.M.; Morris, P.E. Simple, accurate calculation of mechanical power in pressure controlled ventilation (PCV). Intensive Care Med. Exp. 2022, 10, 22. [Google Scholar] [CrossRef] [Scilit]
- Kim, T.W.; Chung, C.R.; Nam, M.; Ko, R.E.; Suh, G.Y. Associations of mechanical power, ventilatory ratio, and other respiratory indices with mortality in patients with acute respiratory distress syndrome undergoing pressure-controlled mechanical ventilation. Front. Med. 2025, 12, 1553672. [Google Scholar] [CrossRef] [Scilit]
- Merola, R.; Battaglini, D.; Schultz, M.J.; Rocco, P.R. Physiology-guided personalized mechanical ventilation to prevent ventilator-induced lung injury. Front. Med. 2026, 13, 1764151. [Google Scholar] [CrossRef] [Scilit]
- Alharthi, S. AI-powered in silico twins: Redefining precision medicine through simulation, personalization, and predictive healthcare. Saudi Pharm. J. 2026, 34, 1. [Google Scholar] [CrossRef] [Scilit]
- Petrova, R.; Ahmed-Shieva, S.; Shakev, N.; Minev, I. Pre-processing and Data Analysis of Mechanical Ventilation Parameters used in Mechanical Power. In Proceedings of the 2025 International Conference Automatics and Informatics (ICAI); IEEE: Varna, Bulgaria, 2025; pp. 288–292. [Google Scholar]
- Lee, H.C.; Park, Y.; Yoon, S.B.; Yang, S.M.; Park, D.; Jung, C.W. VitalDB, a high-fidelity multi-parameter vital signs database in surgical patients. Sci. Data 2022, 9, 279. [Google Scholar] [CrossRef] [Scilit] [PubMed]
- Becher, T.; Van der Staay, M.; Schädler, D.; Frerichs, I.; Weiler, N. Calculation of mechanical power for pressure-controlled ventilation. Intensive Care Med. 2019, 45, 1321–1323. [Google Scholar] [CrossRef] [Scilit] [PubMed]
- van der Meijden, S.; Molenaar, M.; Somhorst, P.; Schoe, A. Calculating mechanical power for pressure-controlled ventilation. Intensive Care Med. 2019, 45, 1495–1497. [Google Scholar] [CrossRef] [Scilit] [PubMed]
- Pedregosa, F.; Varoquaux, G.; Gramfort, A.; Michel, V.; Thirion, B.; Grisel, O.; Blondel, M.; Prettenhofer, P.; Weiss, R.; Dubourg, V.; et al. Scikit-learn: Machine learning in Python. J. Mach. Learn. Res. 2011, 12, 2825–2830. [Google Scholar]
- Goodfellow, I.; Bengio, Y.; Courville, A.; Bengio, Y. Deep Learning; MIT Press: Cambridge, MA, USA, 2016; Volume 1. [Google Scholar]
- Little, R.J.; Rubin, D.B. Statistical Analysis with Missing Data; John Wiley & Sons: Hoboken, NJ, USA, 2019. [Google Scholar]
- Śmieja, M.; Struski, Ł.; Tabor, J.; Zieliński, B.; Spurek, P. Processing of missing data by neural networks. In Proceedings of the 32nd Conference on Neural Information Processing Systems (NeurIPS 2018), Montréal, QC, Canada, 2–8 December 2018. [Google Scholar]
- Yamashita, R.; Nishio, M.; Do, R.K.G.; Togashi, K. Convolutional neural networks: An overview and application in radiology. Insights Imaging 2018, 9, 611–629. [Google Scholar] [CrossRef] [Scilit] [PubMed]
- Kingma, D.P.; Ba, J. Adam: A method for stochastic optimization. arXiv 2014, arXiv:1412.6980. [Google Scholar]
| Disclaimer/Publisher’s Note: The statements, opinions and data contained in all publications are solely those of the individual author(s) and contributor(s) and not of MDPI and/or the editor(s). MDPI and/or the editor(s) disclaim responsibility for any injury to people or property resulting from any ideas, methods, instructions or products referred to in the content. |