1. Introduction
Additive manufacturing by fused filament fabrication (FFF, also termed fused deposition modeling, FDM) is increasingly used to produce not only mechanical parts but also optically functional components for lighting, architecture, and microfluidics. Transparent thermoplastics such as polyethylene terephthalate glycol (PETG) are of particular interest because they combine good processability with high impact resistance and nominal optical clarity, making them candidates for lighting covers, façade elements, and microfluidic chips where controlled light transmission is required [
1,
2,
3,
4,
5]. However, the layerwise deposition inherent to FDM introduces internal porosity, interlayer interfaces, and surface roughness that fundamentally alter the optical behavior relative to extruded or thermoformed sheets, typically reducing transmittance and increasing scattering and haze [
1,
3,
6,
7,
8,
9].
A growing body of work has therefore focused on understanding and improving the transparency of FDM-printed PETG. Petrov and co-workers systematically examined PETG processed using FFF, showing that the light transmittance coefficient depends on sample thickness and build orientation, and that printed PETG laminates exhibit substantially lower transmission than commercial 0.8–1.0 mm PETG sheets at visible wavelengths [
1,
6]. In the same line of research, they demonstrated that post-printing chemical surface treatments can dramatically modify optical performance: immersion (“dipping”) yields samples described as practically transparent, whereas spray treatments result in transmission coefficients 25–50% lower than dipped parts, underscoring the sensitivity of PETG optics to surface condition [
1]. Related work on PETG microfluidic devices has highlighted the need to optimize printing parameters such as layer height, speed, and cooling to achieve sufficient transparency for bright-field cell imaging, often by combining PETG with optically smooth PDMS interfaces [
4].
Beyond these early studies, several groups have investigated how FDM process parameters influence light transmission in PETG at fixed thickness. Wang et al. used transparent PETG filament and a UV–Vis spectrophotometer (ISO 26723) to quantify how layer height, extrusion rate, and printing speed affect spectral transmittance of 1 mm-thick plates, attributing losses primarily to structural defects such as bonding-neck gaps, bubble cavities, and filament cross-section geometry [
7]. Doğru extended this approach by exploring nozzle temperature, layer thickness, print speed, and orientation for PETG produced using material extrusion, reporting that very fine layers and optimized temperatures can maximize measured visible and UV transmittance and linking the results to transparency standards relevant to lighting covers [
2]. In a broader comparative study of PLA, PMMA, and PETG, Beníček et al. showed that nozzle diameter, layer height, and printing temperature significantly influence the structure and surface shape of FDM parts and, consequently, their light transmission behavior [
8].
For architectural and solar applications, Piccioni et al. applied a design-of-experiments framework to large PETG façade panels, varying extrusion temperature, printing speed, cooling, layer height, and number of contours, and characterizing the resulting samples with a goniophotometer to obtain angle-resolved transmission and reflection (BSDF), normal transmissivity, and haze [
3]. They reported normal transmissivity values on the order of 60–90% and haze between roughly 55–97%, directly linking layer architecture and internal void morphology to angular scattering properties of the printed PETG [
3]. In parallel, studies on 3D-printed optical components for LED fixtures have demonstrated that print layer height, orientation, and other parameters measurably affect spectral transmission and reflectivity, and that long-term aging at elevated temperatures can further modify these optical properties [
5]. Together, these works establish PETG as a viable material for printed transmissive optics while emphasizing the complexity of its process–structure–optics relationships.
Although PETG is the material of interest for many optical applications, closely related investigations on PLA provide important methodological precedents. Wang and Zhou printed PLA lampshade specimens with systematically varied wall thickness (0.8–2.4 mm) and layer height (0.1–0.3 mm), using a UV–Vis spectrophotometer with an integrating sphere (ISO 14782:2021) [
10] to measure spectral transmittance and haze [
9]. They found that transmittance decreases with increasing thickness and with decreasing layer height, while haze increases with thickness, illustrating the strong role of multiple scattering and interface density in governing optical behavior [
9]. Vochozka et al. measured the “translucency” of 1 mm PLA plates—essentially total transmitted luminous flux—using a luxmeter inside an integrating sphere, and showed via ANOVA that orientation, layer height, nozzle temperature, fan speed, extrusion multiplier, and speed each have statistically significant effects on hemispherical transmission [
11]. These PLA studies demonstrate robust integrating-sphere protocols for quantifying total transmission and haze in FDM parts and clearly reveal non-Beer–Lambert thickness dependence in strongly scattering printed polymers [
9,
11].
Despite this progress, there remains a notable gap in the literature. Existing PETG studies either consider thickness and surface treatment within broader “printing modes” where multiple process parameters change simultaneously [
1,
6], optimize printing parameters at fixed thickness without systematically varying thickness or surface finish as independent factors [
2,
4,
7,
8], or explore angle-resolved scattering and façade-scale behavior under multi-factor designs [
3]. Moreover, optical measurements are typically performed with spectrophotometers or goniophotometers whose illumination spectra are not explicitly matched to specific LED sources, and they seldom report total hemispherical visible-light transmittance under a characterized LED illuminant [
1,
3,
5,
6,
7,
8,
9,
11]. To date, no study has been identified that uses PETG in FDM, holds all other printing parameters fixed, and then systematically varies both sample thickness and surface finish or roughness—through controlled post-processing or surface conditioning—while quantifying total visible-light transmittance under well-defined LED illumination.
Addressing this gap is important for application domains where thickness and surface finish are primary design degrees of freedom, such as LED diffusers and covers, daylight-modulating façade elements, and transparent or translucent microfluidic devices. A controlled, factorial investigation of thickness and surface finish effects on the total visible-light transmittance of FDM-printed PETG, using integrating-sphere-based measurements and calibrated LED spectra, would therefore provide both fundamental insight into the interplay between bulk scattering and surface losses and practical design data for engineering optically tuned PETG components [
1,
2,
3,
4,
5,
6,
7,
9,
11].
The purpose of this article is to investigate the overall light transmittance of semi-transparent materials used in additive manufacturing. In order to conduct this study, test samples with varying thicknesses and combinations of finished surfaces are produced. The measurements are performed using a stand specially designed for this purpose.
2. Materials and Methods
The following section details the materials and methods employed in conducting this study. The text provides a comprehensive overview of the test setup, the test specimen, the materials used, the printing parameters, the 3D printing technology, the printer used, the method for calculating permeability, and the normal distribution test.
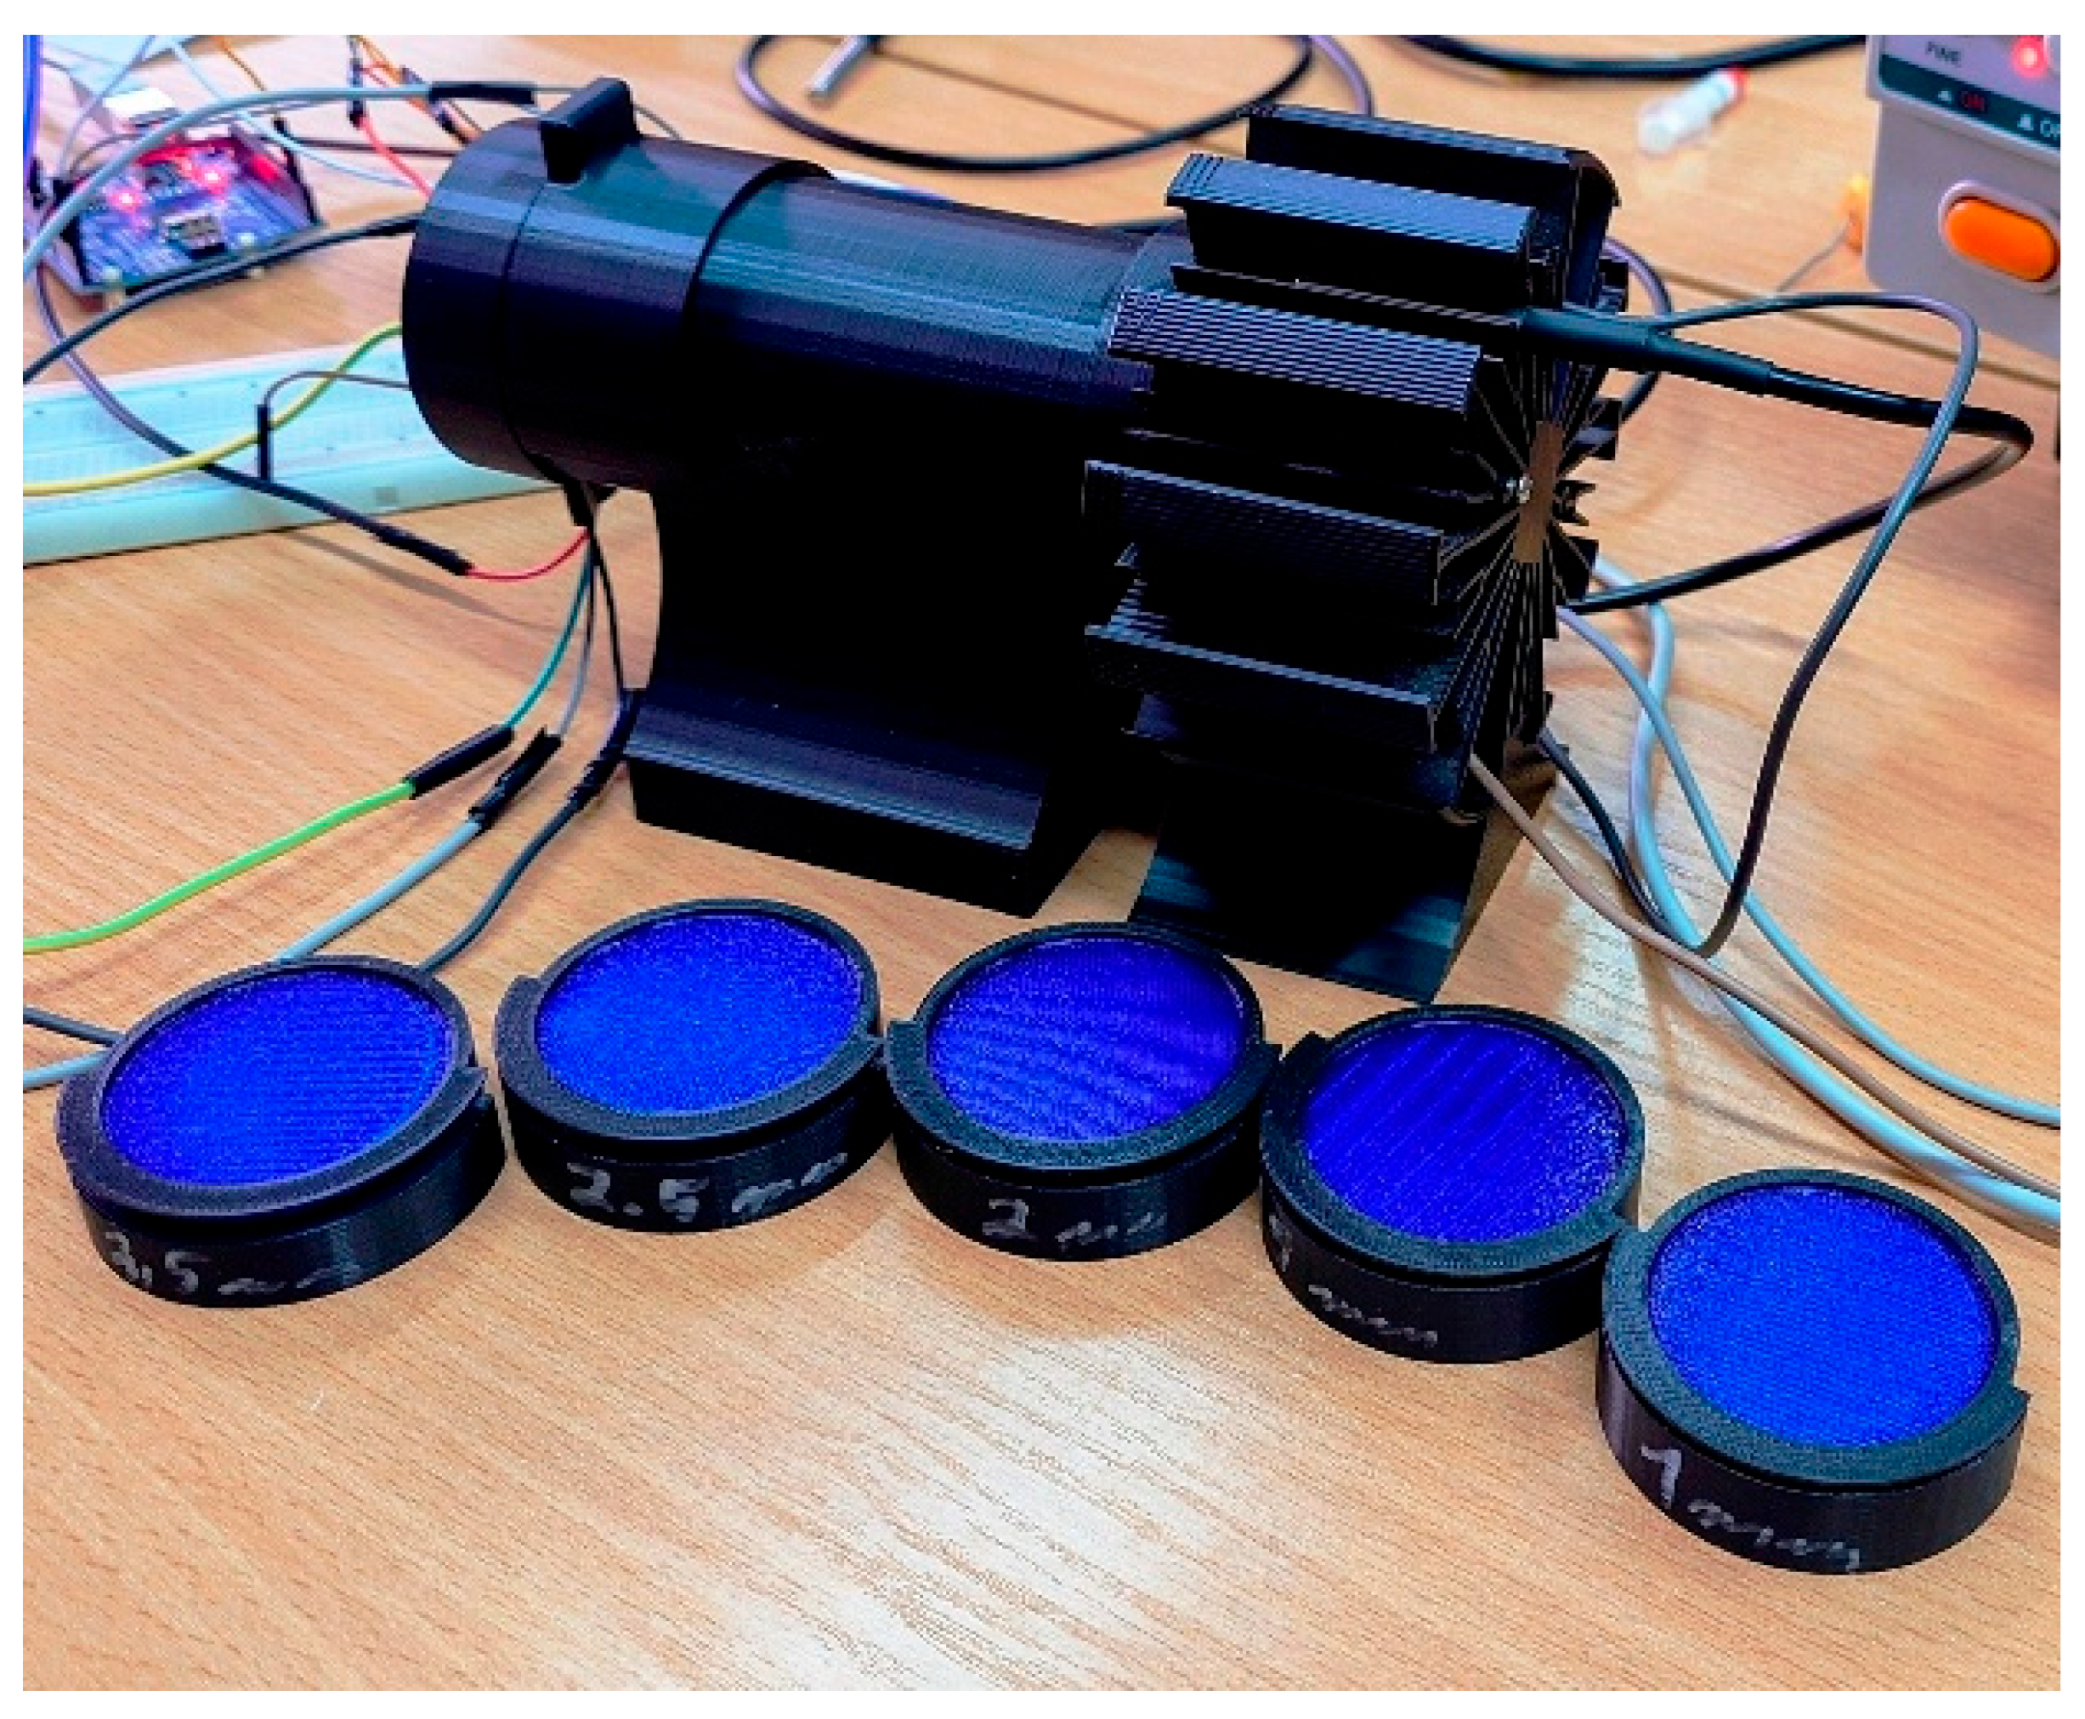
The experimental section of this article is based on a stand that was previously developed and tested for measuring ordinary light transmittance, see
Figure 1. The primary structure of the test bench has been entirely manufactured using additive manufacturing techniques. The addition of a light source, a measuring device, temperature sensors, and control units has been incorporated into the design. The control system is based on an Arduino ESP32 microcontroller (Arduino, Ivrea, Italy). The test specimens are to be placed in specially designed holders, which are then positioned between the light source and the measuring sensor. The test specimen holders guarantee a consistent separation between the light source and the test specimen. A series of measurements are obtained at predetermined intervals and under varying light source intensities. This stand is designed to measure the light transmittance of semi-transparent materials used in additive manufacturing, with diameters of 45 mm and thicknesses of 1, 1.5, 2, 2.5, 3 and 3.5 mm.
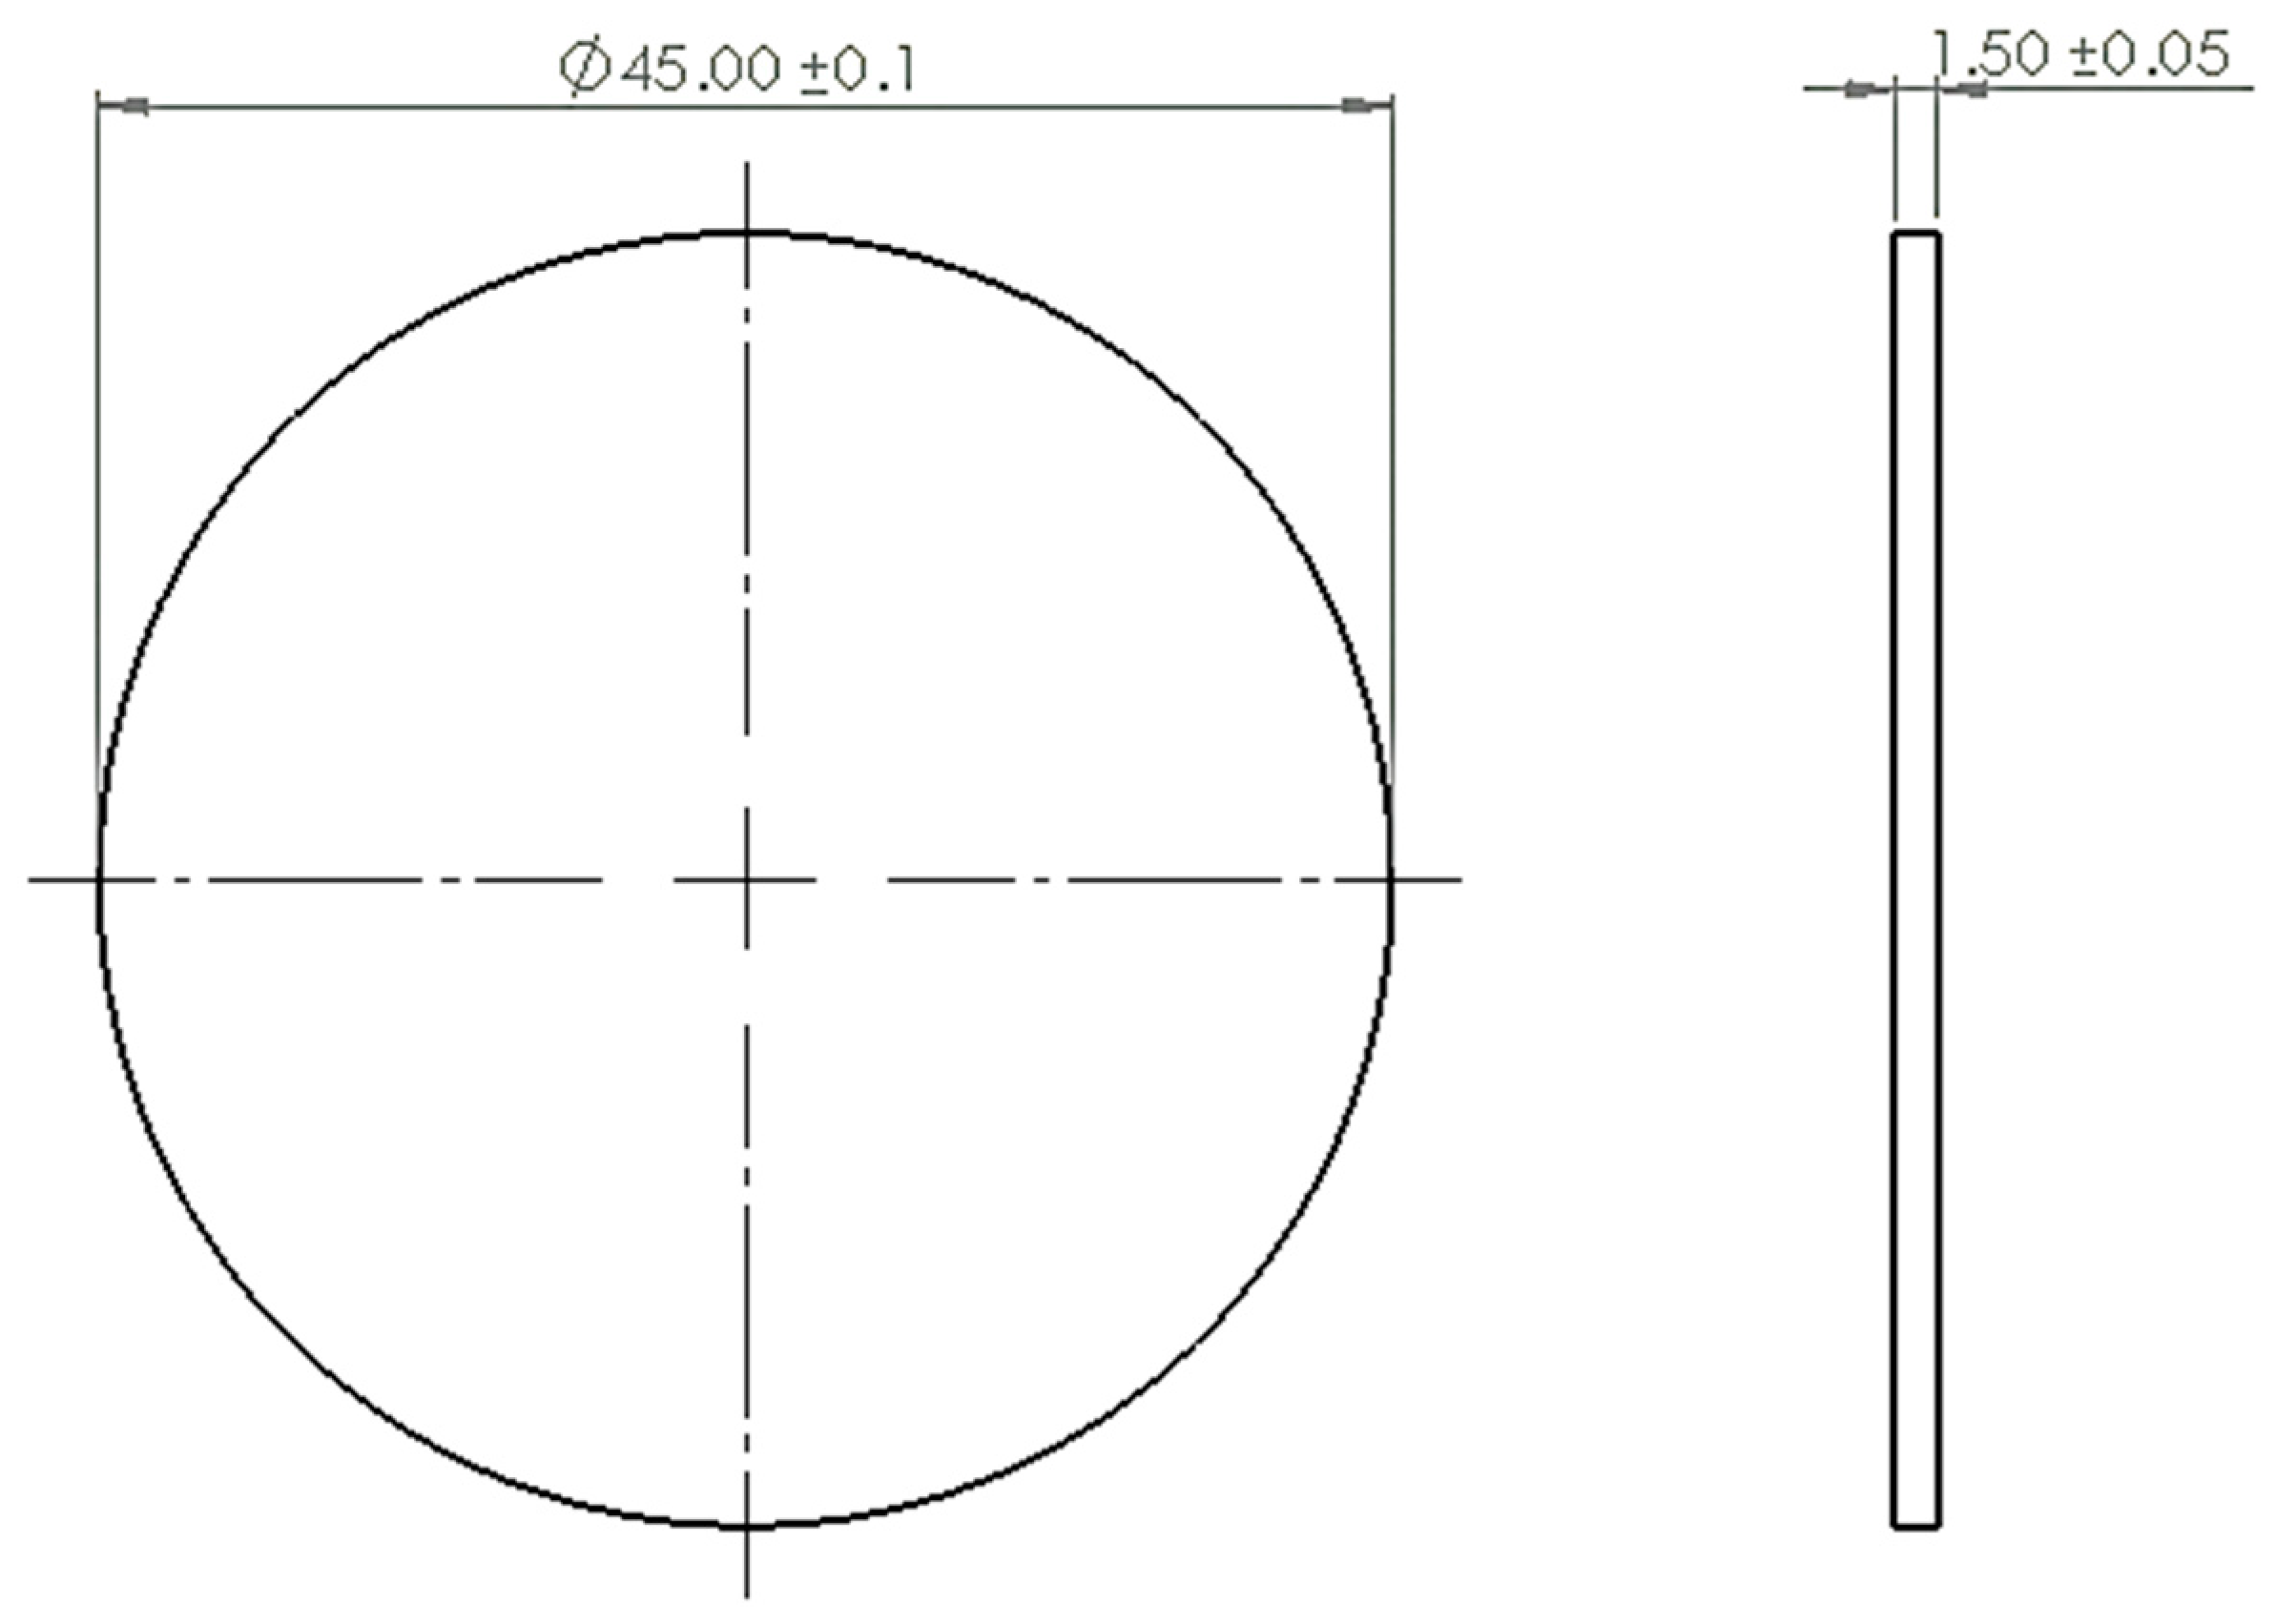
The basic experimental sample scheme is shown in
Figure 2. All the samples in this study are made from white transparent PETG and with the same printing parameters. The technical specification of PETG is shown in
Table 1; the printing parameters are also presented in
Table 2.
Polyethylene terephthalate glycol (PETG) is a glycol-modified PET copolyester widely used in fused deposition modeling (FDM/FFF) because it offers a useful balance of toughness, chemical resistance, low warpage, and good interlayer adhesion. Compared with PLA and ABS, PETG is often described as a middle-ground material: easier to print than ABS and generally tougher and more heat-resistant than PLA, although it can be prone to stringing and has only moderate thermal resistance near its glass-transition range [
12,
13,
14].
Table 1.
Technical specification of PETG [
15].
Table 1.
Technical specification of PETG [
15].
| Chemical Name | Polyethylene Terephthalate Glycol Copolymer |
|---|
| Melting temperature | 210–260 °C |
| Working temperature (3D printer) | 250 ± 10 °C |
| Print bed temperature | 80 ± 10 °C |
| Print speed | up to 200 mm/s |
| Moisture absorption in 24 h | 0.07% |
| Moisture absorption in 7 days | 0.10% |
| Heat deflection temperature (0.45 MPa) | 68 °C |
| Heat deflection temperature (1.80 MPa) | 68 °C |
As illustrated in
Table 2, the printing parameters employed during the fabrication of the test specimens are delineated. The selection of parameters is informed by prior experimentation with the material and printer in use, specifically the nozzle and table temperatures. The remaining parameters are selected as the fundamental recommended settings.
Table 2.
Printing parameters.
Table 2.
Printing parameters.
| Parameter | Unit |
|---|
| Nozzle temperature | 245 °C |
| Bed temperature | 85 °C |
| Infill | 15% |
| Layer height | 0.15 mm |
| Infill pattern | Grid |
| Printing speed | 100%, basic |
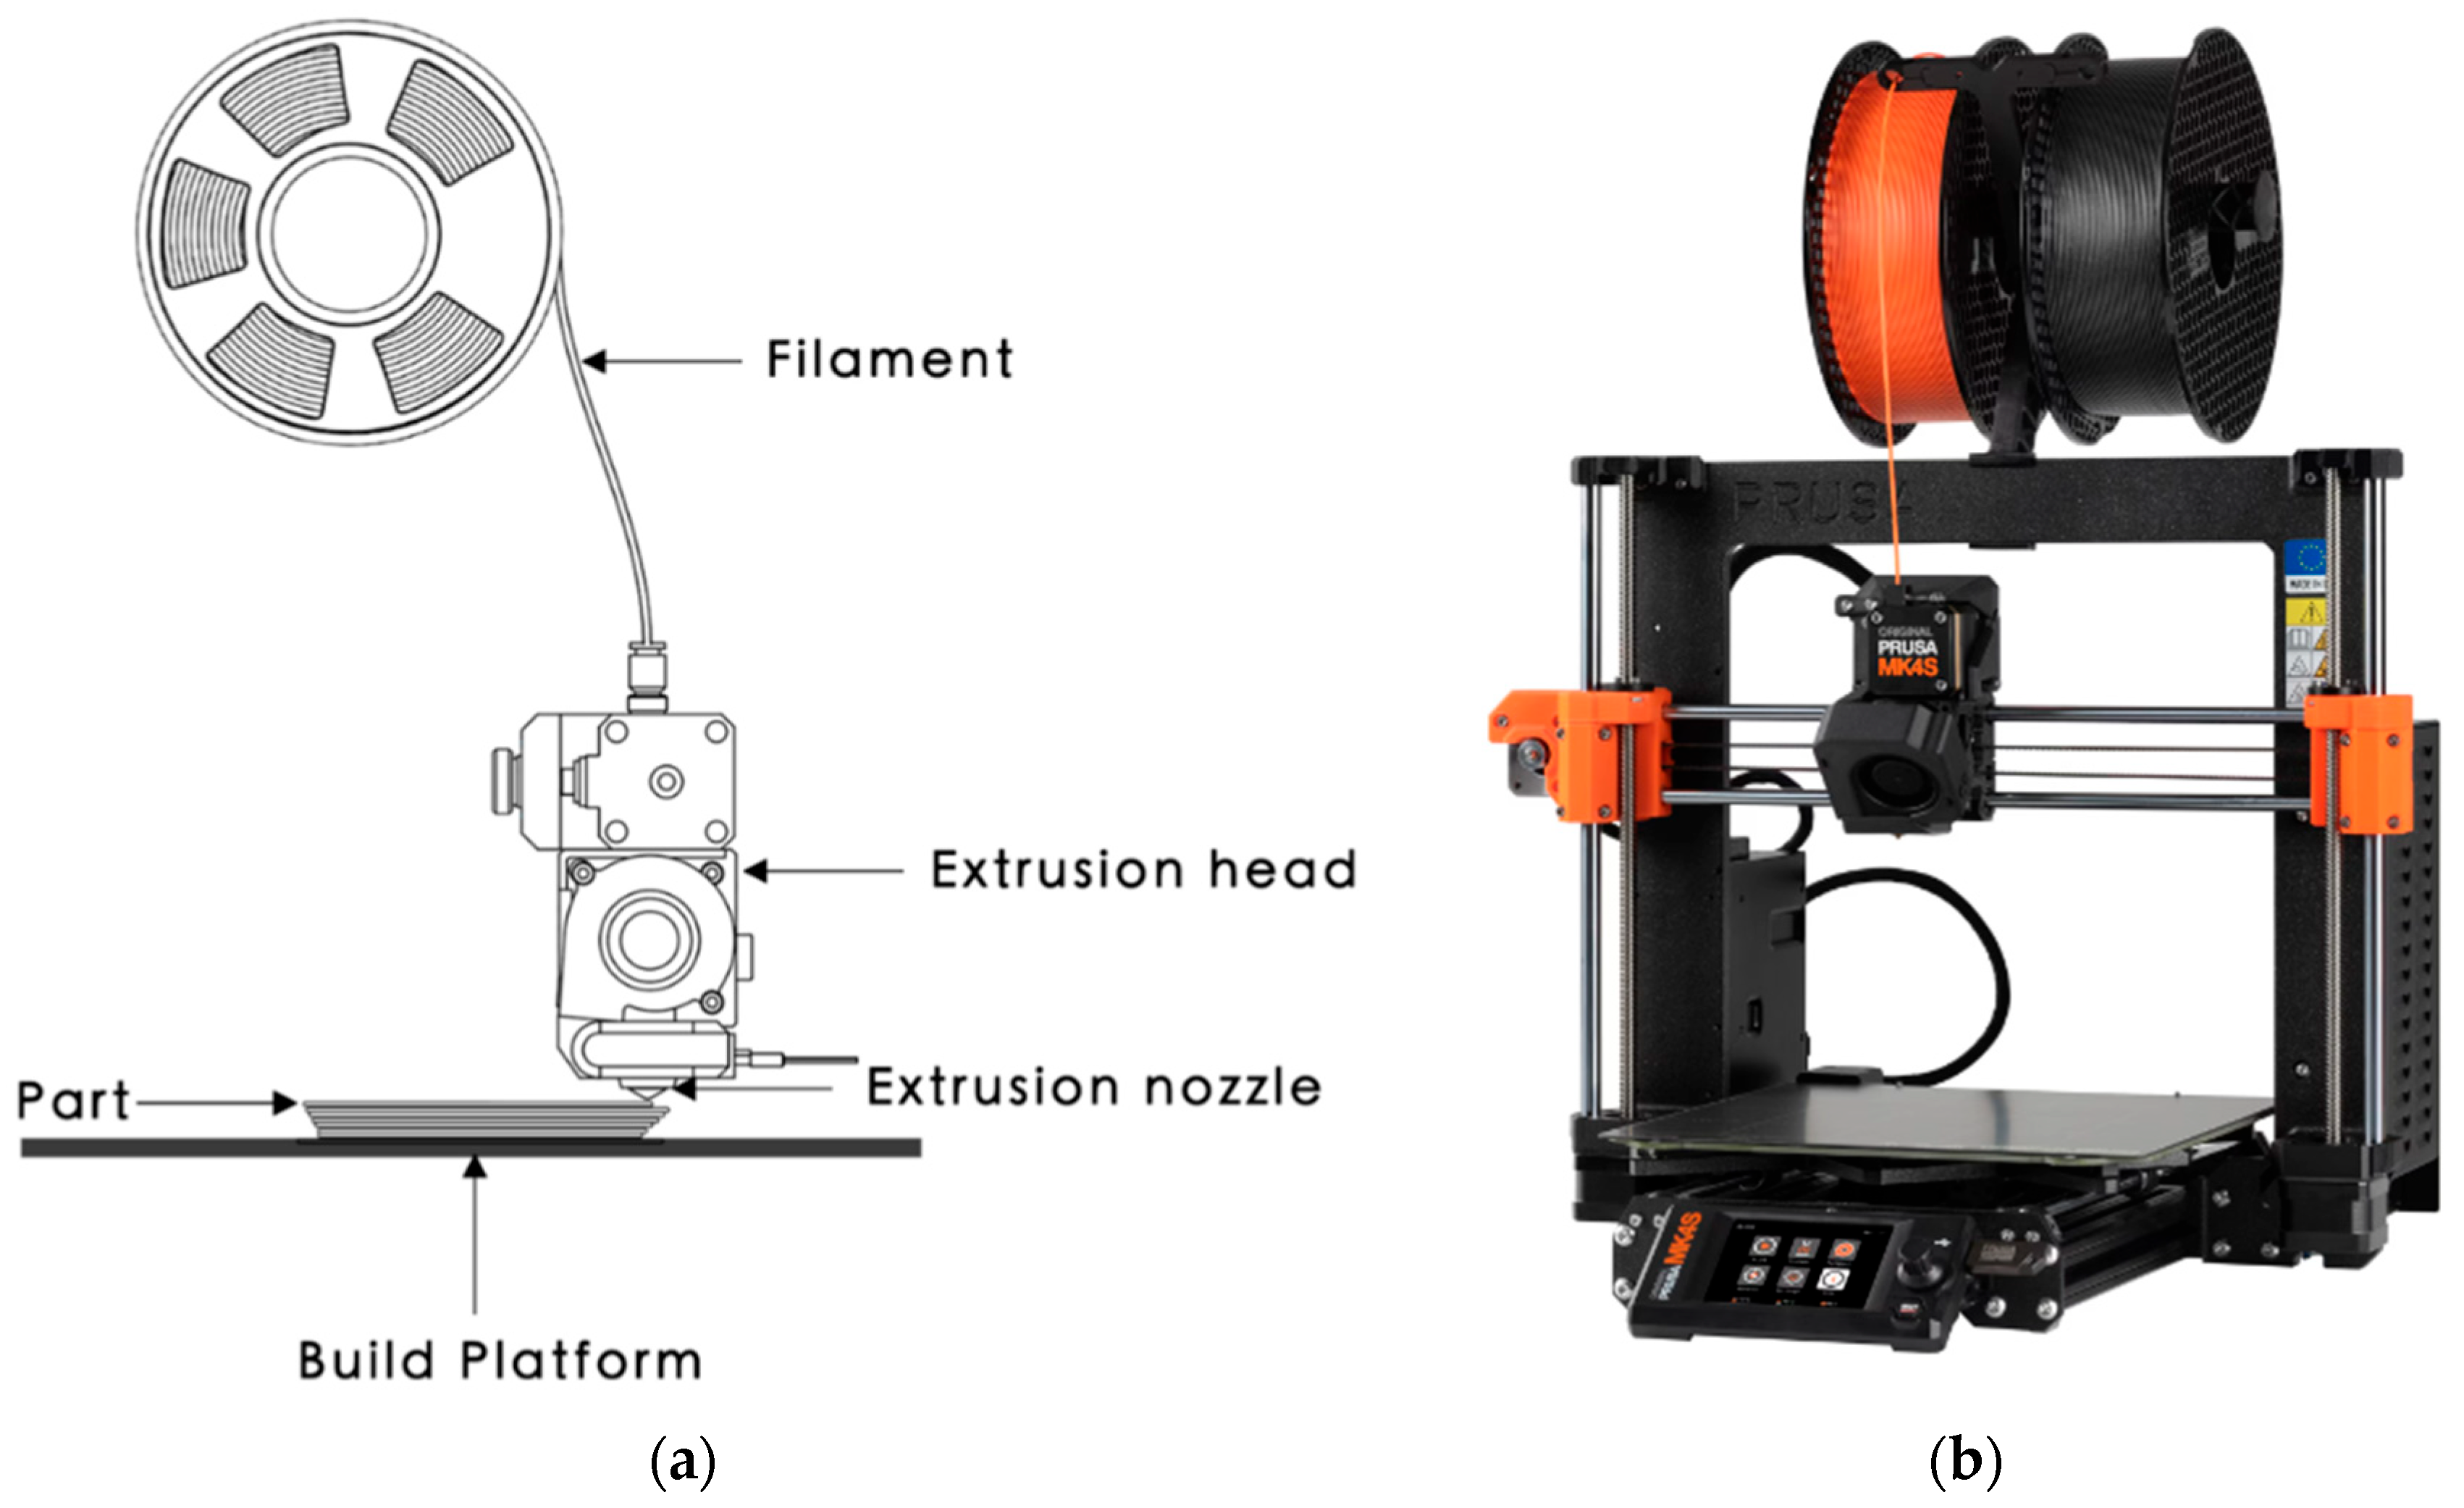
FDM, more generally termed material extrusion, is an additive manufacturing process in which a thermoplastic filament is fed into a heated nozzle, melted, and deposited layer by layer to build a part [
16,
17,
18]. Introductory reviews emphasize that print quality depends on the interaction between machine subsystems (feed mechanism, hot end, motion system, and build plate), material behavior (especially melt rheology and thermal properties), and process parameters such as layer height, print speed, extrusion temperature, raster angle, and build orientation [
16,
17,
18,
19]. Across the reviewed literature, a consistent theme is that the process is simple in concept but strongly affected by interlayer bonding, cooling history, and parameter coupling, which together govern defects, anisotropy, and final mechanical performance [
17,
18,
19].
Figure 3a represents the basics of FDM technology.
The production of the test details is facilitated by utilizing a Prusa MK4 printer, made by Prusa Research, Prague, Czech Republic, as illustrated in
Figure 3b. The characteristics of the printer utilized are enumerated in
Table 3. The MK4 printer represents the fourth generation of FMD printers from PRUSA Research, and is characterized by its reliability, high quality, and repeatability of finished parts. The employment of stepper motors with a step angle of 0.9° guarantees the fabrication of components of a superior quality.
The basic light transmittance is calculated as the difference between the illuminance from the calibration and the illuminance obtained from the measurement with the test sample in place (see Formula (1)). The unit of measurement employed for illuminance is lux (lx).
where
The attenuation is calculated as the ratio between the transmittance and the calibration value. The results are expressed as a percentage (%). The formula used to calculate this is given below:
where
The Shapiro–Wilk test is one of the most widely used statistical tests for assessing whether a sample comes from a normal distribution [
21,
22]. It was originally introduced by Shapiro and Wilk (1965) as an analysis-of-variance-style goodness-of-fit test based on the ordered sample values [
21]. The null hypothesis is that the observations are drawn from a normal distribution, typically with unknown mean and variance, while the alternative is that the data are not normally distributed [
22]. Its test statistic, usually denoted by
, compares the ordered observations with the values expected from a normal sample [
21,
22,
23]. More specifically,
is formed as a ratio between a squared weighted sum of the order statistics and the usual sample variability [
22,
23]. The weights
are derived from the expected normal order statistics and their covariance matrix, which gives the test its strong sensitivity to departures from normality [
23]. Values of
close to 1 indicate that the sample is broadly consistent with normality, whereas small values of
suggest deviations such as skewness or heavy tails [
22]. However, the interpretation of
depends on the sample size, so it is usually evaluated through a
p-value rather than by the raw statistic alone [
22,
24]. Because the null distribution of
is nonstandard and skewed,
p-values are obtained using approximations or numerical methods rather than a simple closed-form formula [
22,
24]. Later work by Royston provided practical approximations that made the Shapiro–Wilk test easier to implement in statistical software and applicable over a broader range of sample sizes [
24]. For this reason, the test is now routinely available in major statistical packages and is often recommended for small to moderate samples [
22,
24]. In applied research, it is commonly used together with Q–Q plots and other graphical checks, since formal significance tests can detect even small departures from normality in large samples [
23]. Overall, the Shapiro–Wilk test remains a standard and influential method because it combines a clear theoretical basis with strong empirical performance among univariate normality tests [
21,
22,
23].
The experimental data presented in
Section 3 were automatically collected using a custom-built test bench system. Furthermore, automated acquisition reduces operator-dependent variability and improves the reproducibility of measurements [
25,
26].
3. Results and Discussion
This section presents the results of the tests conducted on the measured samples. Thicknesses of 1, 1.5, 2, 2.5, 3, and 3.5 mm are produced. In consideration of the distinct characteristics inherent in the manufacturing process and the variegated textures observed on the finished surfaces, three distinct combinations are postulated: smooth–smooth, rough–smooth, and rough–rough. For each of the three combinations, one test sample is produced with the aforementioned thicknesses. A series of experiments are conducted at calibration illuminance levels ranging from 200 lx to 10,600 lx in increments of 800 lx for each thickness and each combination of finished surfaces. A total of thirty measurements are obtained for each study of illuminance, thickness, and surface. A substantial volume of data is obtained, the presentation of which is onerous. It is noteworthy that the measurement data for each position demonstrate minimal variation. For these reasons, and due to the marked similarity of the results obtained, a test for normal distribution is performed on a single sample. The findings of the test demonstrate that the sample in question adheres to the principles of the normal distribution law. Given that the measurements of each group demonstrate negligible differences of the order of ±1 lx, it is hypothesized that all samples adhere to a normal distribution law, and thus the data from these samples will be presented as the average value of the sample. As illustrated in
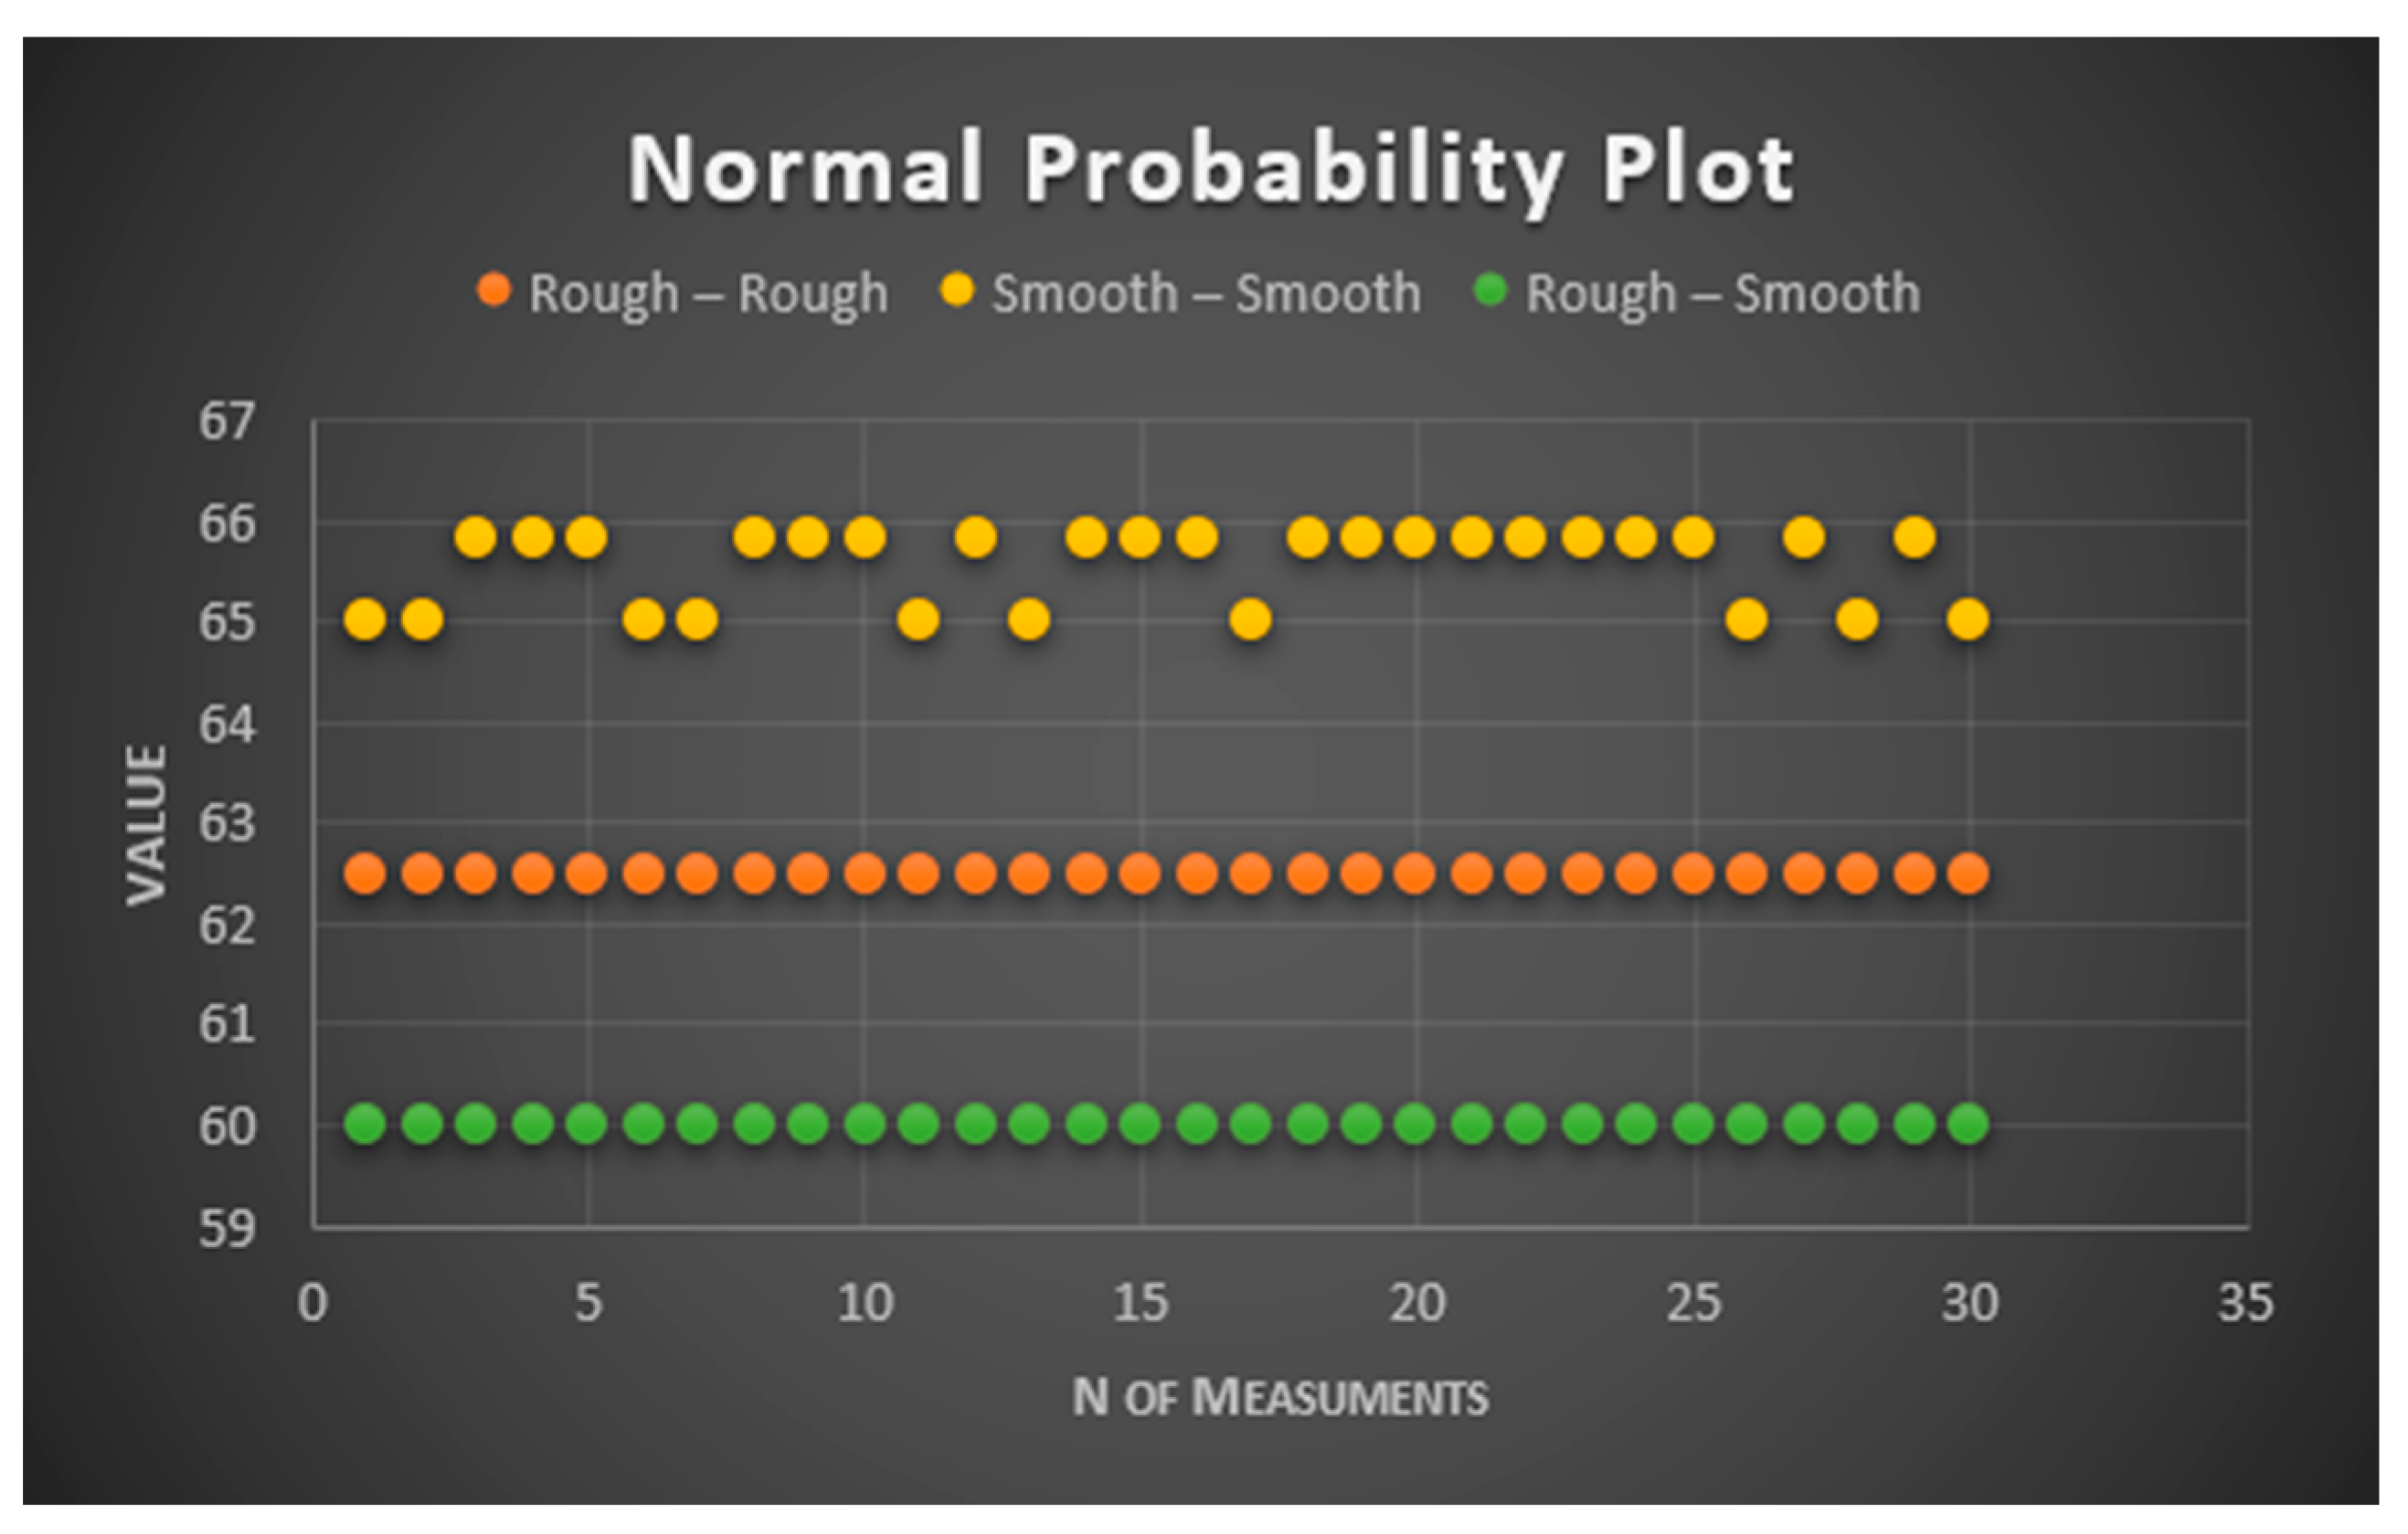
Table 4, the data is presented for a sample with a thickness of 2 mm and a nominal illuminance of 200 lx. As illustrated in
Figure 4, the graphical distribution of the data from
Table 4 is presented. The graphical representation of the data substantiates the hypothesis that the measurement data adheres to the normal distribution law.
In consideration of the substantial volume of data presented in
Table 5,
Table 6,
Table 7,
Table 8,
Table 9 and
Table 10, the following report presents the mean values of the results obtained for illuminance levels of 200, 2600, 6600, and 10,600 lx, as measured for various thicknesses of the test samples. Four nominal illuminances, selected at relatively equal intervals, are employed to cover the entire sample.
The findings of the measurements for a thickness of 1 mm demonstrate that for “Rough–Rough” surfaces, the attenuation percentage is the lowest for all illuminances. For surfaces designated as “Smooth–Smooth”, the mean attenuation values are obtained, which differ by approximately 3% from those for surfaces designated as “Rough–Rough”. For the “Rough–Smooth” configuration, the maximum attenuation is observed, with a discrepancy of approximately 10% in comparison to the “Rough–Rough” configuration. The attenuation for each illuminance, according to the type of treatment, varies by approximately ±1.5%.
The findings of the measurements for a thickness of 1.5 mm (see
Table 6) demonstrate that for “Rough–Smooth” surfaces, the attenuation percentage is the least significant for all illuminances. For surfaces designated as “Smooth–Smooth”, the mean attenuation values exhibit a discrepancy of approximately 2% in comparison to those observed for surfaces classified as “Rough–Smooth”. For the “Rough–Rough” configuration, the maximum attenuation is observed, with a discrepancy of approximately 7% in comparison to the “Rough–Smooth” configuration. The attenuation for each illuminance, according to the type of treatment, varies by approximately ±1%.
The findings of the measurements for a thickness of 2 mm (see
Table 7) demonstrate that for “Smooth–Smooth” surfaces, the attenuation percentage is the least significant for all illuminances. For surfaces designated as “Rough–Rough”, the mean attenuation values exhibit an approximate 2% discrepancy compared to those observed for surfaces categorized as “Smooth–Smooth”. For surfaces characterized by a “Rough–Smooth” transition, the maximum attenuation is recorded, with a discrepancy of approximately 3% in comparison to surfaces exhibiting a “Smooth–Smooth” transition. The attenuation exhibited by each illuminance level, contingent upon the designated treatment, has been observed to vary by approximately ±1%.
The findings of the measurements for a thickness of 2.5 mm (see
Table 8) demonstrate that for “Smooth–Smooth” surfaces, the attenuation percentage is the least significant for all illuminances. For surfaces designated as “Rough–Rough”, the mean attenuation values exhibit an approximate 2% discrepancy compared to those classified as “Smooth–Smooth”. For the “Rough–Smooth” configuration, the maximum attenuation is observed, with a discrepancy of approximately 3% in comparison to the “Smooth–Smooth” configuration. The attenuation for each illuminance, according to the type of treatment, varies by approximately ±1%.
The findings of the measurements for a thickness of 3 mm (see
Table 9) demonstrate that for “Smooth–Smooth” surfaces, the attenuation percentage is the least significant for all illuminances. For surfaces designated as “Rough–Rough”, the mean attenuation values exhibit an approximate 2% discrepancy compared to those observed for surfaces categorized as “Smooth–Smooth”. For surfaces characterized by a “Rough–Smooth” transition, the maximum attenuation is recorded, with a discrepancy of approximately 5–7% in comparison to surfaces exhibiting a “Smooth–Smooth” transition. The attenuation for each illuminance, according to the type of treatment, varies by approximately ±1%.
The results of the measurements for a thickness of 3.5 mm (see
Table 10) demonstrate that for surfaces designated as “Smooth–Smooth”, the attenuation percentage is the lowest for all illuminances. For surfaces designated as “Rough–Rough”, the mean attenuation values exhibit an approximate 2% discrepancy compared to those classified as “Smooth–Smooth”. For the “Rough–Smooth” configuration, the maximum attenuation is observed, with approximately 5–7% compared to the “Smooth–Smooth” configuration. The attenuation for each illuminance, according to the type of treatment, varies by approximately ±1%.
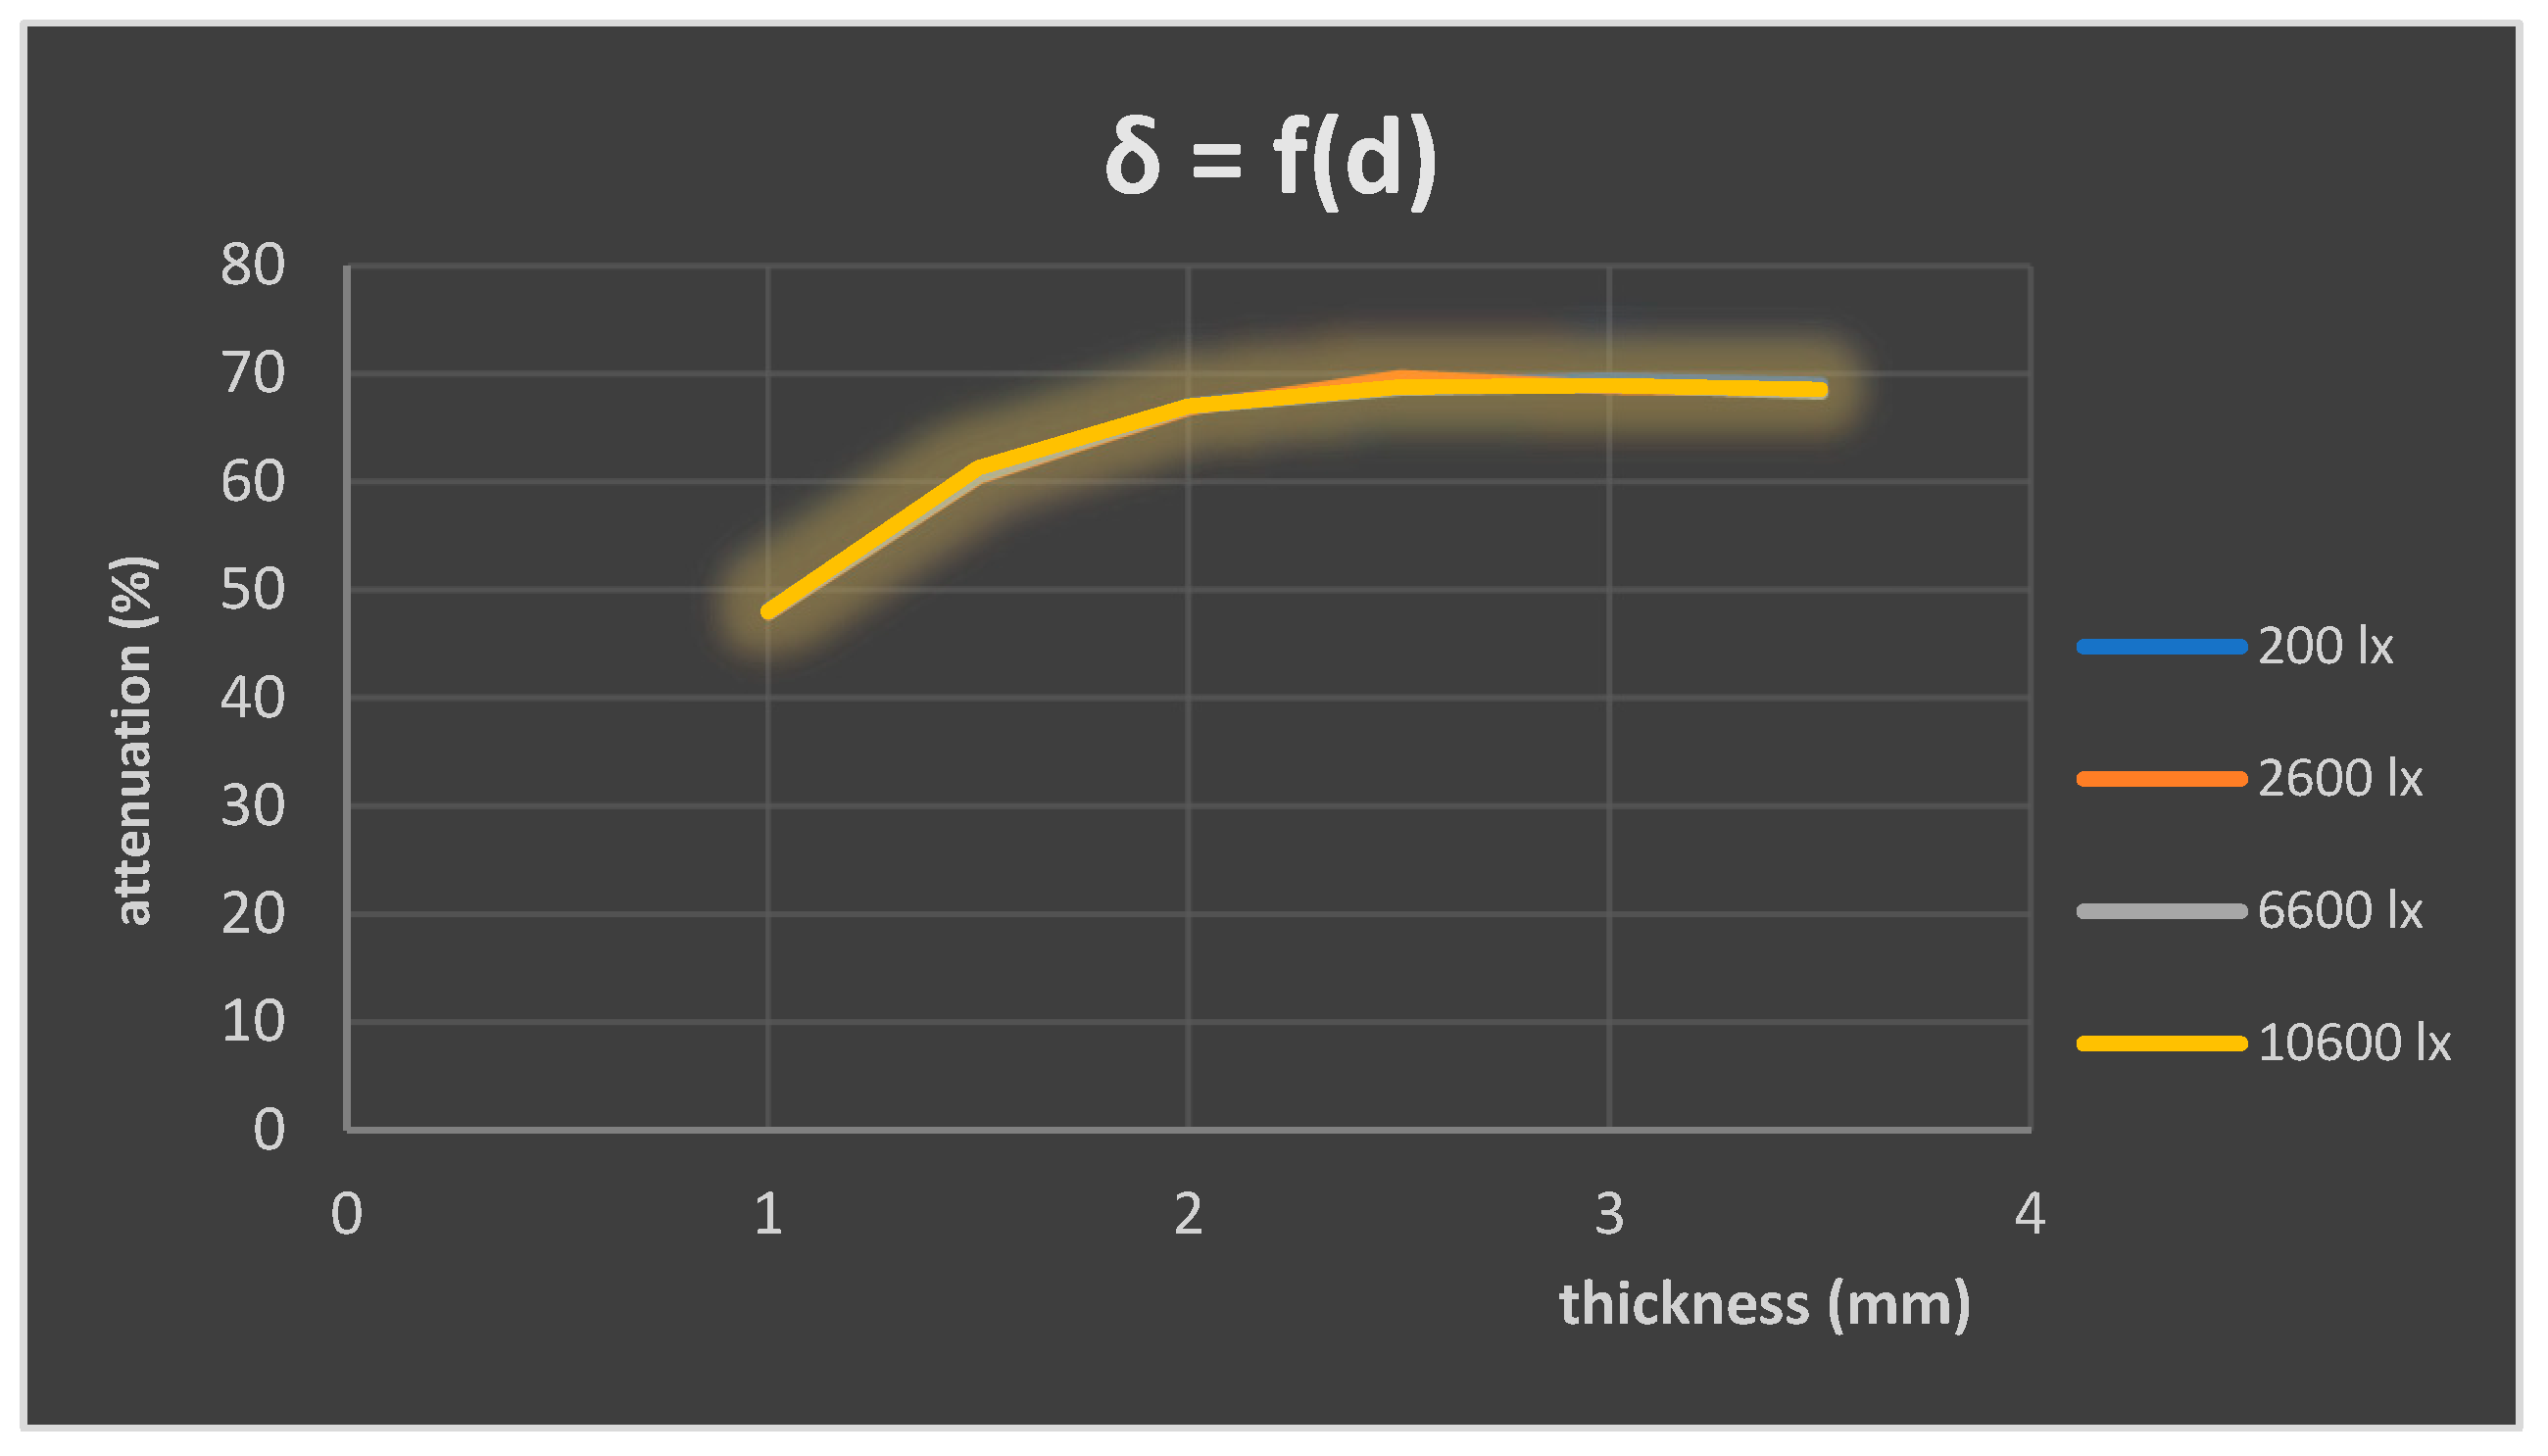
As demonstrated in
Figure 5, the graphical dependencies of attenuation on sample thickness are illustrated at the selected illuminances for the “Smooth–Smooth” condition.
As demonstrated in
Figure 5, the graph confirms that attenuation is influenced by the thickness of the sample rather than by the intensity of illumination. The graphical dependencies presented for different levels of illumination exhibit a high degree of similarity, resulting in an overlap of the graph.
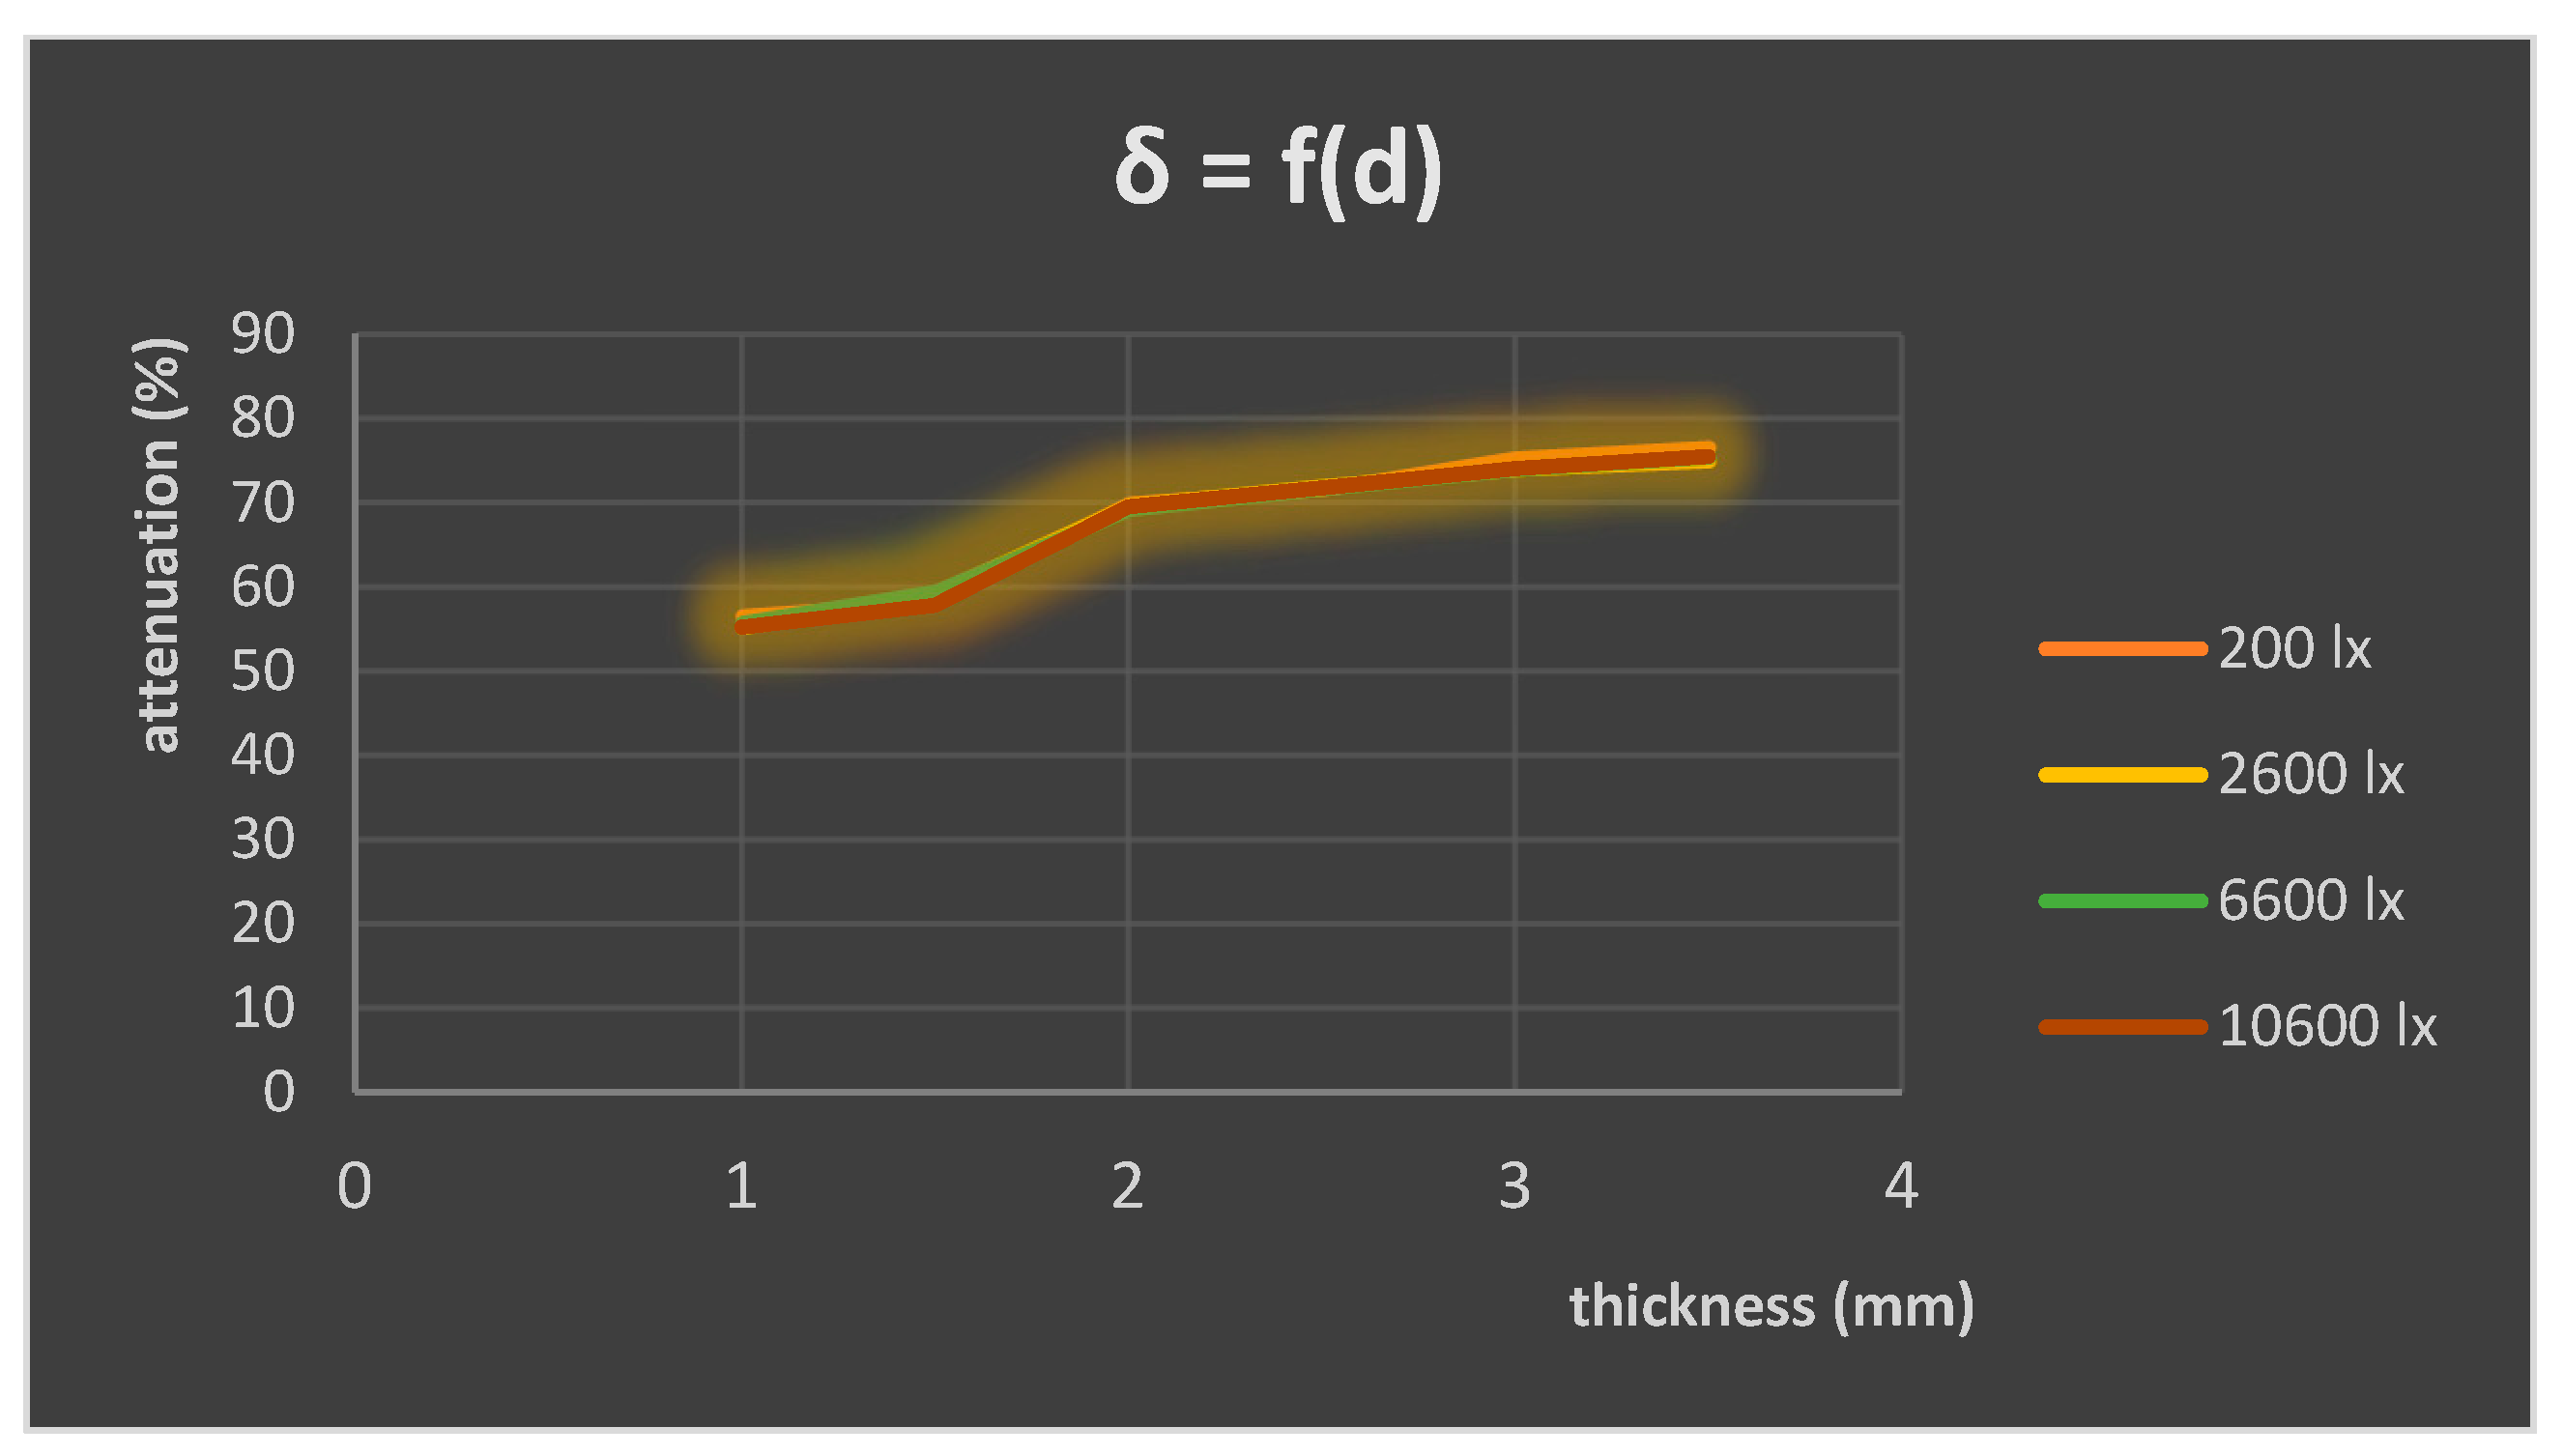
As illustrated in
Figure 6, the graphical dependencies of attenuation on sample thickness are demonstrated at specific illuminations for the “Rough–Smooth” condition.
As demonstrated in
Figure 6, the graph confirms that attenuation is influenced by the thickness of the sample rather than by the intensity of illumination. The graphical dependencies presented for different levels of illumination exhibit a high degree of similarity, resulting in an overlap of the graph.
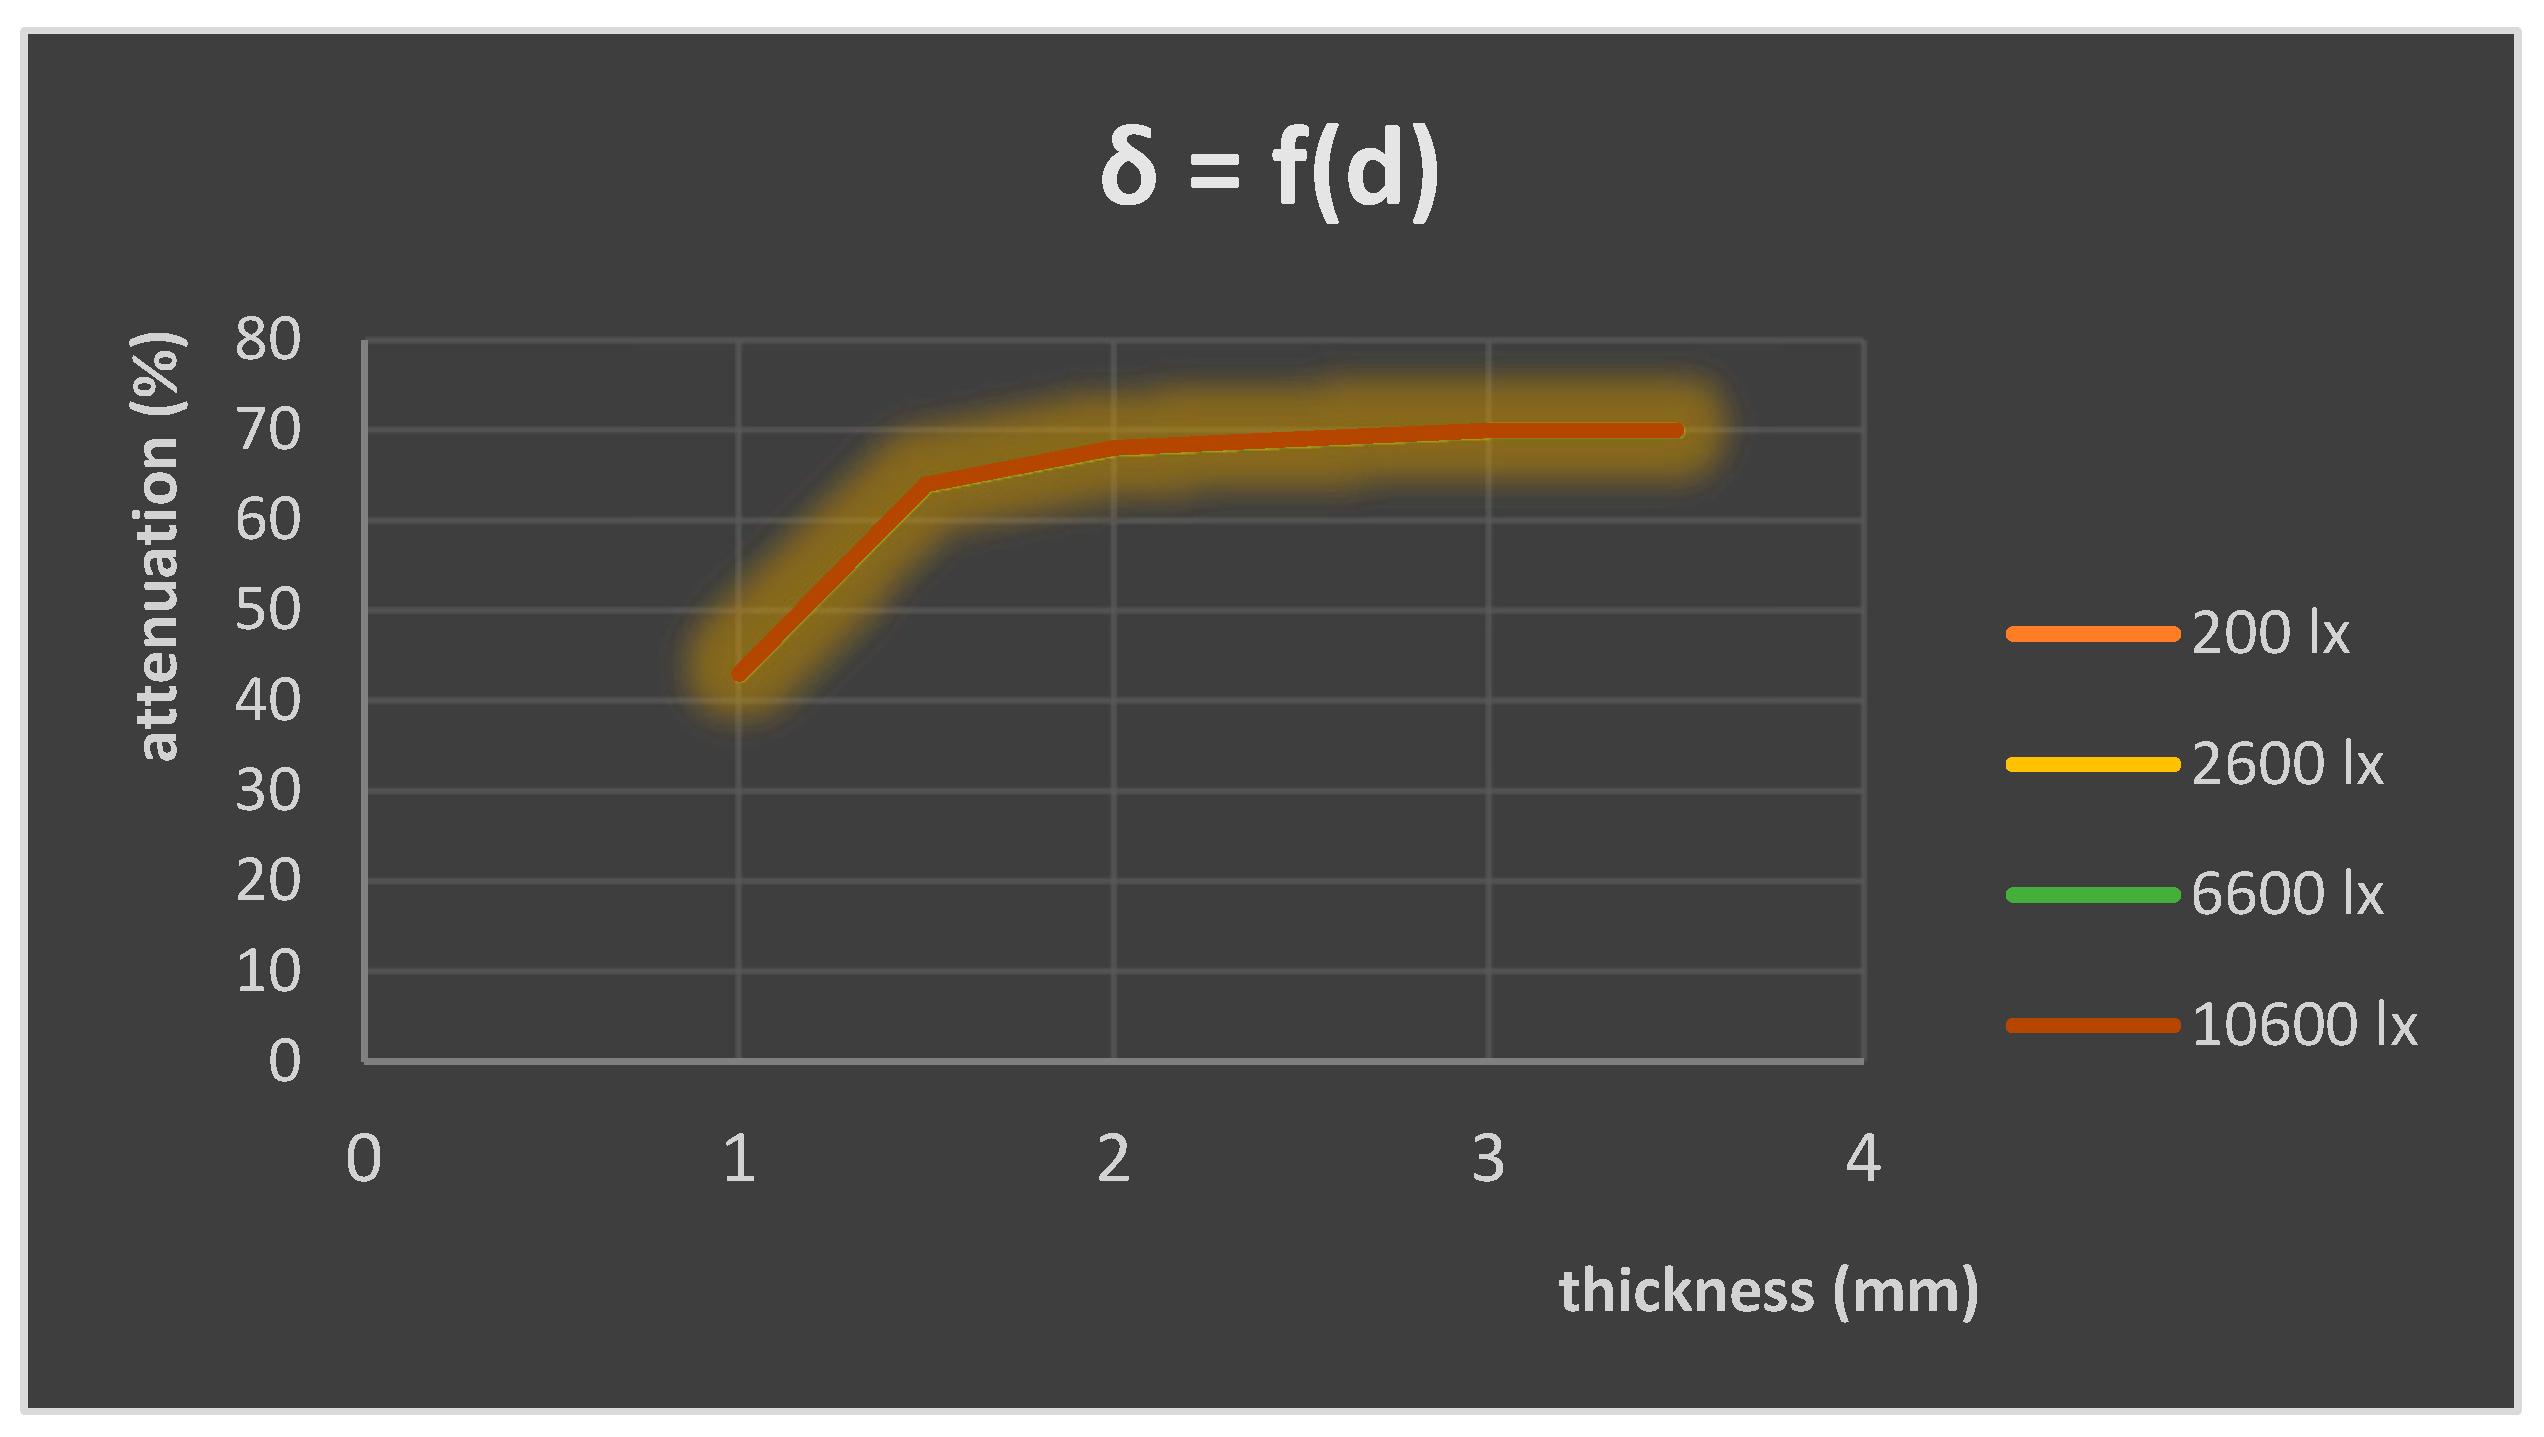
As illustrated in
Figure 7, the graphical dependencies of attenuation on sample thickness are demonstrated at specific illuminations for the “Rough–Rough” condition.
As demonstrated in
Figure 7, the graph confirms that attenuation is influenced by the thickness of the sample rather than by the intensity of illumination. The graphical dependencies presented for different levels of illumination exhibit a high degree of similarity, resulting in an overlap of the graph.
The findings of the measurements of all samples at varying combinations of finished surfaces and thicknesses demonstrate that attenuation at different nominal illuminance values is analogous, irrespective of the thickness and type of surface. The attenuation of light is predominantly influenced by the thickness of the specimen under examination, with less significance attributed to factors such as surface type or the intensity of the light source.
The present study investigates the light transmittance of translucent materials used in additive manufacturing. The measurements were obtained through the utilization of a meticulously engineered laboratory setup, meticulously designed for this specific purpose. The experiment involved the use of a transparent material, namely PETG, with a filament diameter of 1.75 mm. The test specimens were manufactured with thicknesses ranging from 1 to 3.5 mm and a pitch of 0.5 mm. The surface finishes of the components were characterized by a combination of rough and rough–smooth, as well as smooth–smooth textures. It is important to note that all other printing parameters were kept constant during the production of the test samples. The experiments were conducted under illuminance levels of 200, 2600, 6600, and 10,600 lx. The results indicate the absence of a uniform attenuation trend with respect to the type of surface and the thickness of the detail. For different thicknesses, the lowest illuminance is observed for different types of surfaces. The findings of the measurements of all samples at varying combinations of finished surfaces and thicknesses demonstrate that attenuation at different nominal illuminance values is analogous, irrespective of the thickness and type of surface. The attenuation of light is predominantly influenced by the thickness of the specimen under examination, with lesser regard being given to factors such as surface type or the intensity of the light source. The graphical outcomes presented herein substantiate the hypothesis that attenuation is predominantly influenced by the thickness of the specimen and not by the illuminance or the surface. The semi-transparent materials employed in additive manufacturing demonstrate favorable permeability properties and maintain their characteristics at varying thicknesses, surface types, and light intensities. The findings of the experiments will be of use in the enhancement of knowledge and capabilities concerning materials for additive manufacturing and their application in various fields.