Proceeding Paper

Intelligent Prediction of Blast Furnace Permeability by Integrating Extreme Gradient Boosting and Light Gradient Boosting Machine †
Department of Intelligent Equipment, Changzhou College of Information Technology, Changzhou 213164, China
*
Author to whom correspondence should be addressed.
Presented at the 9th Eurasian Conference on Educational Innovation 2026 (ECEI 2026), Da Nang City, Vietnam, 30 January–2 February 2026.
Eng. Proc. 2026, 141(1), 15; https://doi.org/10.3390/engproc2026141015
Published: 11 June 2026

Abstract

We developed an ensemble model based on the fusion of Extreme Gradient Boosting and Light Gradient Boosting Machine. 20 key parameters, including hourly charging rate, blast volume, and blast pressure, are selected as input features to construct and train the ensemble model for predicting the blast furnace permeability index. The results show that the model achieves a root mean squared error of 0.0868, a mean absolute error of 0.0708, and a coefficient of determination of 0.9602, confirming its excellent predictive accuracy.

1. Introduction

Blast furnace operational stability is essential in determining efficiency, energy consumption, and safety in steel production. The permeability index, reflecting internal gas flow distribution, is also vital for optimal operation [1]. Its accurate prediction remains challenging due to complex process dynamics featuring strong nonlinearity, hysteresis, and multi-variable coupling within harsh environments. While traditional models struggle with these complexities, data-driven approaches have emerged as effective solutions [2,3,4], spanning conventional machine learning, deep learning, and hybrid strategies [5].
Recent advances in blast furnace permeability prediction include several data-driven approaches. Su et al. [6] developed a Wavelet Transform-Principal Component Analysis-Multi-layer Extreme Learning Machine model with wavelet denoising and principal component analysis for improved generalization. Yu et al. [7] combined the Least Squares Support Vector Machine with mean shift clustering (mean absolute error (MAE) = 0.6877, coefficient of determination (R2) = 0.9215). Jiang et al. [8] identified Support Vector Regression and Gaussian Process Regression as top performers via multi-method comparison and Shapley Additive Explanation analysis. Zhao et al. [9] employed multi-criteria feature selection for Extreme Gradient Boosting (XGBoost) prediction (a 94.27% accuracy within ±1.5% error). Liu et al. [10] proposed Variational Mode Decomposition-Particle Swarm Optimization-Back Propagation with signal decomposition for 3% accuracy gain. Luo et al. [11] designed a Variational Mode Decomposition-Error Compensation-Temporal Convolutional Network-Gated Recurrent Unit model handling non-stationarity and time-lag effects with high industrial reliability.
Although hybrid modeling predominates and XGBoost/Light Gradient Boosting Machine (LightGBM) demonstrate superior feature processing capabilities [12,13], their synergistic potential in blast furnace applications remains underdeveloped. We established an integrated framework incorporating: (1) Spearman correlation-based feature selection; (2) complementary XGBoost + LightGBM architecture leveraging their respective strengths in nonlinear modeling and high-dimensional processing; and (3) weighted prediction fusion to enhance time-series forecasting generalization.
Using industrial blast furnace data with comprehensive process parameters, we implement preprocessing and stacking integration. The resulting ensemble effectively captures permeability dynamics across operational conditions, demonstrating substantial potential for intelligent control system implementation.

2. Methodology

2.1. Data and Preprocessing

January–June 2024 operational data were obtained from a blast furnace, collected hourly (23 parameters, 4368 observations each, totaling 100,464 data points). The preprocessing pipeline comprises (1) comprehensive data cleaning addressing missing values (forward-backward/sliding-window imputation), noise (median filtering), and outliers (Isolation Forest detection with window-mean correction); (2) dataset partitioning (70%/20%/10% for training/validation/testing), with test set excluded from normalization to ensure unbiased evaluation; (3) Z-score standardization was applied to numerical features using Equation (1).
x = x μ δ ,
where x′ is the normalized value, x is the observed value, μ is the population mean, and δ is the population standard deviation.

2.2. Feature Selection

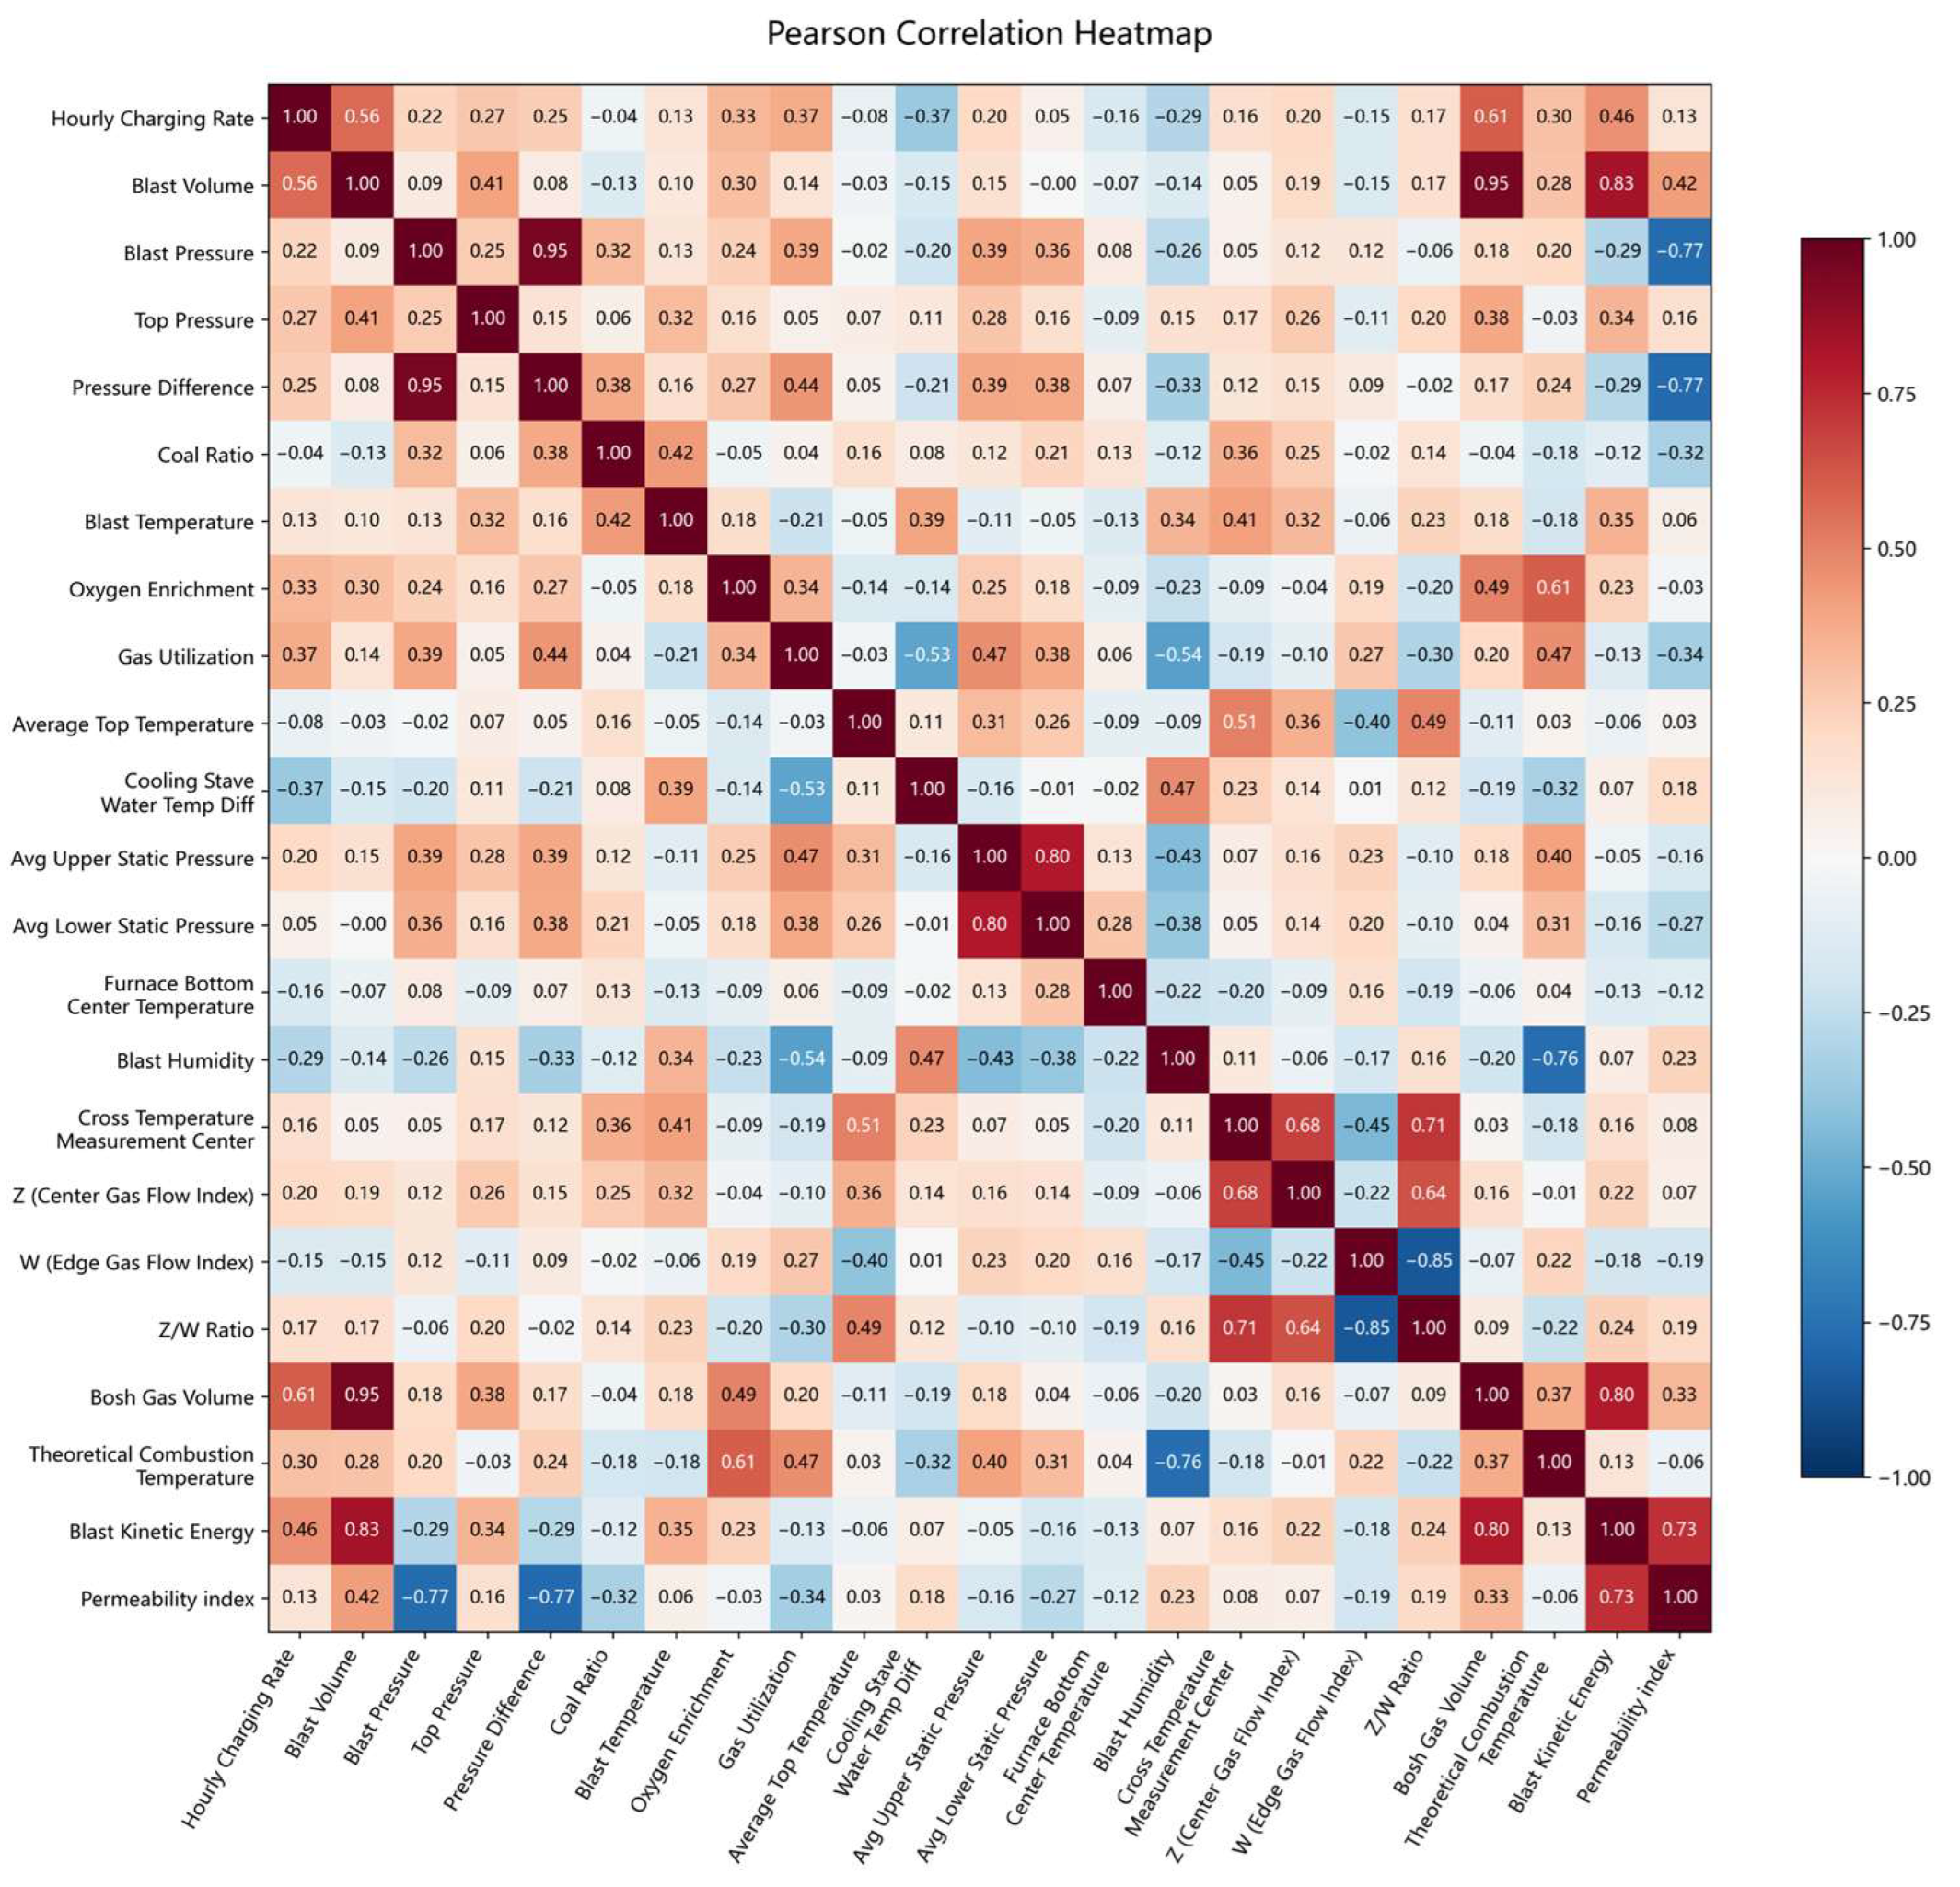
To address the parameter coupling and nonlinearity in blast furnace processes, this study employed Spearman correlation analysis [11] for feature selection. Variables with correlation coefficients exceeding the 0.9 threshold [14] (e.g., blast volume vs. bosh gas volume; blast pressure vs. pressure difference) were eliminated to reduce redundancy. The final feature set comprised 20 key parameters (excluding the target variable), with the refined dataset containing 87,360 instances as validated by the correlation heatmap in Figure 1.

2.3. XGBoost + LightGBM Model

2.3.1. XGBoost Model

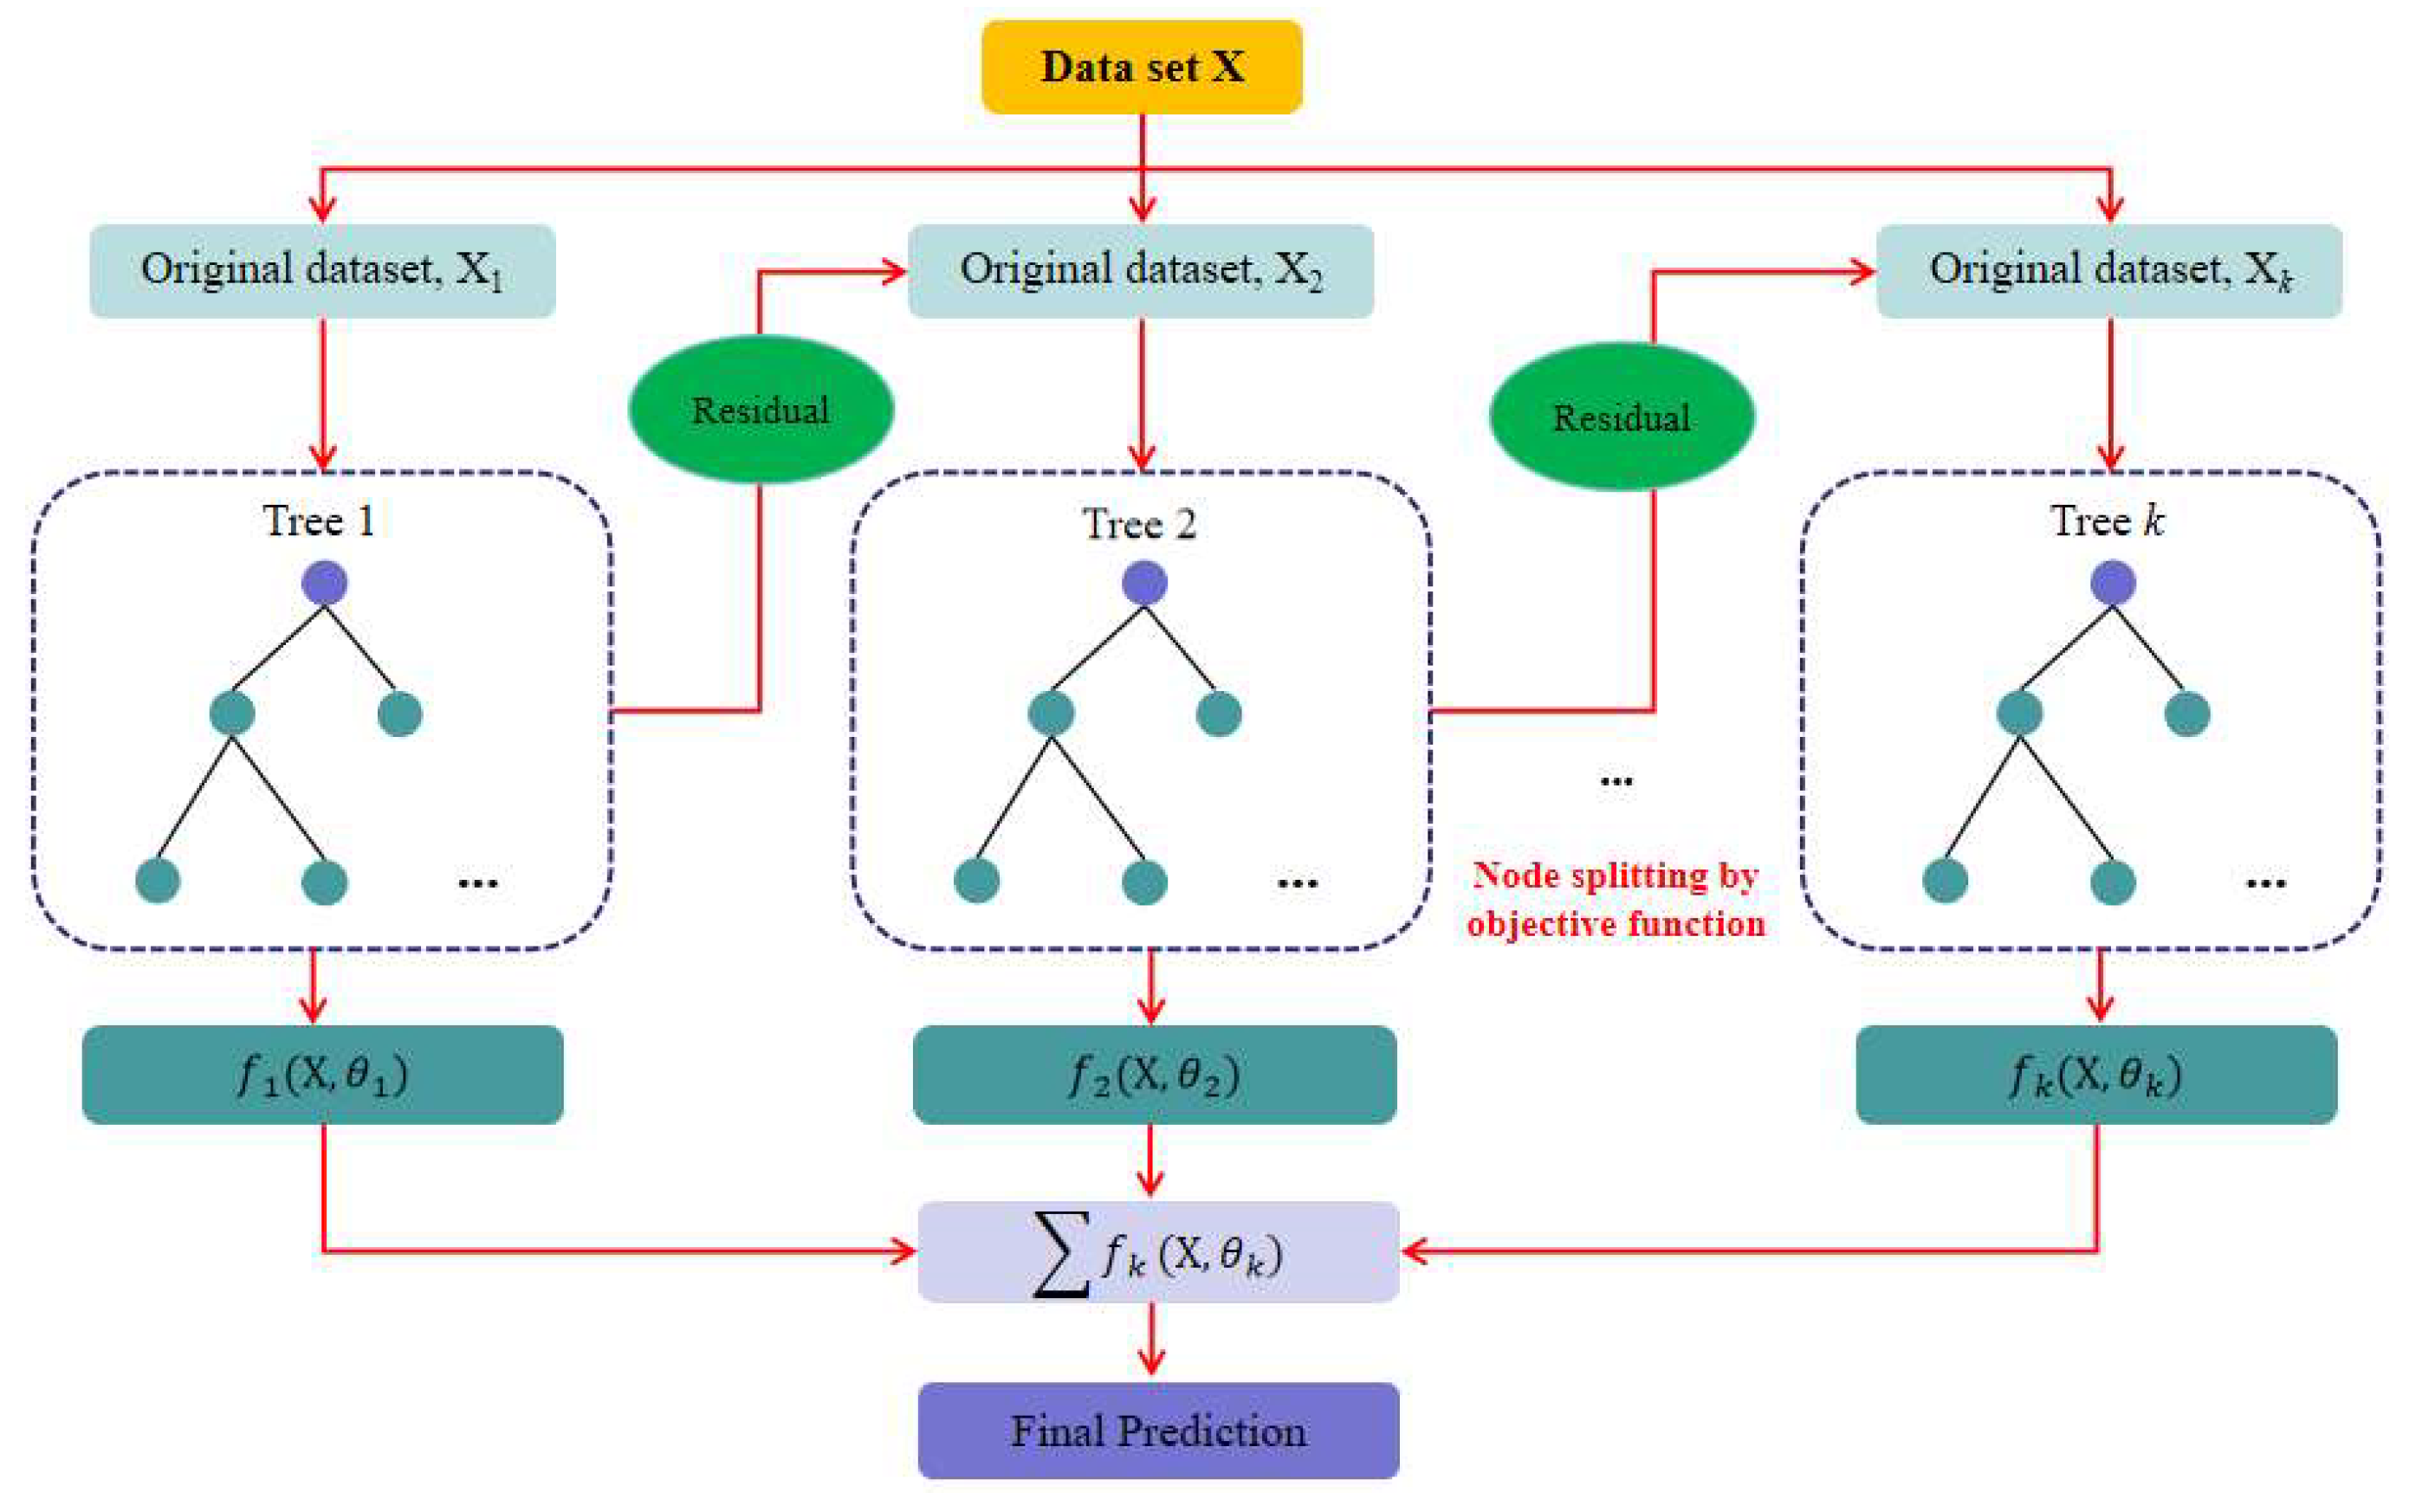
XGBoost is a machine learning algorithm based on Gradient Boosting Decision Trees (GBDT), which sequentially integrates multiple weak learners (typically decision trees) to gradually optimize the objective function. The algorithm is based on an additive model, constructing a new tree in each iteration to fit the residual between the current model prediction and the true value, as shown in Figure 2. The input for each subsequent tree is the difference between the sum of all previous trees’ predictions and the true value, and the final output of the model is the weighted sum of all tree predictions.
In the model construction process [12], for a given dataset D = ( x i , y i ) ( i = 1,2 , . . . , n ) , containing n samples, after t rounds of iteration, the model’s prediction output is expressed as
y ^ i ( t ) = k = 1 t f k ( x i ) ,
where y ^ i ( t ) represents the predicted value of the i-th sample after the t-th iteration, f k represents the k-th decision tree, and x i represents the feature vector of the i-th sample. XGBoost’s regularized objective function includes a loss term and a regularization term.
O b j ( t ) = i = 1 n L ( y i , y ^ i ( t ) ) + k = 1 t Ω ( f k ) ,
where L ( y i , y ^ i ( t ) ) is the loss function, measuring the difference between the predicted value and the true value; Ω ( f k ) is the regularization term for the k-th tree. The specific form of the regularization term is
Ω ( f k ) = α · T + 1 2 β · j = 1 T w j 2 ,
where T represents the number of leaf nodes in the tree, wj represents the weight value of the j-th leaf node, α is the penalty coefficient controlling the number of leaf nodes, and β is the L2 regularization coefficient controlling the weight values. During the optimization process, a second-order Taylor expansion is employed by XGBoost to approximate the objective function. At the t-th iteration, the objective function is approximated as
O b j ( t ) i = 1 n g i f t ( x i ) + 1 2 h i f t 2 ( x i ) + Ω ( f t ) ,
where g i = L ( y i ,   y ^ i ( t 1 ) ) y ^ i ( t 1 ) is the first-order gradient of the loss function, h i = 2 L ( y i ,   y ^ i ( t 1 ) ) 2 y ^ i ( t 1 ) is the second-order gradient of the loss function. In terms of tree structure optimization, define I j = i s a m p l e   i   i s   a s s i g n e d   t o   l e a f   n o d e   j as the sample set of leaf node j. The optimal leaf node weight is calculated as
w j * = i I j g i i I j h i + β .
The corresponding optimal objective value is
O b j * = 1 2 j = 1 T ( i I j g i ) 2 i I j h i + β + α · T ,
where Obj* is the value sought by the model, and a smaller value (i.e., objective function) is better.

2.3.2. LightGBM Model

LightGBM is an efficient implementation of GBDT. It optimizes the training process through three key technologies: Gradient-based One-Side Sampling (GOSS), Exclusive Feature Bundling (EFB), and the Histogram algorithm [13]. GOSS is based on the observation that samples with larger gradients contribute more to the information gain. It retains the top a × 100% of high-gradient samples and random samples b × 100% of low-gradient samples, calculating the information gain V ^ j ( d ) with weight compensation.
V ^ j ( d ) = 1 n ( x i A l g i + 1 a b x i B l g i ) 2 n l j ( d ) + ( x i A r g i + 1 a b x i B r g i ) 2 n r j ( d )
where g i is the gradient of the sample, Al, Ar, Bl, and Br are the left and right subsets of sets A and B after splitting at threshold d for feature j, respectively, and n l j ( d ) and n r j ( d ) are the corresponding sample counts.
EFB is applied to high-dimensional sparse data as it bundles exclusive features (i.e., features that are rarely non-zero simultaneously). Suppose the feature set is partitioned into K bundles B1, B2, …, BK, each bundle satisfies
f B k I ( x i , f 0 ) 1 ,   i = 1,2 , . . . , n ,
where k is the bundle index, Bk is the set of the k-th feature bundle, and f is the feature index, Ι ( ) is the indicator function, which takes the value 1 when the condition inside the parentheses is satisfied, otherwise 0.
The Histogram Algorithm is used to discretize continuous features into k bins to build a feature histogram.
H i s t o g r a m ( j ) = ( b 1 , S 1 ) , ( b 2 , S 2 ) , . . . , ( b k ,   S k ) ,
where bi is the bin boundary, Si = {(Gi, Hi)} contains the gradient statistics of samples falling into that bin, Gi = ∑g is the sum of gradients, and Hi = ∑h is the sum of second-order gradients.

2.3.3. XGBoost + LightGBM Ensemble Model

To combine the advantages of both algorithms, this study adopts a weighted average ensemble strategy. The final prediction y ^ ensemble of the ensemble model is the arithmetic mean of the XGBoost predictions y ^ xgb and the LightGBM prediction y ^ lgb
y ^ ensemble = α · y ^ xgb + ( 1 α ) · y ^ lgb
In this study, an equal weight configuration α = 0.5 is used to ensure model robustness and simplicity. Theoretically, the effectiveness of this ensemble model stems from variance reduction theory. Assume the prediction errors of the base models are
y ^ xgb = y + δ x g b , y ^ lgb = y + δ l g b ,
where the expectation of the error terms is zero, and E δ x g b = E δ l g b = 0 . The variance of the ensemble prediction error is
V a r ( δ e n s e m b l e ) = w x g b 2 σ x g b 2 + w l g b 2 σ l g b 2 + 2 w x g b w l g b ρ σ x g b σ l g b ,
where σ x g b 2 and σ l g b 2 represent the variances of the prediction errors of XGBoost and LightGBM, respectively, and ρ represents the correlation coefficient between the prediction errors of the two models. When ρ ≤ 0, the prediction error variance of the ensemble model is less than the average variance of the individual models, thus achieving a variance reduction effect.
Due to the fundamental differences in the algorithm implementations of XGBoost and LightGBM, that is, the former uses pre-sorting and level-wise growth, while the latter is based on the histogram algorithm and leaf-wise growth, resulting in different feature processing and sampling strategies. This means that when one model makes a prediction error on certain samples, the other model is likely to provide a correct prediction, thereby enhancing the model’s generalization ability and prediction stability through an ensemble.

2.4. Model Performance Evaluation Metrics

Multiple is a commonly used evaluation metric to assess model performance. Root mean square error (RMSE) reflects the overall level of prediction error; MAE is used to measure the absolute size of prediction errors and is robust to outliers; R2 is used to evaluate the goodness of fit, with values closer to 1 indicating stronger explanatory power. The formulas for each metric are as follows:
R M S E = 1 N i = 1 N ( y i y ^ i ) 2
M A E = 1 N i = 1 N y i y ^ i
R 2 = 1 - i = 1 N ( y i y ^ i ) 2 i = 1 N ( y i y - ) 2
where y i is the actual value of the i-th sample, y ^ i is the corresponding predicted value, y - is the average of the values, and N is the total number of samples.

3. Results and Discussion

The performance metrics of the ensemble model are shown in Table 1. The model’s RMSE is 0.0868, and MAE is 0.0708, indicating a small average deviation between predicted and actual observed values, and thus high prediction accuracy. The close values of these two error metrics suggest a relatively uniform error distribution without significant abnormal deviations. Furthermore, R2 is 0.9602, indicating that the model explains 96.02% of the variance in the dependent variable, demonstrating significant fitting properties.
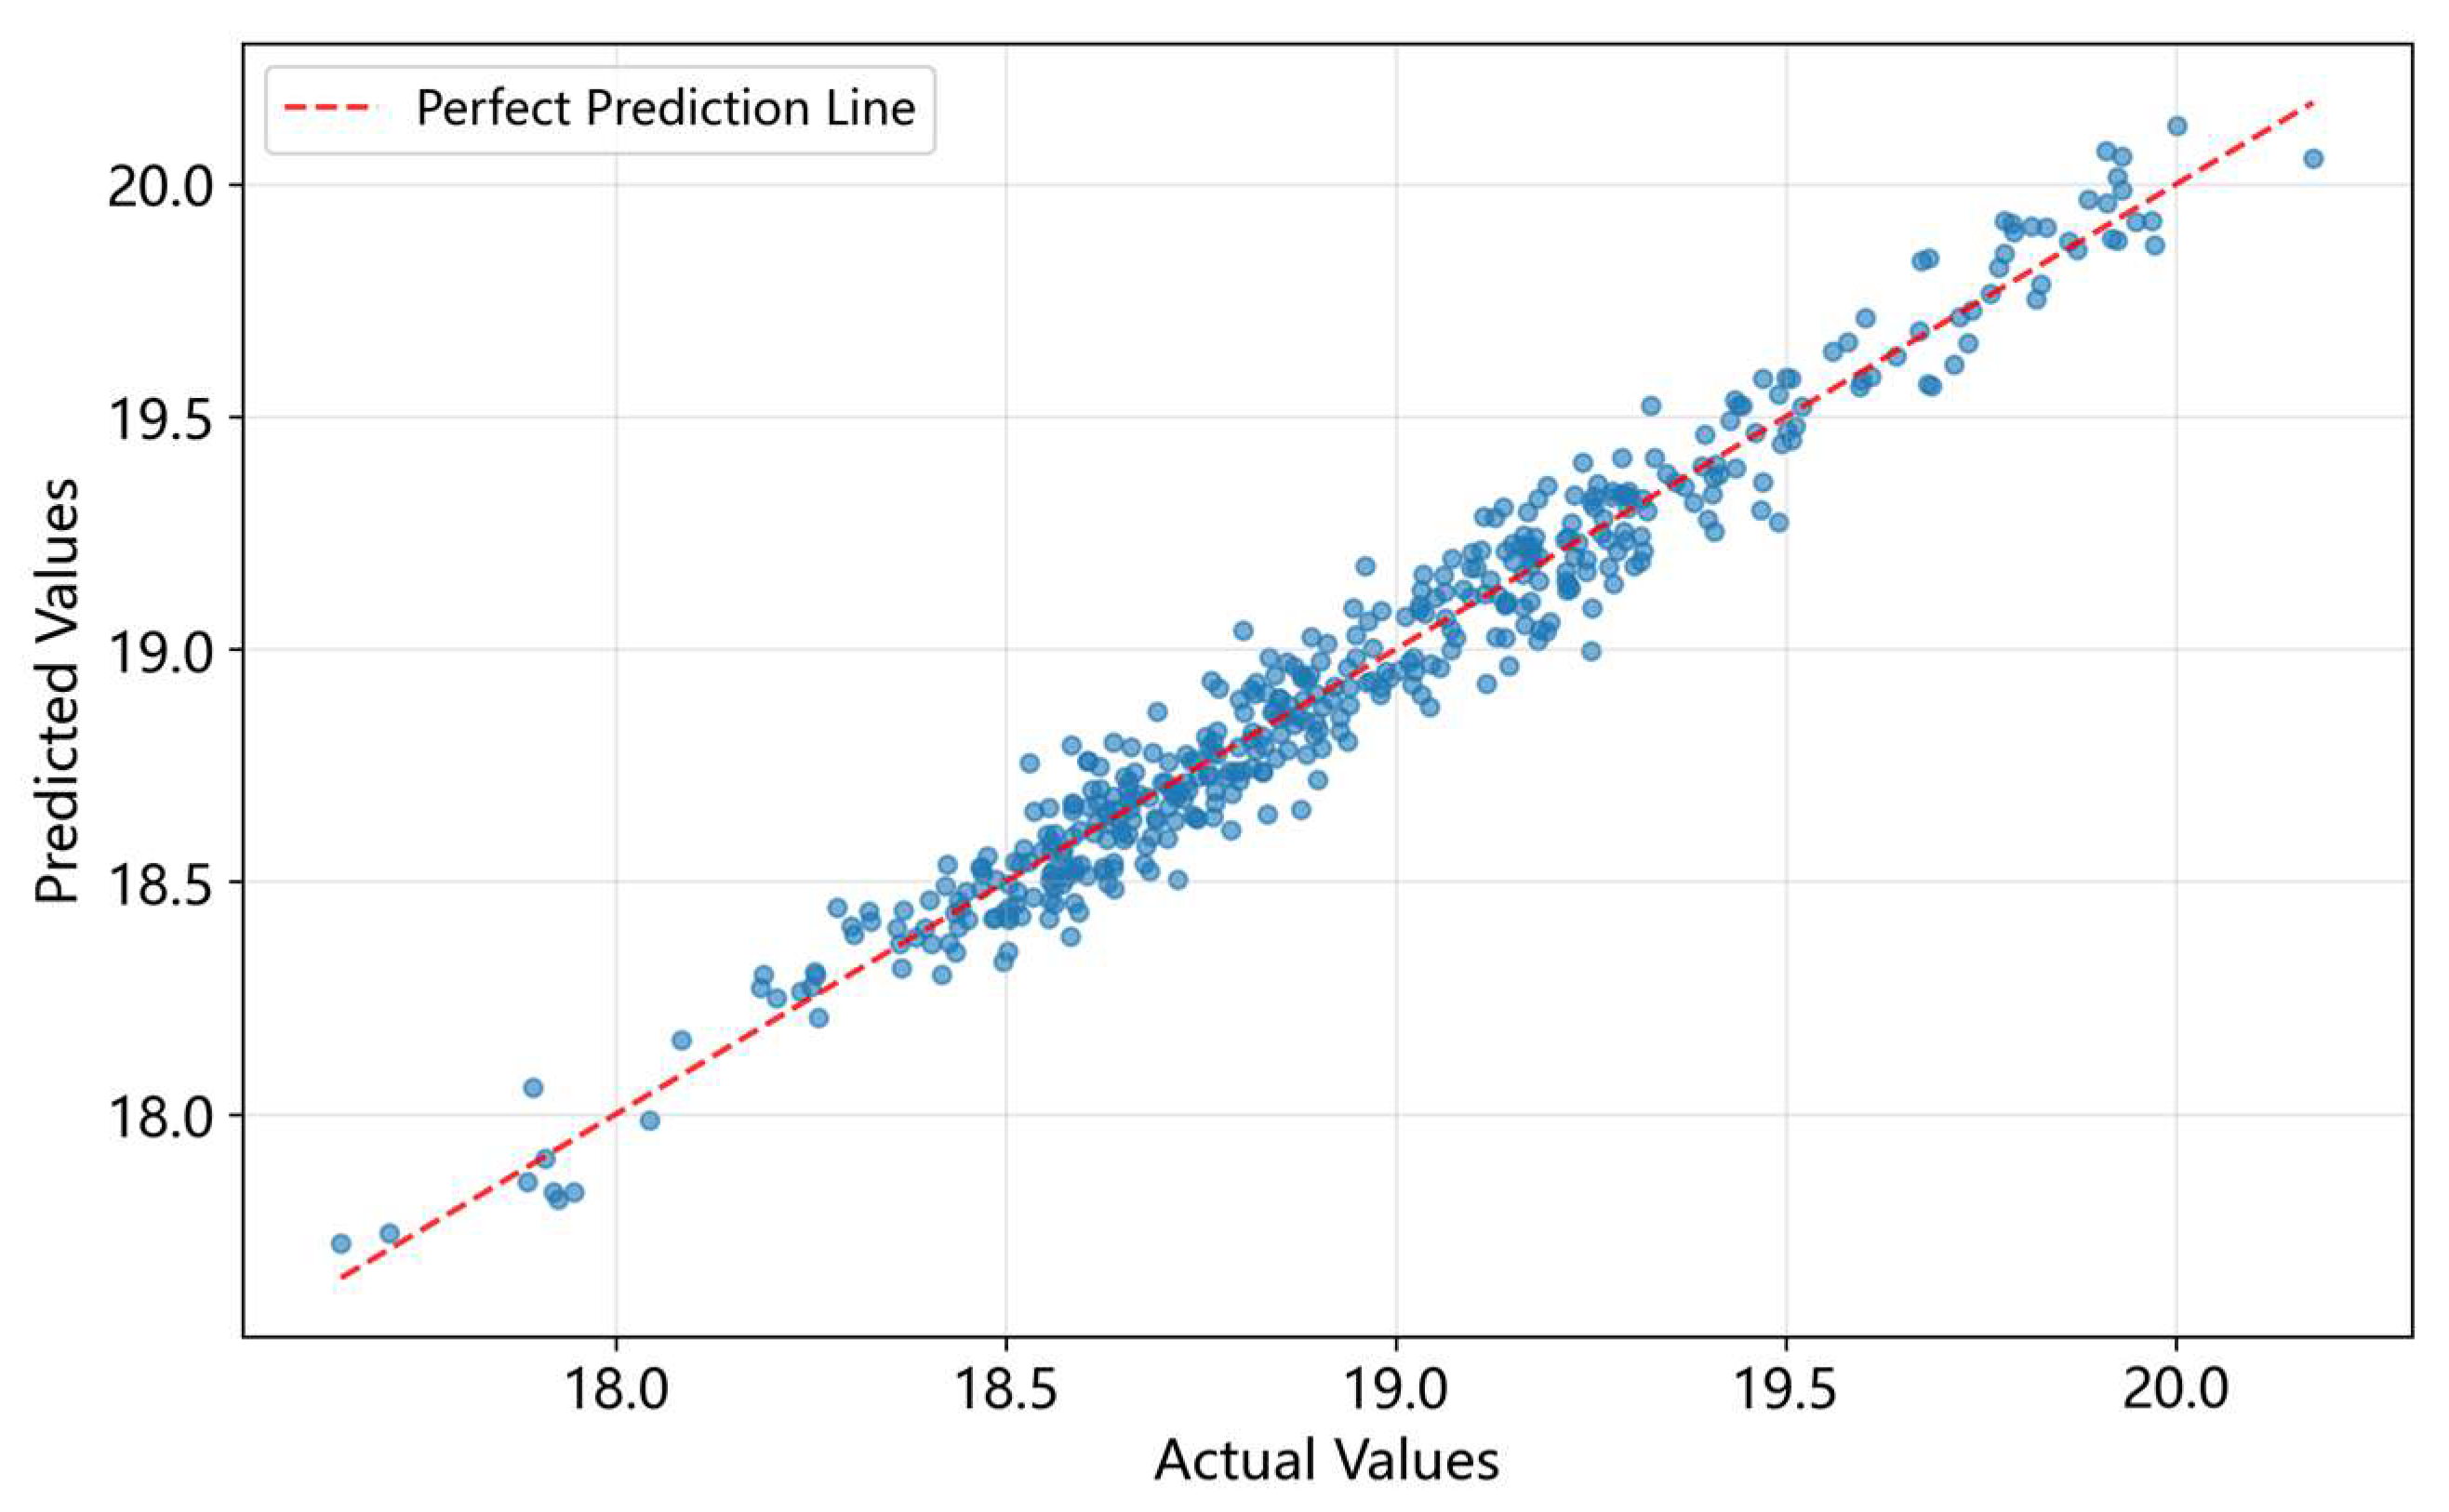
Figure 3 shows the scatter distribution between the predicted and actual values of the integrated model, with the diagonal representing ideal predictions. Most points cluster tightly along this line, demonstrating high predictive accuracy. Despite minor outliers, the strong linear trend reflects excellent prediction consistency, confirming the model’s capability to capture underlying data patterns and its robust generalization performance.
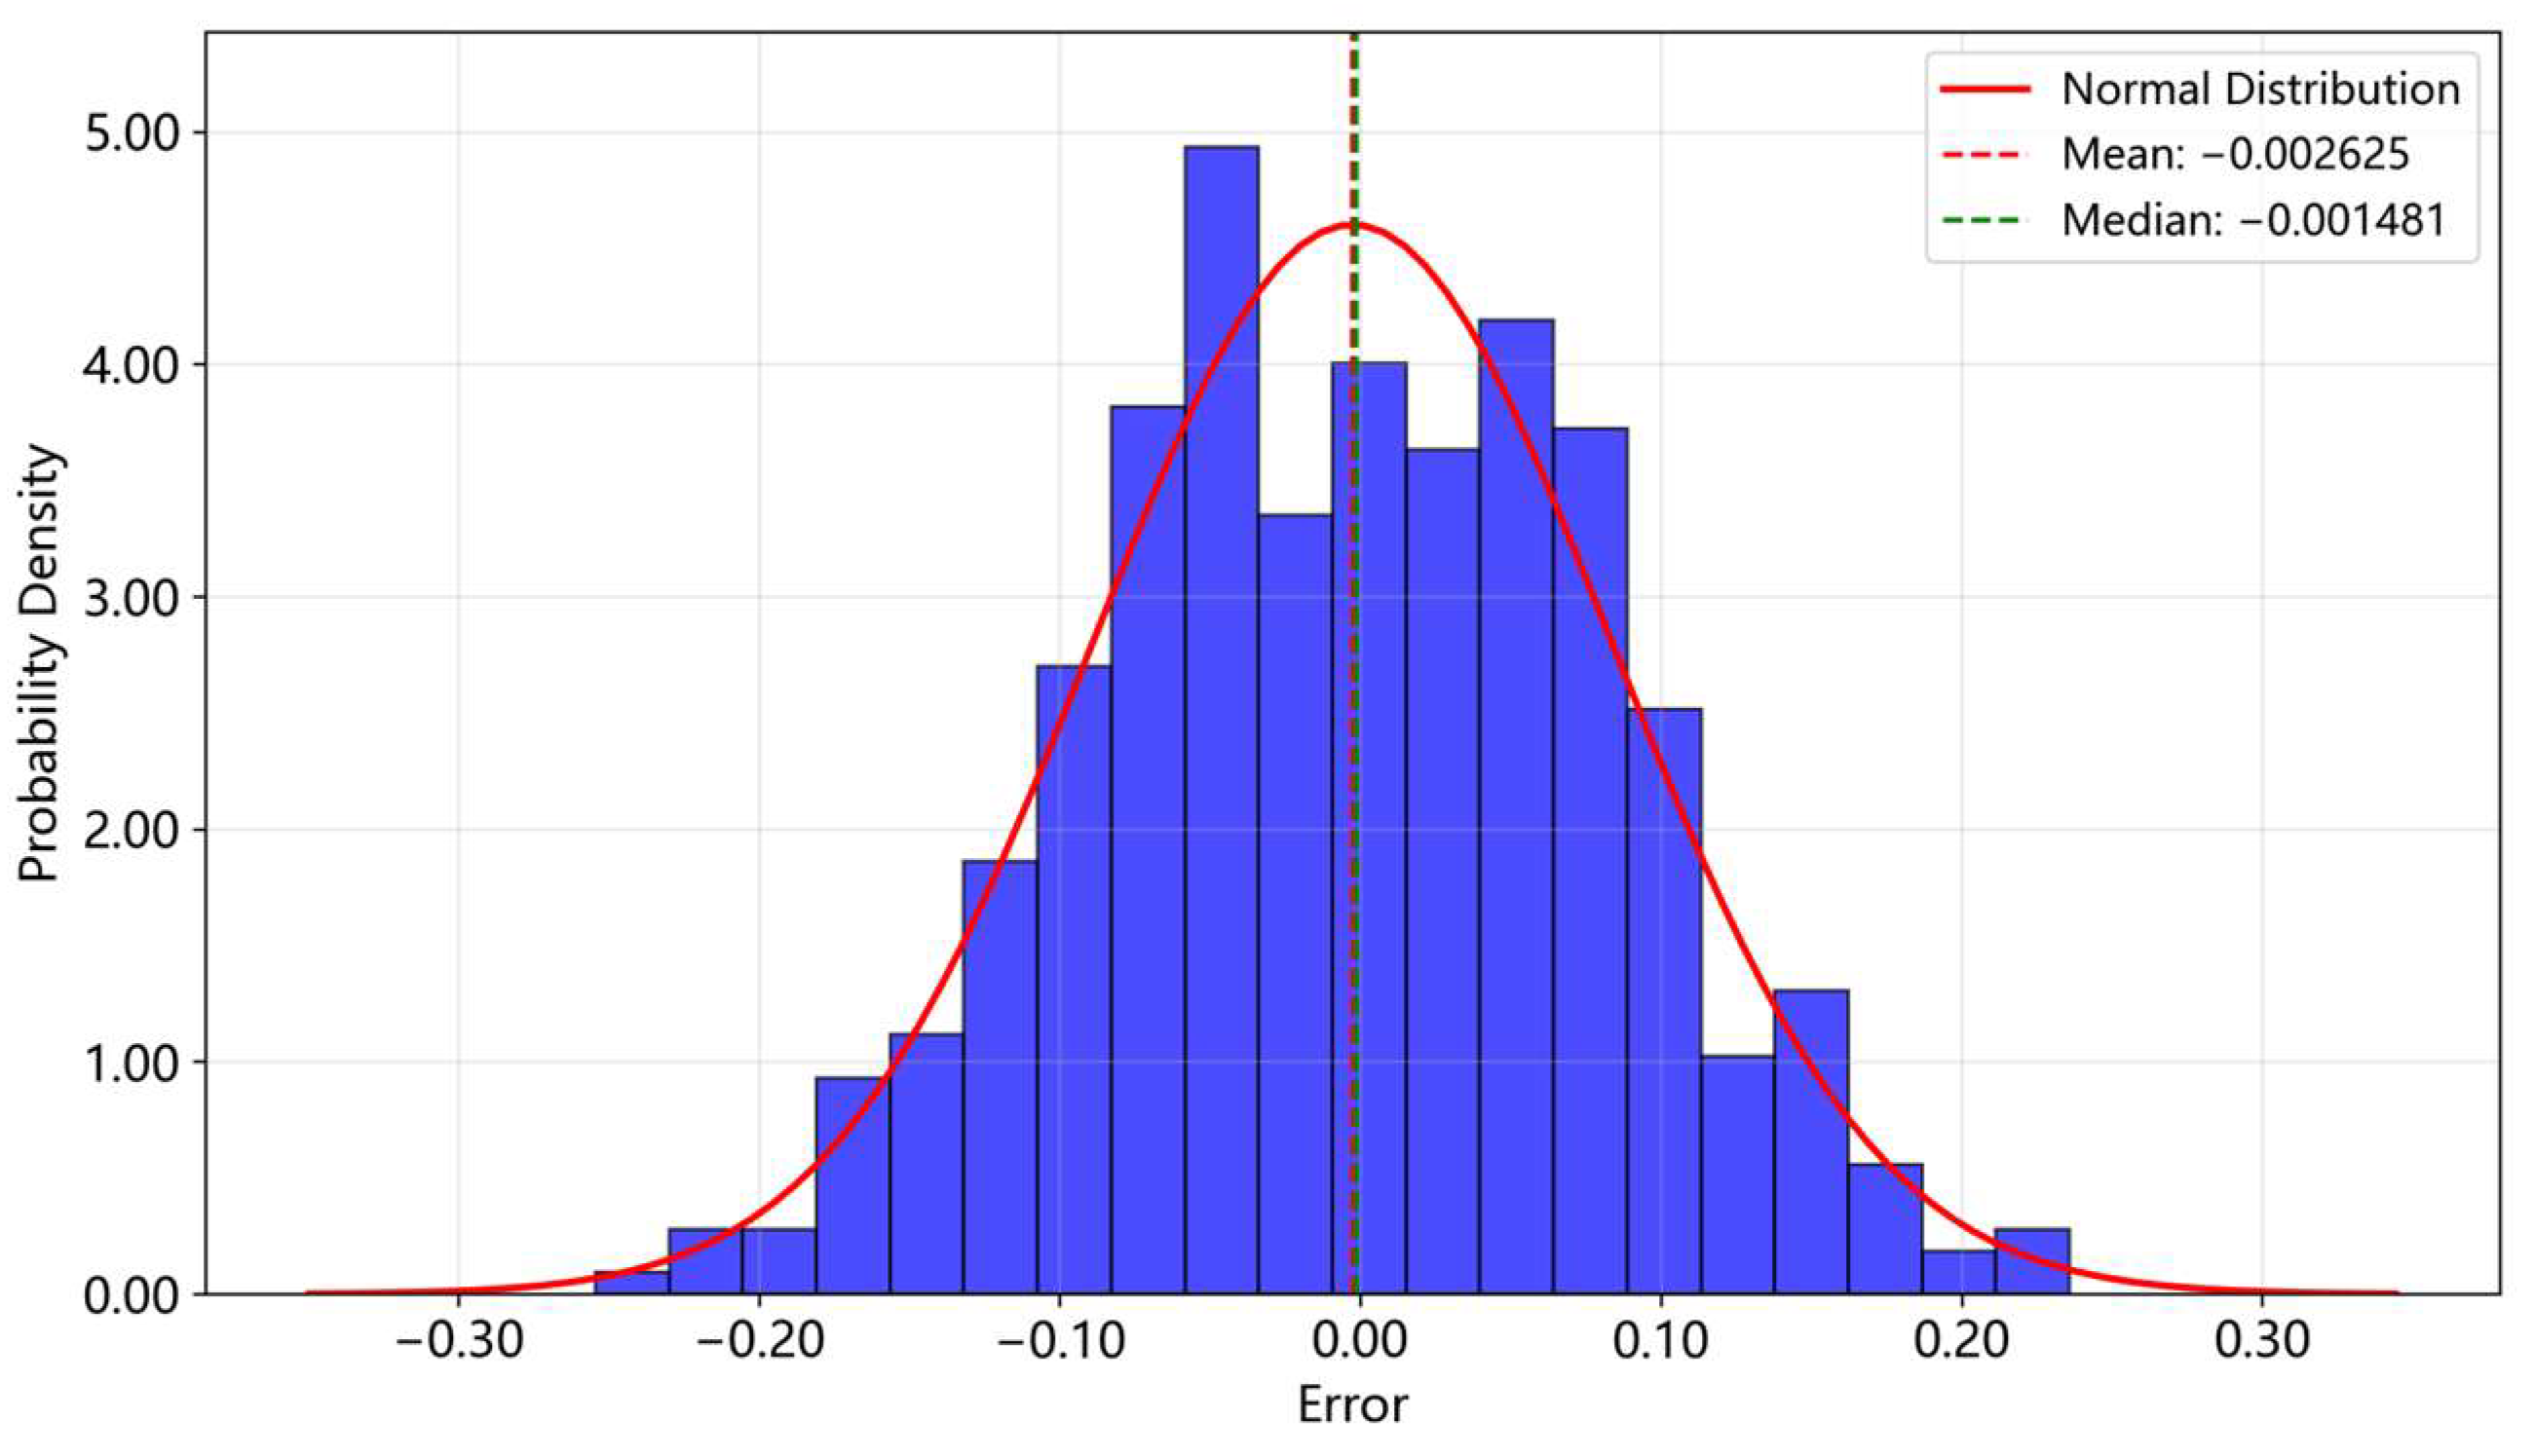
Figure 4 presents the error distribution of the ensemble model, which approximates a normal distribution. The mean of the error distribution is −0.002625, and the median is −0.001481. Both values are close to zero and relatively close, indicating that the overall prediction bias of the model is small and there is no obvious systematic bias, further verifying the accuracy and stability of the model. The concentration of errors around zero further validates how the XGBoost + LightGBM integration enhances overall predictive performance through complementary advantages.
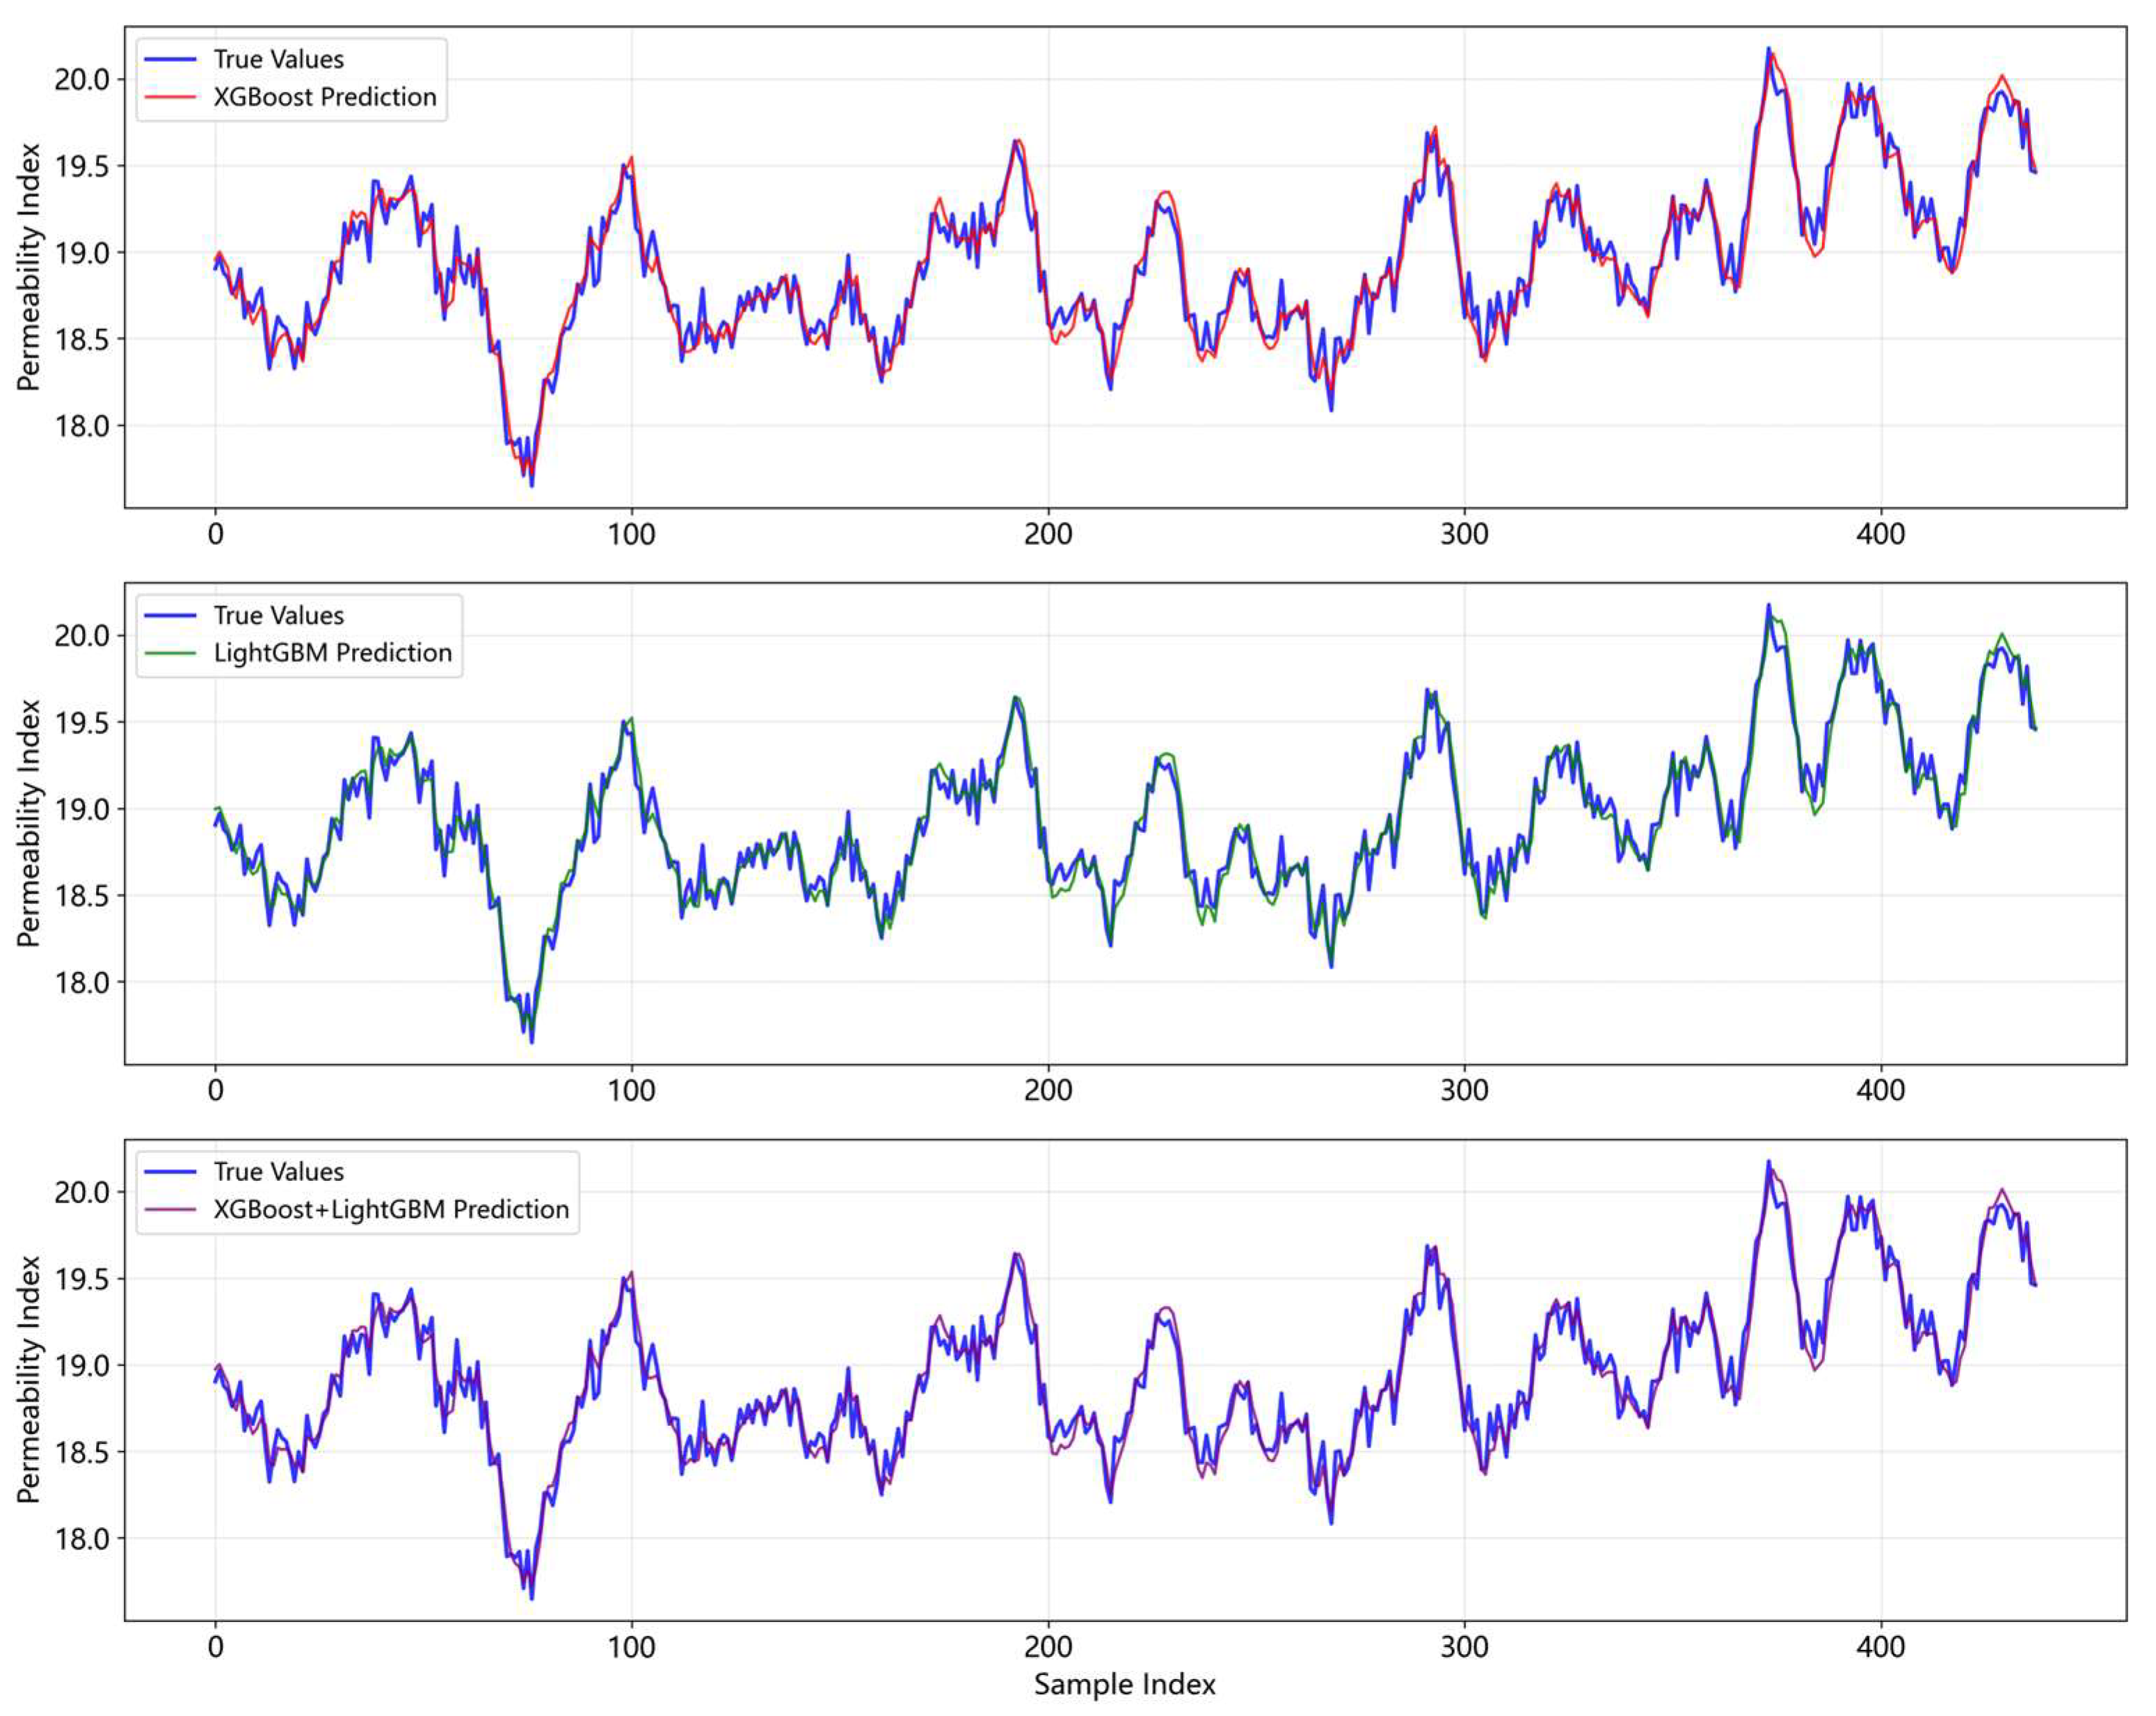
Figure 5 shows the predicted permeability indexes of XGBoost, LightGBM, and the ensemble model against the true values over the time series. The prediction trajectories of all three models align with the trend of the true values. Among them, the predictions of the ensemble model most closely fit the true values, especially in regions where the true values change significantly, where the ensemble model demonstrates more stable predictive capability.

4. Conclusions

Based on 25 initial parameters from a domestic blast furnace (January to June 2024), 20 key parameters affecting the permeability index through Spearman correlation analysis were identified, including operational parameters (e.g., charging rate, blast volume/pressure), thermal indicators (e.g., combustion temperature, cooling stave differential), and gas flow indices. The proposed XGBoost + LightGBM ensemble model achieves outstanding permeability index prediction performance, with an RMSE of 0.0868, an MAE of 0.0708, and an R2 of 0.9602. These results demonstrate high accuracy, robust stability, and effective trend-tracking capability, establishing a reliable technical foundation for intelligent blast furnace control.

Author Contributions

Conceptualization, B.X. and H.N.; methodology, B.X. and H.N.; data curation, H.L.; writing, B.X. and H.N.; supervision, H.N. and X.S.; review and editing, B.X., H.L. and X.S. All authors have read and agreed to the published version of the manuscript.

Funding

This research was funded by Research on Basic Science (Natural Science) in Jiangsu Higher Education Institutions, grant number 24KJD450001; Scientific Research Platform Project of Changzhou College of Information Technology, grant number KYPT202105G and supported by Changzhou Sci&Tech Program, grant number CJ20241008.

Institutional Review Board Statement

Not applicable.

Informed Consent Statement

Not applicable.

Data Availability Statement

The data provided in this study can be obtained from the corresponding author due to its involvement in commercial production and confidentiality.

Conflicts of Interest

The authors declare no conflict of interest.

References

  1. Chu, L.M.; Cui, G.M. Predicting Blast Furnace Permeability Index: A Deep Learning Approach with Limited Time-Series Data. Metall. Res. Technol. 2024, 121, 215. [Google Scholar] [CrossRef] [Scilit]
  2. Luo, Y.Y.; Zhang, X.M.; Kano, M.; Deng, L.; Yang, C.J.; Song, Z.H. Data-Driven Soft Sensors in Blast Furnace Ironmaking: A Survey. Front. Inf. Technol. Electron. Eng. 2023, 24, 327–354. [Google Scholar] [CrossRef] [Scilit]
  3. Li, H.Y.; Bu, X.P.; Liu, X.J.; Li, X.; Li, H.W.; Liu, F.L.; Lyu, Q. Evaluation and Prediction of Blast Furnace Status Based on Big Data Platform of Ironmaking and Data Mining. ISIJ Int. 2021, 61, 108–118. [Google Scholar] [CrossRef] [Scilit]
  4. Yan, F.; Kong, L.Y.; Li, Y.R.; Zhang, H.W.; Yang, C.J.; Chai, L. A Survey of Data-Driven Soft Sensing in Ironmaking System: Research Status and Opportunities. ACS Omega 2024, 9, 25539–25554. [Google Scholar] [CrossRef] [Scilit] [PubMed]
  5. Zhou, H.L.; He, Y.B.; Li, B.Z.; Song, D.Z.; Zhu, Q.; Li, Y.H. Ironmaking Process Under Artificial Intelligence Technology: A Review. Ironmak. Steelmak. 2024, 53, 03019233241277361. [Google Scholar] [CrossRef] [Scilit]
  6. Su, X.L.; Zhang, S.; Yin, Y.X.; Xiao, W.D. Prediction Model of Permeability Index for Blast Furnace Based on the Improved Multi-Layer Extreme Learning Machine and Wavelet Transform. J. Frankl. Inst. 2018, 355, 1663–16691. [Google Scholar] [CrossRef] [Scilit]
  7. Yu, Z.H.; Li, X.M.; Wang, B.R.; Lin, X.H.; Ren, Y.Z.; Xing, X.D. A Hybrid Prediction Model of Blast Furnace Permeability Index Combining Least Square Support Vector Machine and Artificial Neural Network. Ironmak. Steelmak. 2024, 53, 03019233241288764. [Google Scholar] [CrossRef] [Scilit]
  8. Jiang, D.W.; Wang, Z.Y.; Li, K.J.; Zhang, J.L. Analysis of Blast Furnace Permeability Regulation Strategy Based on Machine Learning. Steel Res. Int. 2024, 95, 2300590. [Google Scholar] [CrossRef] [Scilit]
  9. Zhao, J.; Li, H.W.; Liu, X.J.; Li, X.; Li, H.Y.; Lyu, Q. Blast furnace permeability index prediction model based on Xgboost. Chin. Metall. 2021, 31, 22–29. (In Chinese) [Google Scholar]
  10. Liu, X.J.; Zhang, Y.H.; Li, X.; Zhang, Z.F.; Li, H.Y.; Liu, R.; Chen, S.J. Prediction for Permeability Index of Blast Furnace Based on VMD-PSO-BP Model. J. Iron Steel Res. Int. 2024, 31, 573–583. [Google Scholar] [CrossRef] [Scilit]
  11. Luo, S.H.; Dong, L.H. Intelligent Prediction of Blast Furnace Permeability Index Using a Hybrid TCN-GRU Model with Mode Decomposition and Error Compensation. ISIJ Int. 2025, 65, 1267–1278. [Google Scholar] [CrossRef] [Scilit]
  12. Chen, T.Q.; Guestrin, C. XGBoost: A Scalable Tree Boosting System. In Proceedings of the 22nd ACM SIGKDD International Conference on Knowledge Discovery and Data Mining, San Francisco, CA, USA, 13–17 August 2016; pp. 785–794. [Google Scholar]
  13. Ke, G.L.; Meng, Q.; Finley, T.; Wang, T.F.; Chen, W.; Ma, W.D.; Ye, Q.W.; Liu, T.Y. Lightgbm: A Highly Efficient Gradient Boosting Decision Tree. In Proceedings of the 31st Conference on Neural Information Processing Systems, Long Beach, CA, USA, 4–9 December 2017. [Google Scholar]
  14. Lyu, Q.; Liu, Y.M.; Zhang, Z.F.; Liu, S. Predicting the FeO content of sintered ore based on Chenggang’s production data. J. Iron Steel Res. 2018, 30, 957–962. (In Chinese) [Google Scholar]
Figure 1. Spearman feature correlation analysis heatmap.
Engproc 141 00015 g001
Figure 2. Schematic diagram of the XGBoost model.
Engproc 141 00015 g002
Figure 3. Comparison of true values and predicted values for the ensemble model.
Engproc 141 00015 g003
Figure 4. Error distribution of the ensemble model.
Engproc 141 00015 g004
Figure 5. Comparison of predicted permeability index by xgboost, lightgbm, and ensemble model with true values.
Engproc 141 00015 g005
Table 1. Evaluation metrics of the ensemble model.
Evaluation MetricsRMSEMAER2
Value0.08680.07080.9602
Disclaimer/Publisher’s Note: The statements, opinions and data contained in all publications are solely those of the individual author(s) and contributor(s) and not of MDPI and/or the editor(s). MDPI and/or the editor(s) disclaim responsibility for any injury to people or property resulting from any ideas, methods, instructions or products referred to in the content.