1. Introduction
The integration of renewable energy sources into South Africa’s grid has increased the need for accurate power quality (PQ) monitoring in harmonic-rich networks [
1,
2,
3]. Voltage Transformers (VTs) form part of the measurement chain used to scale high-voltage (HV) signals for PQ analysis [
2,
4].
Harmonic measurements support compliance with SANS 61000-4-30 and NRS 048-4 standards for PQ [
5,
6]. Conventional VTs exhibit frequency-dependent magnitude and phase errors that distort harmonic measurements above 1 kHz, where internal inductive and capacitive elements interact [
2,
4,
7].
International studies have addressed related challenges. Vermeulen and Davel developed broadband models for capacitive VTs (CVTs) in the South African grid [
8], while Meyer and Sperling characterised VT frequency response in European (EU) grids [
4]. No formal procedure currently exists for evaluating the frequency response of VTs used in PQ compliance assessments [
2,
4,
7,
9].
This paper addresses that gap by reviewing established CT, VT, and CVT frequency-response methodologies and proposing an adapted framework for traditional South African single-phase VTs. The goal is to enhance the reliability of harmonic measurements and to establish a technical basis for future VT testing standards in South Africa.
2. Comparative Review of Frequency Response Testing
This section reviews established CT, VT, and CVT frequency-response methodologies and identifies their relevance to renewable-energy harmonic measurements.
2.1. CT Testing in South Africa
Murray and de Kock developed a structured method for evaluating CT frequency response under harmonic excitation [
1,
3,
10]. Their configuration uses a programmable source, precision shunt, and Class A power analyser to inject controlled harmonic currents and measure ratio and phase errors across 50 Hz–5 kHz [
1,
3,
10].
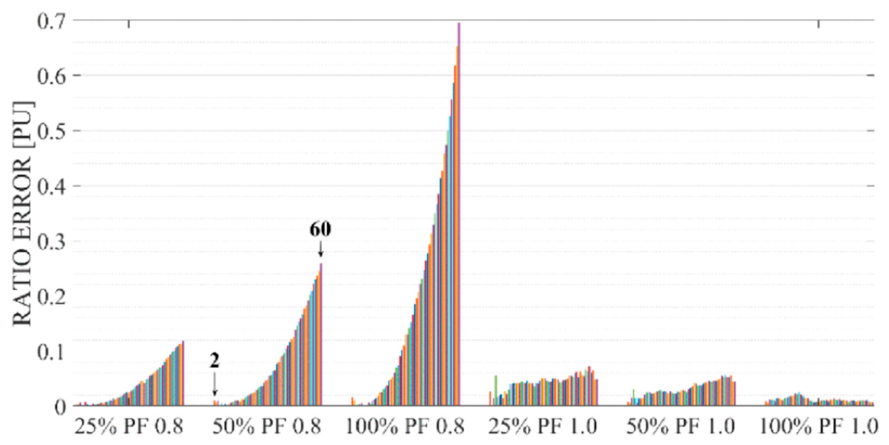
Figure 1 illustrates how burden and power factor (PF) affect CT ratio error [
10]. Superimposing harmonics on the fundamental current reduces ratio error and enhances measurement stability [
1]. Increasing burden raises secondary reactance, causing current to divert through parasitic capacitances and increasing error [
10]. At unity PF, exponential error growth is reduced, but the nonlinear response continues at lower harmonic orders (up to the 20th) due to magnetic-core effects [
1,
10].
The findings justify including variation in burden in VT frequency-response testing. Although CTs operate under current excitation, their impedance sensitivity provides a methodological foundation for voltage-based transformer studies.
2.2. VT Testing in Europe
Meyer and Sperling investigated the wideband performance of inductive and capacitive VTs in EU grids [
2,
4]. Their research identified resonance peaks above 1 kHz and frequency-dependent ratio errors under harmonic excitation [
2,
7]. Meyer developed a frequency-dependent accuracy classification and assessed the effects of temperature and stray capacitance on VT performance [
2,
7,
9].
The frequency response is measured using two indices [
2,
4,
9]. The ratio error ε
v(f), defined by (1), measures the deviation in transformation magnitude relative to the rated frequency (
).
where
and
are the secondary and primary voltages at frequency f [
4].
The phase displacement error Δϕ(f), as defined in (2), quantifies the phase shift introduced by the transformer.
where θ
s(f) and θ
p(f) are the secondary and primary phase angles [
9]. Phase displacement directly influences harmonic power-flow calculations and the accuracy of PQ compliance assessment [
2,
7,
9].
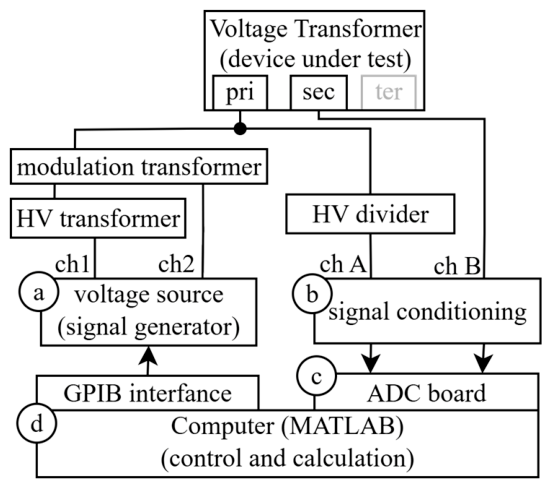
To improve realism, an HV test setup was used with a modulation transformer to superimpose a swept-sine signal (about 10% of the fundamental) onto the rated fundamental component, as shown in
Figure 2 [
4,
7]. This method prevents magnetic core saturation while allowing resonance detection.
These design features influence considerations for resonance and shielding. However, EU VT constructions differ from those used in South Africa, limiting direct methodological transfer [
1,
9].
Table 1 summarises key distinctions in the harmonic behaviour of CT and VT, based on foundational studies.
2.3. CVT Testing in South Africa
Vermeulen and Davel developed broadband CVT models under harmonic excitation [
8]. Their lumped-parameter model of a 400 kV CVT includes capacitive dividers and damping-ratio resistors that influence the resonance and amplitude behaviour [
8].
Although CVTs differ structurally from conventional VTs, these findings provide insight into capacitive and dielectric effects within voltage-domain measurements.
2.4. Synthesis and Identified Gaps
These studies confirm that transformer frequency response is affected by resonance, burden, and dielectric effects, which vary across different designs and operating conditions [
1,
4,
8]. CT methods provide traceable frameworks for harmonic injection and uncertainty assessment [
1,
7]. EU VT studies define resonance characterisation techniques [
4,
9], while CVT models identify capacitive coupling relevant to voltage-domain response [
8].
Table 2 summarises the methodologies and findings of these studies.
Despite these advances, no published method exists for evaluating the frequency response of conventional VTs under South African grid conditions [
3]. The absence of a traceable test method introduces uncertainty in the accuracy of harmonic measurements and complicates grid code verification for renewable installations [
3]. Related international work by Crotti et al. [
11] evaluated the accuracy of inductive VT under harmonics and interharmonics, but no globally standardised procedure has been defined.
2.5. Limitations of Existing Standards
Existing PQ and IT standards define performance only at the fundamental frequency. SANS 61000-4-30, IEC TR 61869-103, and NRS 048-4 therefore exclude harmonic frequency-response verification, which is required for accurate assessment in distorted networks [
2,
3,
5,
6].
SANS 61000-4-30 specifies Class A voltage measurement accuracy at 50 Hz, but specifies no harmonic verification procedure [
1,
4,
5]. IEC TR 61869-103 defines inductive transformer accuracy classes up to 60 Hz, without requiring harmonic testing [
2,
3,
9]. NRS 048-4 assumes linear transformer behaviour and excludes transformer-induced error analysis [
1,
3,
6].
Compliance verification relies on assumed accuracy, thereby introducing unquantified uncertainty into PQ assessments [
9]. This regulatory gap reduces confidence in Class A PQ assessments above the fundamental frequency [
2].
3. Methodological Gap and Justification
The reviewed literature presents established frequency-response methods for CTs [
1,
10], VTs [
4,
9], and CVTs [
8], but none directly addresses traditional VTs used in South African renewable energy networks.
Existing PQ and IT standards, including SANS 61000-4-30, IEC TR 61869-103, and NRS 048-4, do not specify procedures for evaluating VT behaviour above 50 Hz [
1,
5,
6,
7,
9]. Consequently, harmonic compliance verification assumes transformer linearity, which introduces unquantified measurement uncertainty [
1,
9].
Conventional VTs show frequency-dependent transfer characteristics influenced by resonance, burden sensitivity, and dielectric interactions [
2,
3]. These mechanisms cause magnitude and phase deviations beyond the fundamental frequency [
3,
4].
In South African networks, where inverter-based generation produces significant harmonic content, this behaviour affects PQ measurement accuracy [
1]. The proposed method extends this framework to conventional VTs by incorporating voltage-domain excitation and burden impedance variation to quantify frequency-dependent ratio and phase errors.
4. Proposed Method for Frequency Response Testing of Conventional Voltage Transformers
This section presents an adapted test method for measuring the frequency response of single-phase VTs under harmonic excitation. The framework combines the harmonic injection technique [
1,
10], swept-sine frequency modelling [
4,
9], and capacitive coupling considerations [
8] from previous transformer studies. The approach is customised to suit South African grid conditions, VT construction, and the available laboratory equipment.
4.1. Objectives and Scope
The method evaluates the frequency response of three conventional single-phase VTs rated at 11 kV, 22 kV, and 33 kV. These units represent typical MV transformers deployed in renewable power plants, where inverter-based generation introduces HD [
1,
3,
4].
The results support the development of correction techniques and inform PQ compliance assessment in accordance with SANS 61000-4-30 and NRS 048-4.
4.2. Experimental Setup
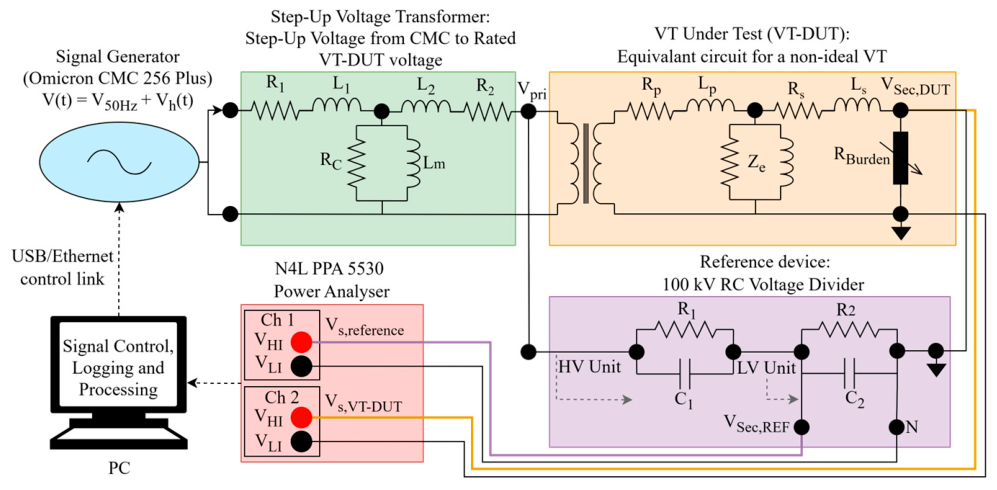
Figure 3 illustrates the experimental configuration for VT frequency response testing. A harmonic-rich voltage waveform is generated using an Omicron CMC test unit, injecting the fundamental 50 Hz component along with superimposed harmonics. The fundamental excitation establishes rated core flux, while the superimposed harmonics enable evaluation of frequency-dependent ratio and phase errors.
The signal is stepped up to the required primary voltage using a step-up transformer. The VT under test (VT-DUT) is connected in parallel with a reference voltage divider that provides the measurement baseline. All elements in the measurement chain were characterised before testing. Secondary outputs were recorded using a dual-channel Class A power analyser.
4.3. Excitation Profiles and Test Conditions
Three excitation profiles were applied:
Fundamental-only excitation at 50 Hz to establish baseline accuracy.
Harmonic-only excitation at discrete harmonic frequencies (2nd–60th).
Combined excitation with harmonics superimposed on the fundamental.
A harmonic-rich voltage waveform was generated using the OMICRON CMC 256 Plus and applied to both the VT-DUT and reference divider through the step-up transformer.
Burden impedance was varied at 25%, 50%, and 100% of the nominal load using controlled resistive and inductive elements. Testing was conducted under unity and lagging-PF conditions to reflect practical measurement environments. Frequency sweeps from 100 Hz to 3 kHz were performed to identify resonant regions [
4,
7,
9].
4.4. Measurement and Error Evaluation
The primary and secondary voltages of both the VT-DUT and the reference divider were measured simultaneously using a dual-channel power analyser [
1,
4,
10]. The harmonic-magnitude error is calculated using (3),
where K is the transformation ratio,
and
are the secondary and primary voltage amplitudes at the harmonic
respectively [
1,
3].
The phase displacement error (2) and harmonic-magnitude error (3) were evaluated to determine each VT’s frequency response curve. Results were assessed against PQ measurement limits specified in SANS 61000-4-30 and IEEE 519:2022, and compared with established CT studies to ensure traceability [
1,
2,
3,
9].
Table 3 summarises the relevant voltage and current measurement accuracy limits [
1,
3]. These limitations inform component selection and calibration for the measurement chain.
4.5. Measurement Uncertainty
Measurement uncertainty was assessed using Type A and Type B methods [
1]. Type A uncertainty was obtained from repeated measurements using the arithmetic method defined by (4)–(6).
Type B accounted for analyser accuracy, calibration drift, burden tolerance, and environmental variation [
1,
3]. The uncertainty contribution of the reference divider was modelled using its calibrated transfer function.
The combined measurement uncertainty
was evaluated from both Type A and Type B components (7),
where
represents repeatability derived from repeated measurements and
accounts for analyser accuracy, burden tolerance, and calibration drift [
1]. This formulation aligns with the traceable uncertainty methodology used by Murray and ensures consistency across harmonics [
1].
5. Expected Outcomes and Future Work
The proposed method characterises the frequency response of conventional single-phase VTs under harmonic excitation, focusing on ratio errors, phase displacements, and resonance behaviour across harmonic orders [
1,
2,
3,
4].
5.1. Expected Frequency-Response Characteristics
Conventional VTs are expected to show amplitude attenuation and phase non-linearity above approximately 1 kHz [
1,
3,
4]. The interaction between leakage inductance and inter-winding capacitance creates resonance peaks within the 800 Hz–1.2 kHz range.
Ratio error is expected to increase with harmonic order and with applied burden, while the phase-angle deviation will vary non-linearly across the spectrum [
2,
4,
10].
5.2. Reference Divider and Measurement Traceability
Following calibration, the reference voltage divider is expected to provide a stable baseline for frequency-domain comparison and uncertainty analysis. Its transfer function will be verified for linearity and bandwidth, and its uncertainty contribution incorporated into the combined measurement uncertainty in accordance with (7) [
1,
4].
5.3. Simulation and Validation Framework
Theoretical outcomes require validation through simulation and experimental testing [
9]. MATLAB Simulink models replicate the VT under test and the reference divider under harmonic excitation [
1,
9]. The equivalent-circuit models incorporate equivalent-circuit transformer parameters, burden impedance, and harmonic spectra representative of inverter-based renewable systems [
1,
9].
Simulated and measured transfer functions defined in (8) are compared to identify unmodelled resonance phenomena and refine circuit parameters,
5.4. Future Work
Future work will focus on the following:
Reference divider calibration across the harmonic spectrum.
Laboratory validation on 11 kV, 22 kV, and 33 kV VTs.
Environmental testing to assess temperature influence.
Alignment with SANS 61000-4-30 and IEEE 519 compliance thresholds.
Developing a repeatable VT frequency-response testing protocol.
This research aims to close a methodological gap in harmonic measurement by adapting validated CT and VT test frameworks to South African transformer designs and grid conditions.
6. Conclusions
Accurate harmonic measurement remains essential for PQ compliance in inverter-dominated renewable energy networks [
1,
3]. International VT studies [
4,
9] and South African CVT models [
8] have improved the understanding of resonance and capacitive effects. While CT frequency response has been characterised through traceable laboratory testing [
1,
10], conventional VTs remain uncharacterised at harmonic frequencies under local conditions.
This study introduces a synthesis-based framework for evaluating the frequency response of single-phase VTs by applying controlled harmonic-voltage injection, burden variation, and comparative measurements against a calibrated reference divider. Ratio and phase errors are measured up to the 60th harmonic, and a combined uncertainty analysis is conducted to guarantee measurement traceability. MATLAB Simulink models support the experimental configuration.
By integrating validated methodologies from CT, VT, and CVT research and addressing the lack of a local harmonic-testing standard, this work lays the groundwork for standardised VT frequency-response characterisation within South African renewable-energy systems. The proposed approach aims to enhance the accuracy of harmonic measurements in renewable power plants. It supports the future standardisation of voltage transformer frequency-response testing in line with IEC and national compliance requirements.
Author Contributions
Conceptualisation, S.E. and J.A.d.K.; methodology, S.E.; validation, S.E. and J.A.d.K.; formal analysis, S.E.; investigation, S.E.; resources, S.E. and J.A.d.K.; writing—original draft preparation, S.E.; writing—review and editing, J.A.d.K.; visualisation, S.E.; supervision, J.A.d.K.; project administration, S.E. and J.A.d.K.; funding acquisition, S.E. and J.A.d.K. All authors have read and agreed to the published version of the manuscript.
Funding
This research was funded by the ISH2009-SAIEE Research Scholarship in High Voltage Engineering, administered by the South African Institute of Electrical Engineers (SAIEE). No specific funding number is associated with this scholarship.
Institutional Review Board Statement
Not applicable.
Informed Consent Statement
Not applicable.
Data Availability Statement
No new data were created or analyzed in this study.
Conflicts of Interest
The authors declare no conflicts of interest.
References
- Murray, R. Quantifying and compensating for the influence of instrument transformers on harmonic measurements for grid code compliance. Ph.D. Dissertation, The Department of Electrical and Electronic Engineering, North-West University, Potchefstroom, South Africa, 2024. [Google Scholar]
- Pfajfar, T.; Meyer, J.; Schegner, P.; Papič, I. Influence of instrument transformers on harmonic distortion assessment. In Proceedings of the 2012 IEEE Power and Energy Society General Meeting, San Diego, CA, USA, 22–26 July 2012; pp. 1–6. [Google Scholar] [CrossRef] [Scilit]
- Murray, R.; de Kock, J.A. Instrument transformers influence on harmonic measurements for grid code compliance. In Proceedings of the 2018 IEEE 4th Global Electromagnetic Compatibility Conference (GEMCCON), Stellenbosch, South Africa, 7–9 November 2018; pp. 1–5. [Google Scholar] [CrossRef] [Scilit]
- Meyer, J.; Stiegler, R.; Elst, M.; Sperling, E.; Klatt, M. Accuracy of Harmonic Voltage Measurements in the Frequency Range up to 5 kHz using Conventional Instrument Transformers. In Proceedings of the 21st International Conference on Electricity Distribution, Frankfurt, Germany, 6–9 June 2011. [Google Scholar]
- SANS 61000-4-30; Electromagnetic Compatibility (EMC) Part 4-30: Testing and Measurement Techniques—Power Quality Measurement Methods. South African Bureau of Standards (SABS): Pretoria, South Africa, 2009.
- NRS 048-4; Electricity Supply—Quality of Supply: Part 4—Application Guidelines for Utilities: Edition 1.1. South African Bureau of Standards: Pretoria, South Africa, 2000.
- Meyer, J.; Klatt, M.; Elst, M.; Schegner, P. Frequency responses of MV voltage transformers in the range of 50 Hz to 10 kHz. In Proceedings of the 14th International Conference on Harmonics and Quality of Power—ICHQP 2010, Bergamo, Italy, 26–29 September 2010. [Google Scholar] [CrossRef] [Scilit]
- Vermeulen, H.J.; Davel, P. Voltage harmonic distortion measurements using capacitive voltage transformers. In Proceedings of the IEEE. AFRICON ‘96, Stellenbosch, South Africa, 27 September 1996; Volume 2, pp. 1012–1017. [Google Scholar] [CrossRef] [Scilit]
- Stiegler, R.; Meyer, J.; Kilter, J.; Konzelmann, S. Assessment of voltage instrument transformers’ accuracy for harmonic measurements in transmission systems. In Proceedings of the 2016 17th International Conference on Harmonics and Quality of Power (ICHQP), Belo Horizonte, Brazil, 16–19 October 2016; pp. 152–157. [Google Scholar] [CrossRef] [Scilit]
- Murray, R.; de Kock, J.A. Quantifying the Impact of Varying Inductive Burden When Inductive Current Transformers Are Used for Harmonic Current Measurements for Grid Code Compliance. IEEE Trans. Instrum. Meas. 2024, 73, 9005009. [Google Scholar] [CrossRef] [Scilit]
- Crotti, G.; D’Avanzo, G.; Landi, C.; Letizia, P.S.; Luiso, M. Evaluation of Voltage Transformers’ Accuracy in Harmonic and Interharmonic Measurement. IEEE Open J. Instrum. Meas. 2022, 1, 9000310. [Google Scholar] [CrossRef] [Scilit]
| Disclaimer/Publisher’s Note: The statements, opinions and data contained in all publications are solely those of the individual author(s) and contributor(s) and not of MDPI and/or the editor(s). MDPI and/or the editor(s) disclaim responsibility for any injury to people or property resulting from any ideas, methods, instructions or products referred to in the content. |