Proceeding Paper

Intelligent and Adaptive Islanding Detection in Microgrids with Battery-Supercapacitor Hybrid Energy Storage †
by
Ernest Igbineweka
and
Sunetra Chowdhury
*
Electrical Engineering Department, University of Cape Town, Cape Town 7700, South Africa
*
Author to whom correspondence should be addressed.
Presented at the 34th Southern African Universities Power Engineering Conference (SAUPEC 2026), Durban, South Africa, 30 June–1 July 2026.
Eng. Proc. 2026, 140(1), 34; https://doi.org/10.3390/engproc2026140034
Published: 26 May 2026

Abstract

This paper presents the design and validation of an adaptive islanding detection method (AIDM) for an AC/DC hybrid microgrid integrated with a hybrid energy storage system (HESS) comprising a supercapacitor and a battery. The proposed AIDM combines dual-tree complex wavelet transform (DTCWT), synthetic minority oversampling technique (SMOTE), and long short-term memory (LSTM) network to effectively detect islanding and non-islanding conditions in the microgrid following faults/disturbances. Fault and disturbance signals are captured at the point of common coupling, following which they are extracted and decomposed using DTCWT. The SMOTE algorithm is employed for data preprocessing to balance the dataset and enhance the accuracy of the intelligent classifier. Finally, LSTM is used for training and testing the AIDM for different faults/disturbance classification and detection. Two categories of datasets, T D 1 and T D 2 , are used for testing the AIDM. The results obtained from MATLAB/Simulink show that datasets incorporated with HESS achieve higher detection accuracy of 100% compared to datasets without HESS with average accuracy of 99.77% under sudden load increase. It is also established that the proposed AIDM maintains robustness when exposed to noise signals, confirming its reliability under noisy conditions.

1. Introduction

Variable renewable energy (VRE) integration into the power grid as distributed generation or microgrid (MG) has resulted in various economic and environmental benefits such as affordable and clean energy access, energy security, and reduction in greenhouse gas emissions. However, this has also led to several technical challenges such as bi-directional power flows in the network, frequency fluctuations and power quality issues [1]. A major technical challenge associated with the grid-integration of renewable-based MG is accurate islanding detection [2]. Islanding condition (IC) is defined when the MG is disconnected from the main utility grid at the point of common coupling (PCC) due to faults or disturbances in the MG or in the utility grid but remains energized by its local distributed generation (DG) [2]. Non-islanding condition (NIC) occurs when following a fault/disturbance, the MG remains connected to the grid, but its operation is sub-optimal. MG is operated in either grid-connected mode or island mode. Several islanding detection methods (IDMs) have been proposed by researchers to mitigate the problem of IC and NIC in MG integration into the utility network.
The conventional IDMs are categorized into remote, local, and hybrid approaches. Recent advances in IDMs use signal processing (SP) and intelligent techniques [3,4,5]. Remote and local techniques have some limitations such as power quality (PQ) issues and small non-detection zone (NDZ) [3]. Hybrid detection approaches combine the advantages of both remote and local techniques offering a balance between detection accuracy and minimal network interference. Intelligent IDM can utilize SP and artificial intelligence (AI) tools to develop an IDM algorithm to detect IC and NIC. These approaches can handle large MG networks, adapting to diverse topologies and DGs sources, and ensuring PQ and zero NDZ [2,3].
Several intelligent IDMs have been employed for islanding detection in MG networks [1,3]. In [6], both discrete Fourier transform (DFT) and long short-term memory (LSTM) networks are used to develop intelligent IDM. In this approach, DFT is utilized for feature extraction, while LSTM serves as the classifier. The results demonstrate efficient and reliable islanding detection, characterized by high accuracy, strong dependability, and minimal detection time. In [7], the combination of various MG parameter indices such as voltage, current, and harmonics is used for islanding detection. This approach employed data mining tools to extract valuable data from MG network and effectively detected IC. It also addressed the challenge of setting detection thresholds.
Based on the review of different research methods for IDM and the conclusion derived from their work, this research proposes a novel AIDM algorithm for detecting IC and NIC in an MG network. The proposed AIDM is designed as an intelligent scheme that combines signal processing tools (DTCWT) and machine learning techniques (SMOTE and LSTM) for detecting IC and NIC. The remaining paper is organized as follows: Section 2 presents a detailed methodology for AIDM design. Section 3 describes the MG test system, the theoretical development of feature extraction, the SMOTE algorithm, and LSTM classification for the MG test system. Section 4 discusses the analysis of results, and Section 5 presents the conclusion and recommendations for future work.

2. AIDM Design Methodology

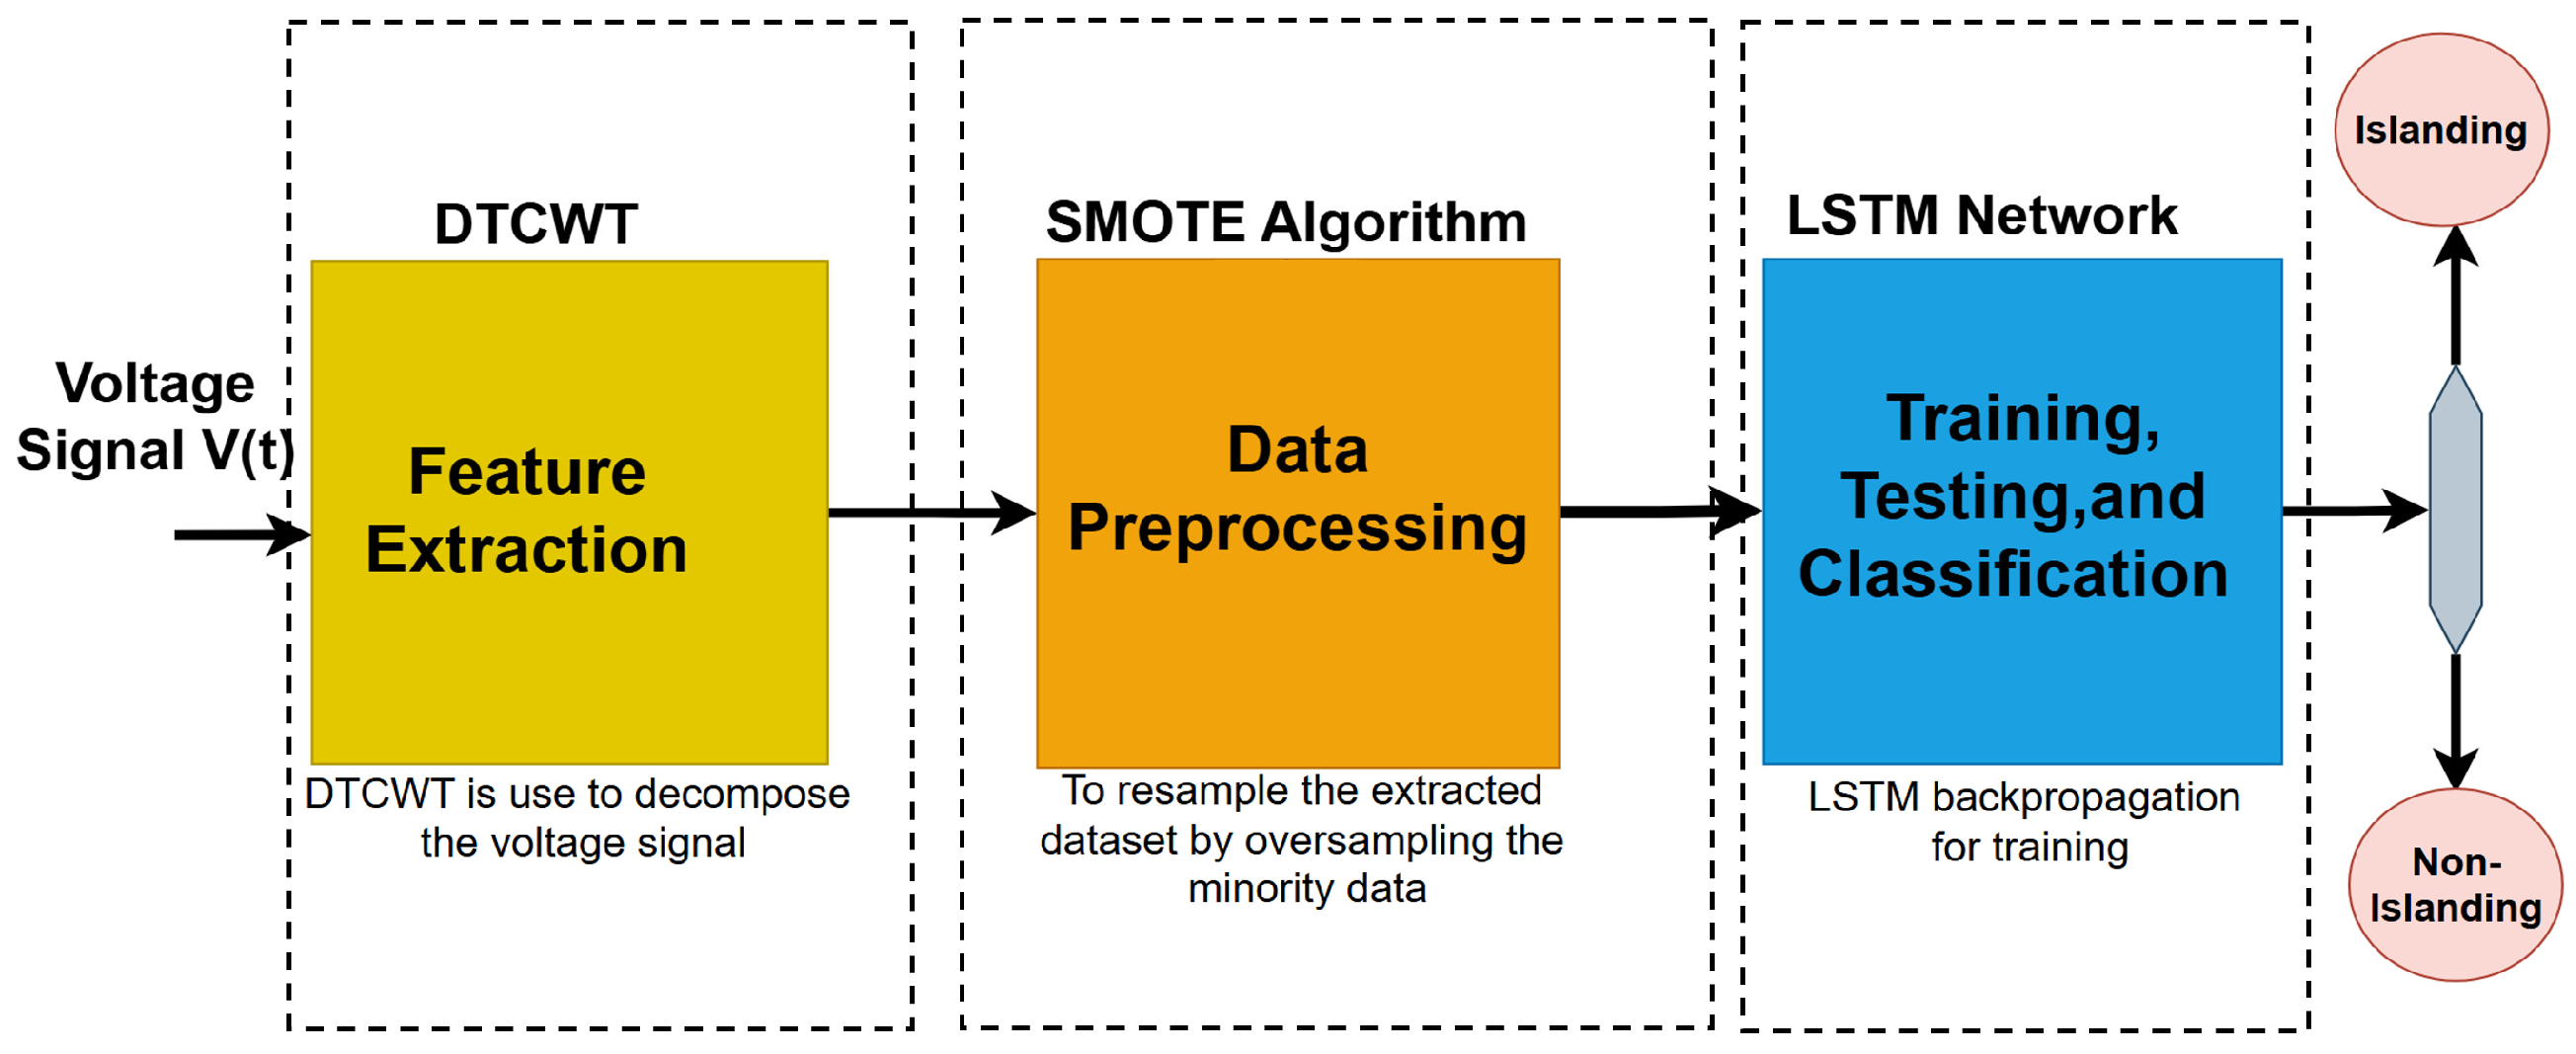
The proposed AIDM algorithm as presented in a previous study in [8] involves three crucial steps that include: (i) feature extraction of voltage signal V(t) (raw voltage signal data) by DTCWT, (ii) data preprocessing by application of the SMOTE algorithm, and (iii) training, testing, and classification of the AIDM. The proposed methodology is evaluated using an MG test system developed by modifying the IEEE 13-bus system. Different faults/disturbance conditions such as, line-to-ground (LG) fault, line-to-line-to-ground (LLG) fault and three-line-to-ground (LLLG) fault, external faults and power mismatch scenarios are created on the microgrid test system (MGTS) as detailed in Table 1. The voltage signal V(t) is measured at PCC by varying resistance from 0.1 to 100 ohm with an interval of 0.2 ohm. The DTCWT tool is applied to extract the features of the measured signal V(t) at the PCC by decomposing the signals into different coefficient datasets comprising the measured fault and disturbance data. The SMOTE algorithm is used to preprocess the coefficient dataset; this improves the quality of the dataset by balancing the minority dataset with the majority dataset; and finally, the LSTM network uses backpropagation, with a cross-entropy loss function for training, testing, and classification of the MG network for detection of IC and NIC. Figure 1 shows the proposed methodological approach for AIDM design.

3. Microgrid Test System Model

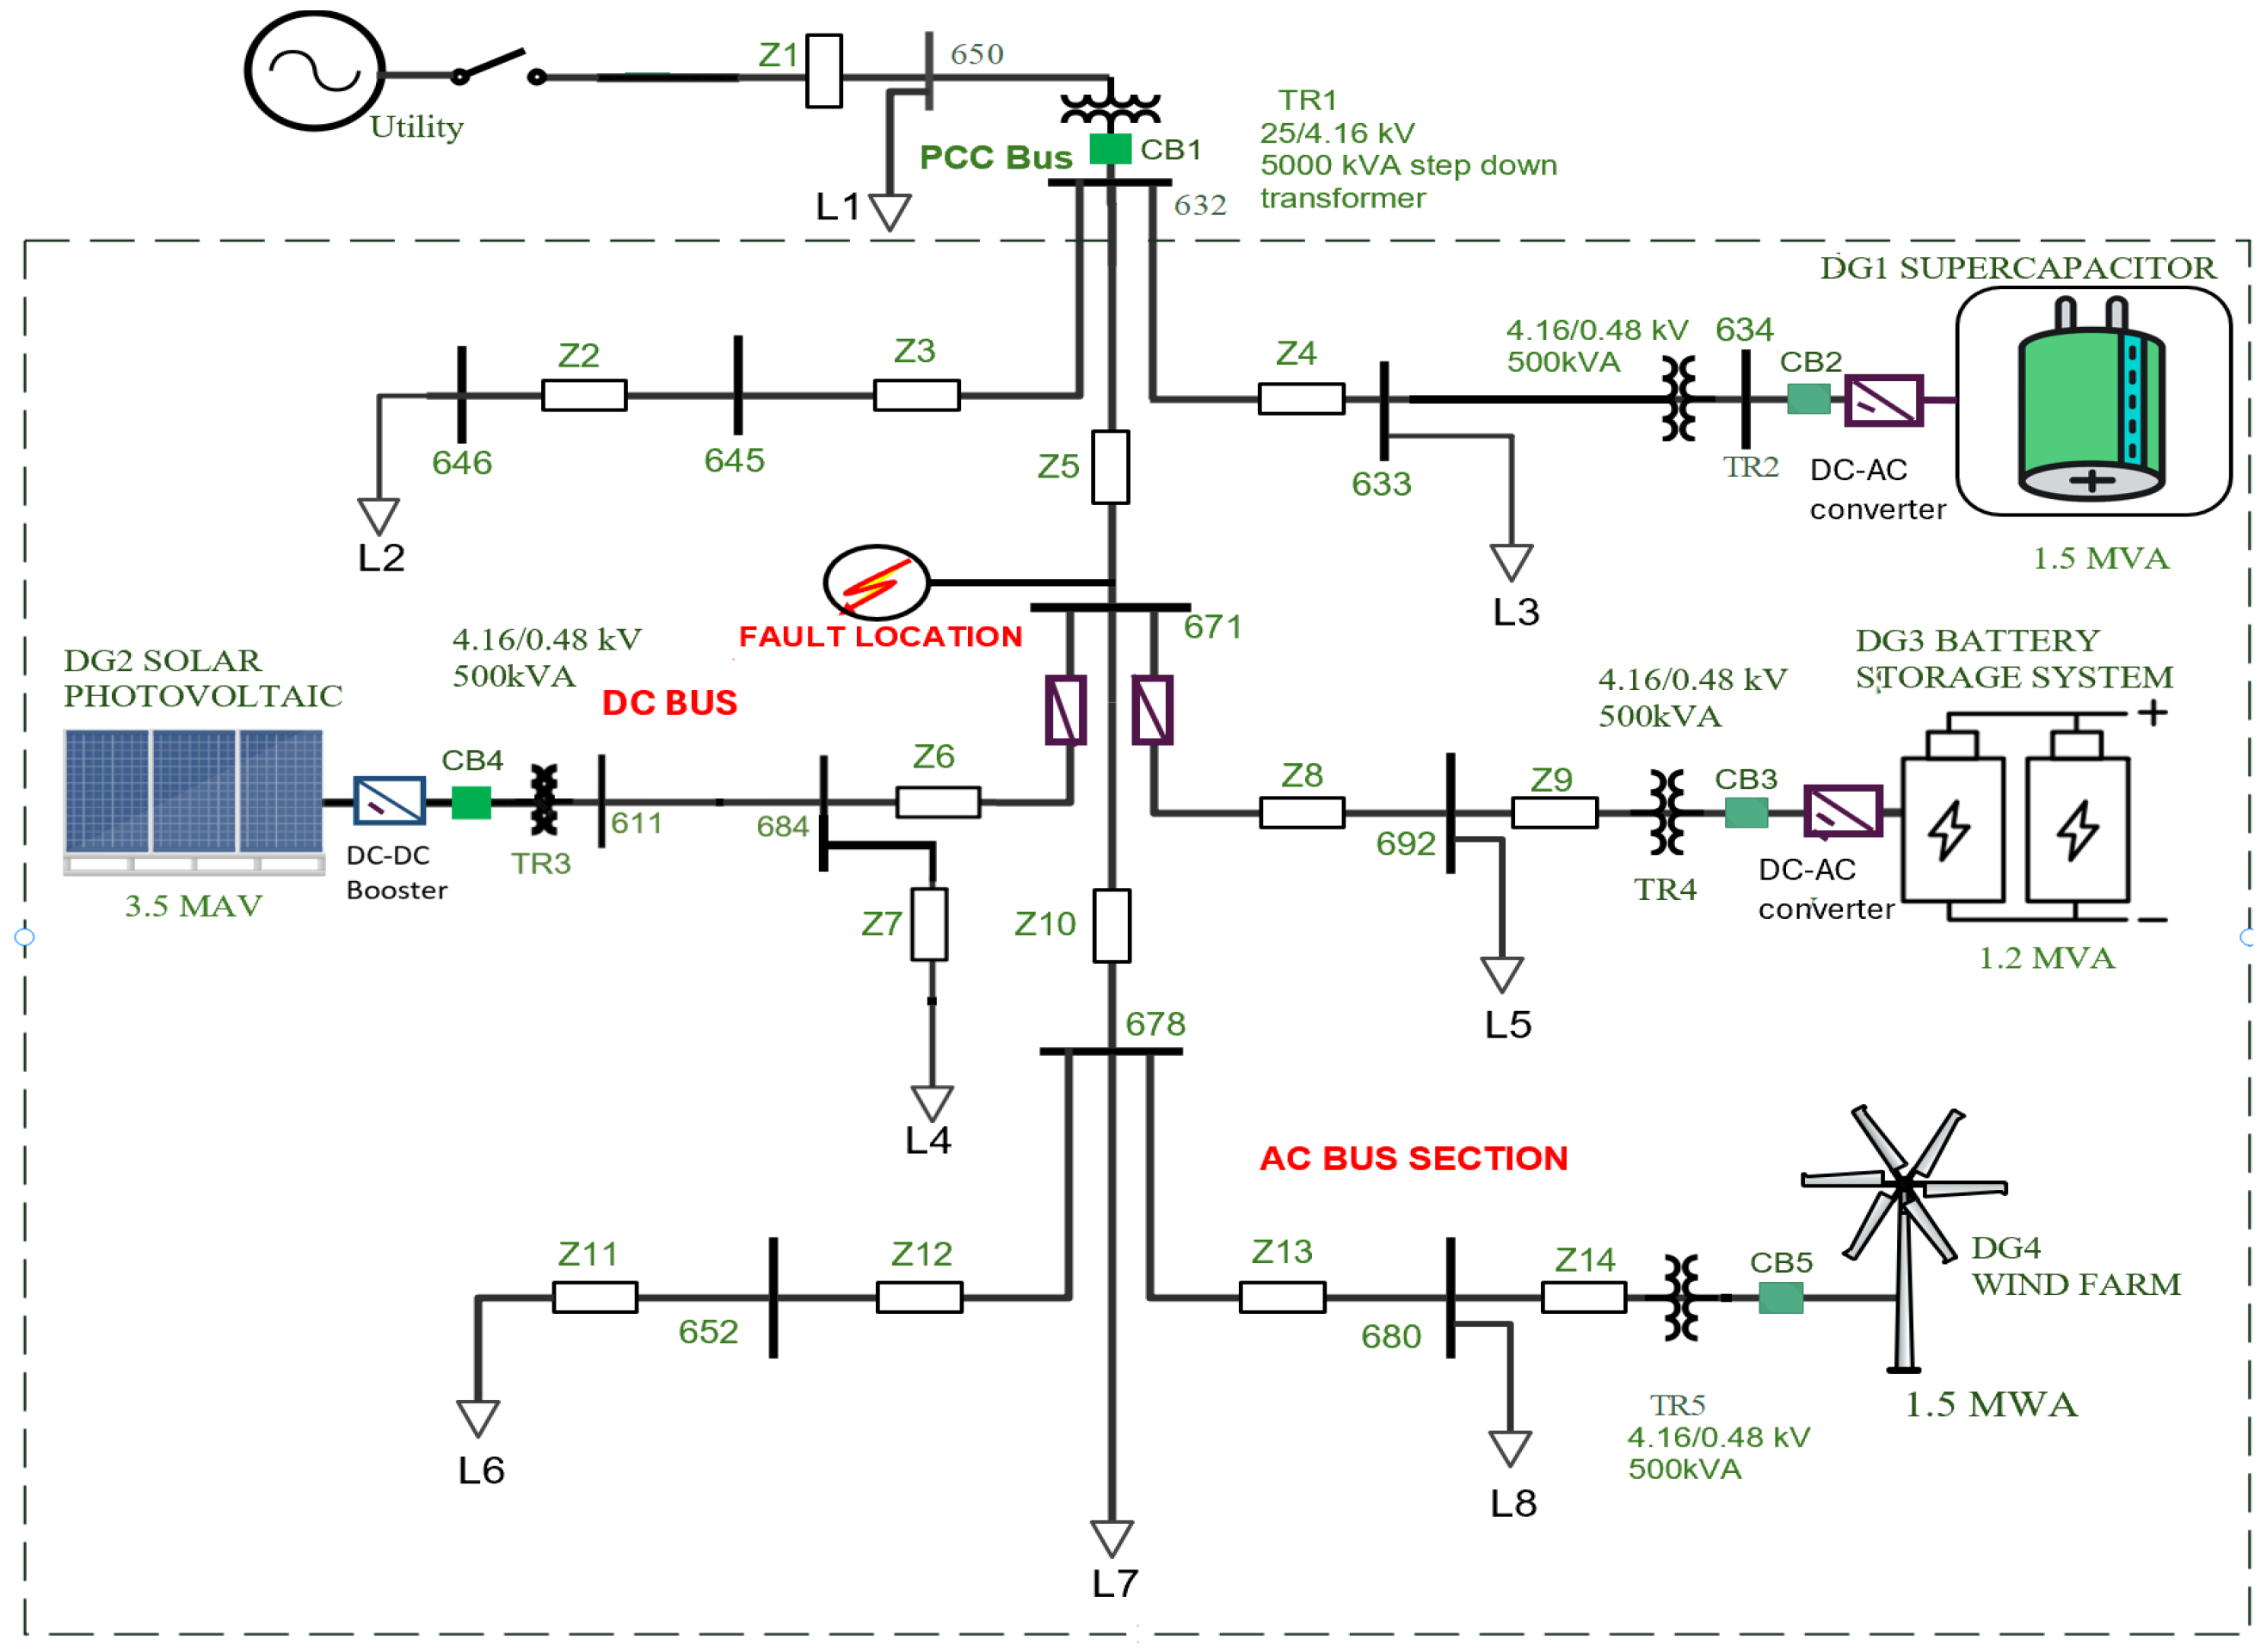
The MGTS schematic diagram is shown in Figure 2. The system comprises four DGs: a 1.5 MVA supercapacitor (DG1), a 3.5 MVA solar PV unit (DG2), a 1.2 MVA battery energy storage system (DG3), and a 1.5 MVA wind turbine (DG4). The MG is interconnected with the utility grid at the PCC, located at bus 632. The utility grid includes an AC generator, bus 650, transformer TR1, and supplies the load L1. The DC bus section is powered by three DC-type DG integrated through a HESS: the supercapacitor (DG1) and the battery (DG3). The supercapacitor connects to DC bus 634 via a DC/AC converter and transformer TR2, the solar PV connects to DC bus 6711via a DC/DC booster and transformer TR3, while the battery connects through its own DC/AC converter and transformer TR4. The wind turbine (DG4) supplies an AC bus section, which is connected to the main grid through bus 678 and transformer TR5, and serves loads L6, L7, and L8. The DC bus 671 is connected to the main grid at PCC bus 632.using a DC-AC converter and supplies loads L41and L5. Impedances Z1–Z141regulate voltage flow across the network. Circuit breakers CB1–CB51connect the utility to load L1, the utility to the MG. All transformers (TR1–TR5) are rated at 11/4.161kV, 5 MVA, 50 Hz, and all generators deliver power via three-phase distribution lines. For validation, different faults are initiated at bus 671 and power mismatch scenarios are also created at loads L1–L7 at different DG locations as detailed in Table 1.

3.1. Feature Extraction for Data Generation

Feature extraction is the process of applying the DTCWT tool to generate data that capture faults/disturbances coefficients. The complex wavelet (CW) is one-sided (meaning only supports one positive signal) [8]. This leads to its shift-invariance problem, which is solved by DTCWT. Let the input voltage signal V0[n], V1[n] be the half-band high pass (HBHP) filter for Tree A and let g0[n], g1[n] be the half-band low pass (HBLP) filters for Tree B used to formulate the equations for the extraction of detail and approximation coefficients, given as [8,9].
V R q + 1 k 0 = n = 0 L 1 a R j   [ n ] .   V 0   [ n 2 k 0 ]
V R q + 1 k 0 = n = 0 L 1 a R j   [ n ] .   V 1   [ n 2 k 0 ]
V I q + 1 k 0 = n = 0 L 1 a I j   [ n ] .   g 0   [ n 2 k 0 ]
V I q + 1 k 0 = n = 0 L 1 a I j   [ n ] .   g 1   [ n 2 k 0 ] ,
Equations (3) and (4) are combined to achieve Equations (5) and (6) which represent equation for the details and approximate coefficient from the V(t).
A q k 0 = a R q k 0 + i   a i q k 0
D q k 0 = d R q k 0 + i   d i q k 0 .
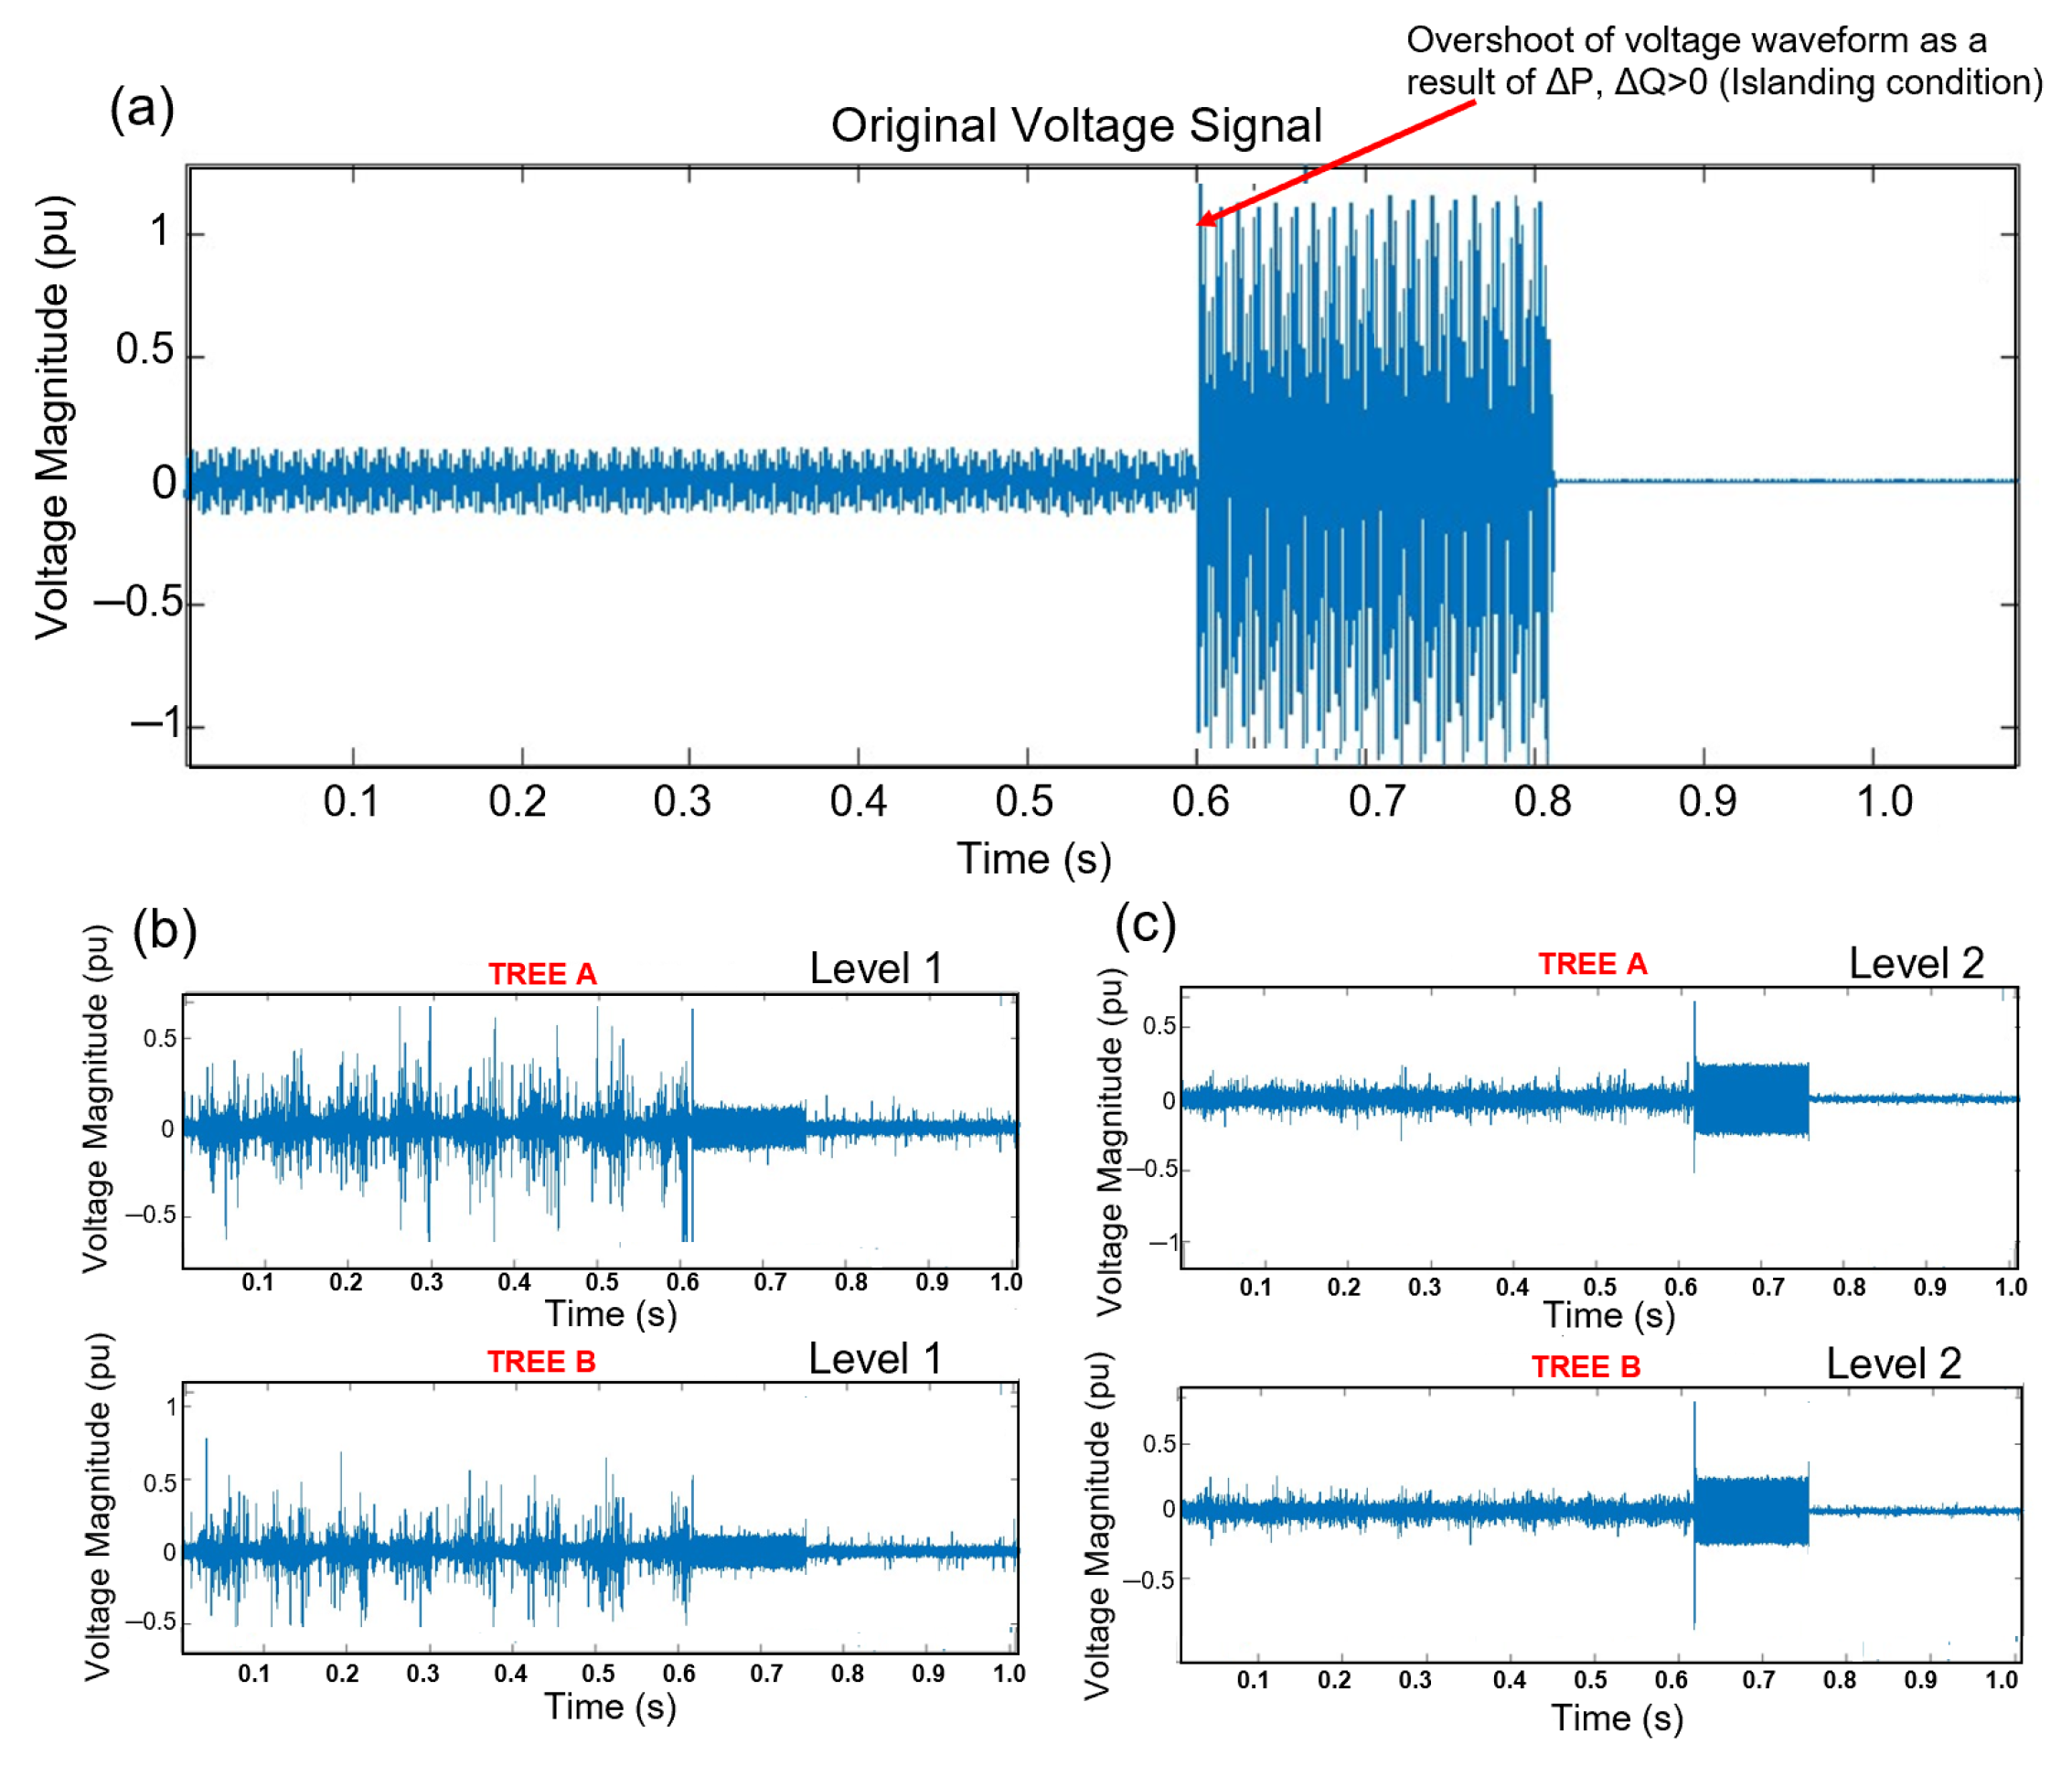
In the above equations, the term A q k 0 is the approximate coefficient of the voltage signal, and D q k 0   i s   the detailed coefficient of the decomposed voltage signal used for the voltage signal decomposition [9]. Three different scenarios are used to simulate faults/disturbances in the MGTS: (i) normal operating conditions, (ii) IC, and (iii) NIC. These scenarios are simulated on the MG network, and the V(t) signal is then sent as input to the MATLAB R2023b workspace, where DTCWT syntax code is applied to extract the detailed and approximate coefficients of the signal. Table 1 presents the different events employed for the selection of IC and NIC. Five levels of decomposition of the V(t) signal are used for this research. The V(t) signal decomposition for the initial two levels of the MGTS is shown in Figure 3, Figure 4 and Figure 5. Figure 3a shows the decomposed voltage waveform, V(n), for phase A at the PCC bus at (t = 0.6) s, following the introduction of a power mismatch corresponding to a +50% variation in power, resulting from the operation of a 1.2 MVA unit at a power factor of 0.98. This power mismatch corresponds to a +50% variation in power by disconnecting loads L2–L4 (DG1 and DG2) in the MG network. Figure 3b,c show the voltage decomposition for level 1 (q = 1) and level 2 (q = 2), respectively, for the same operating condition.
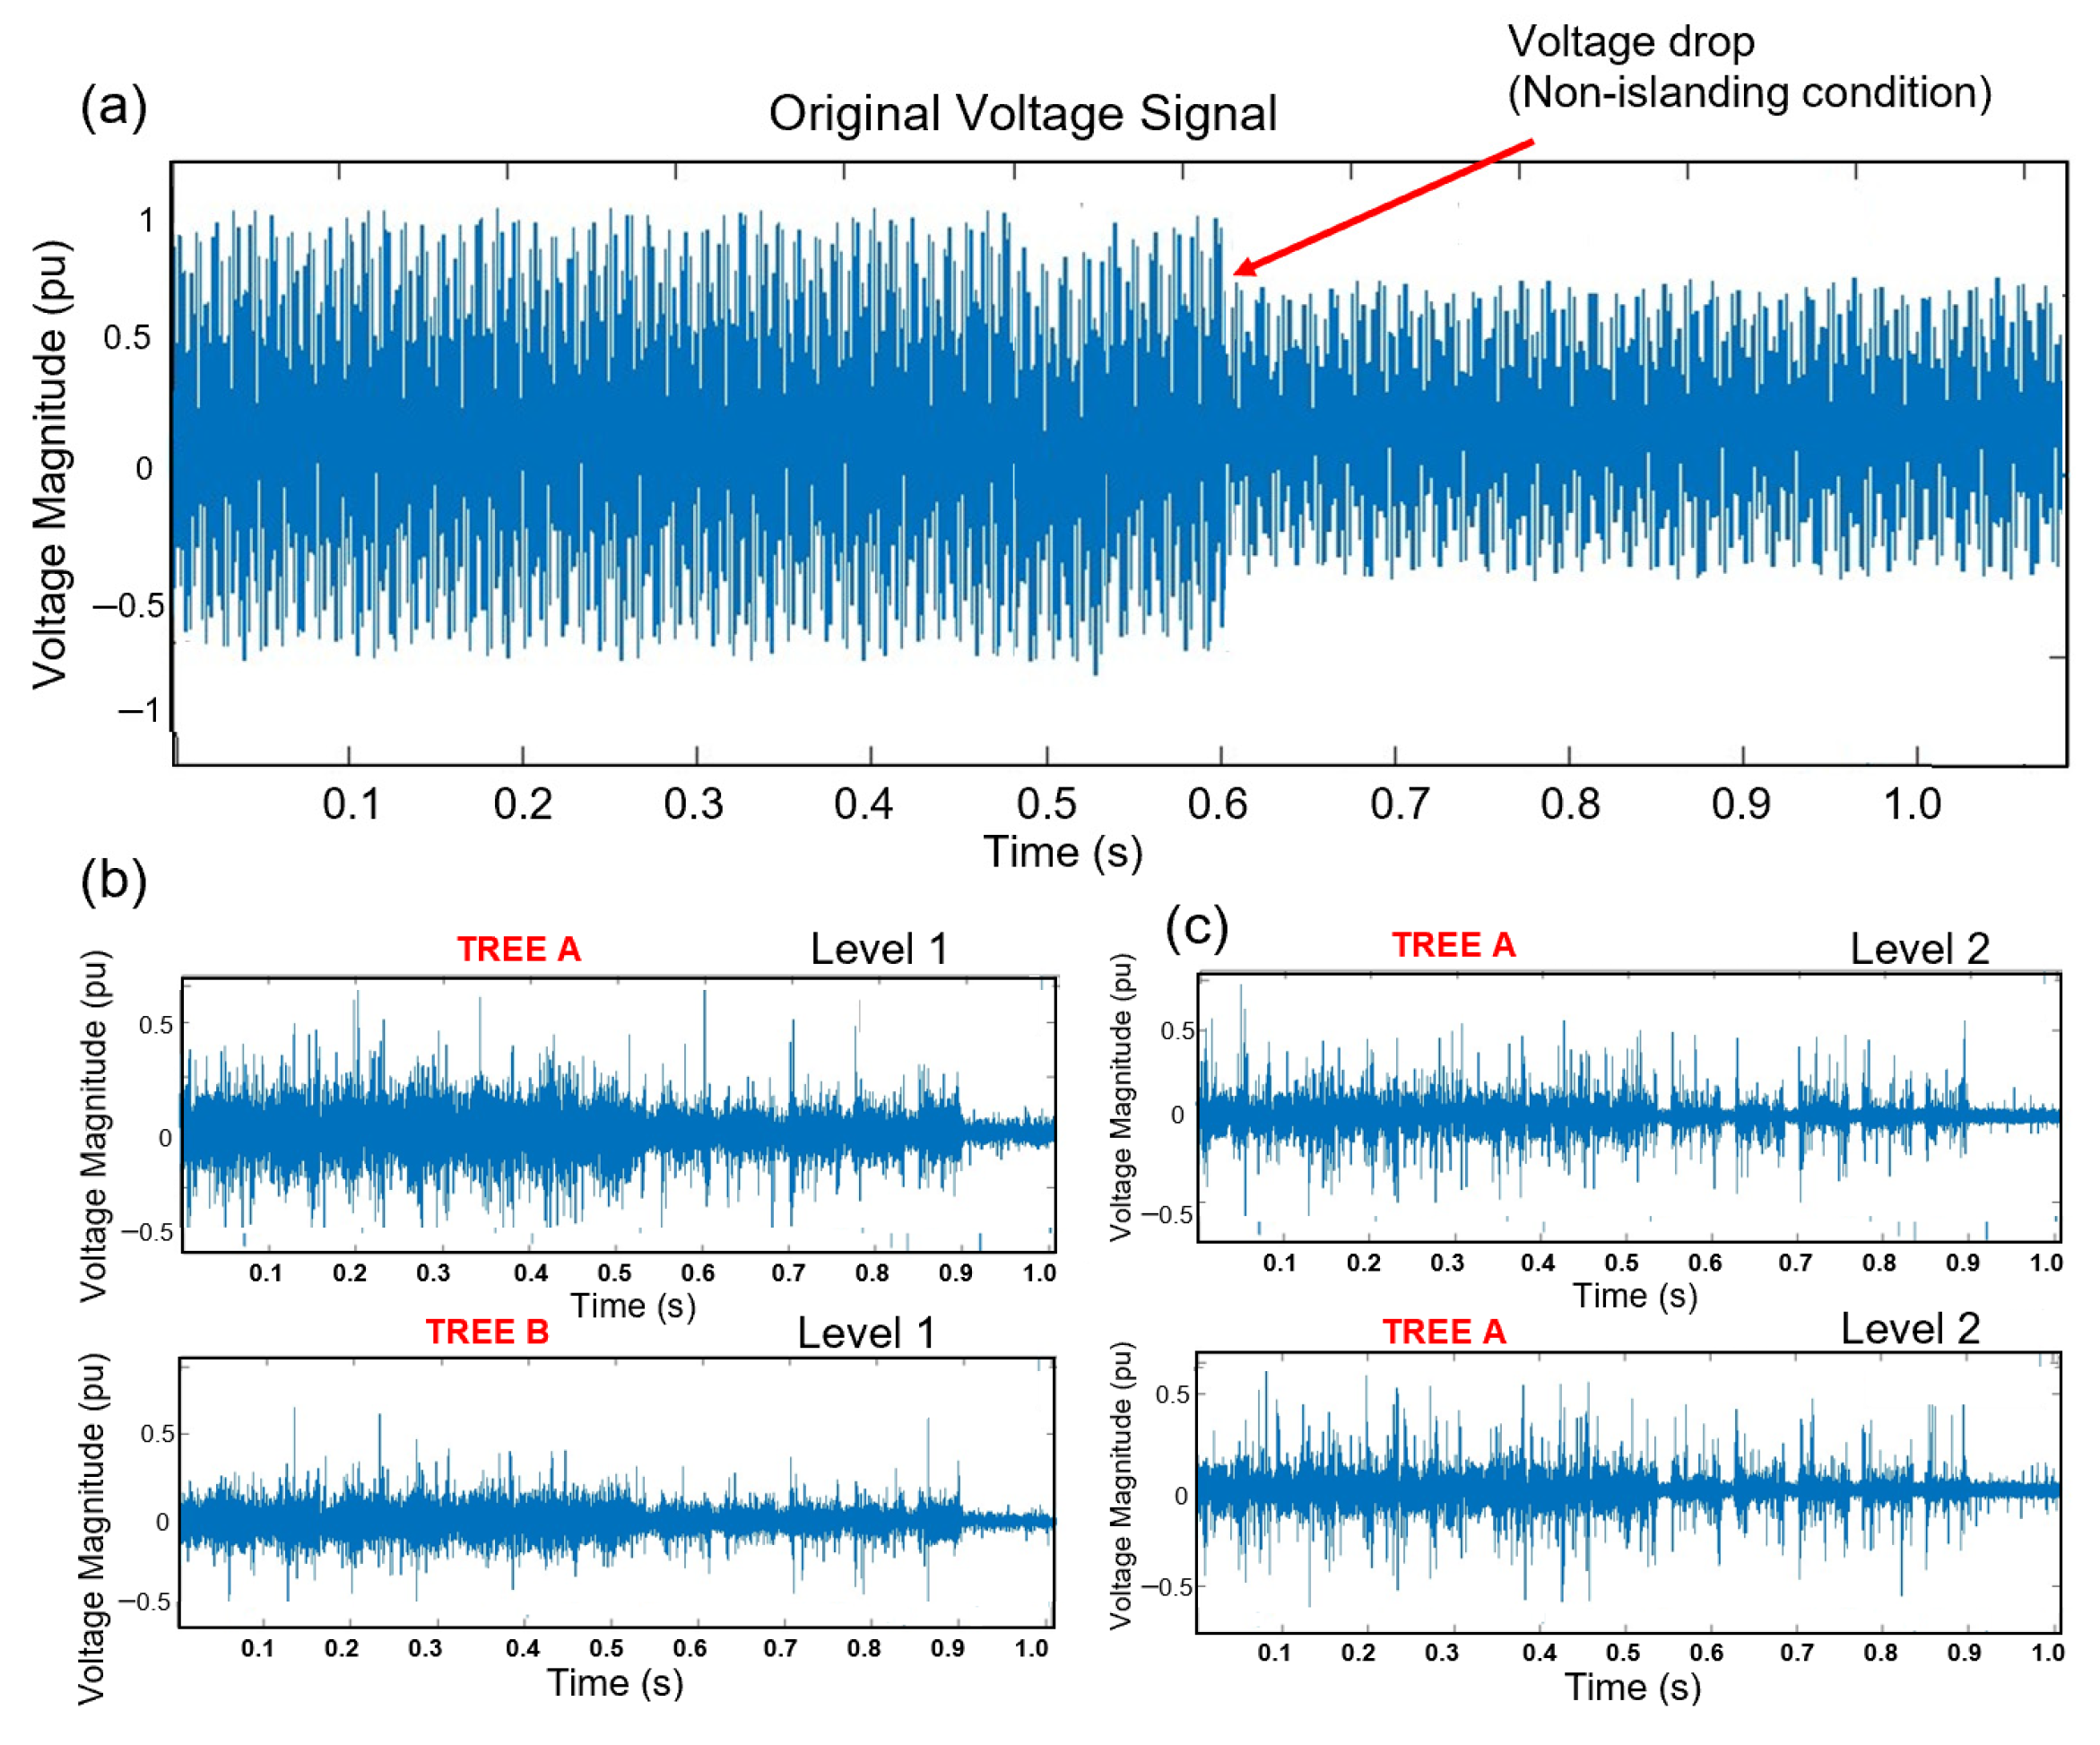
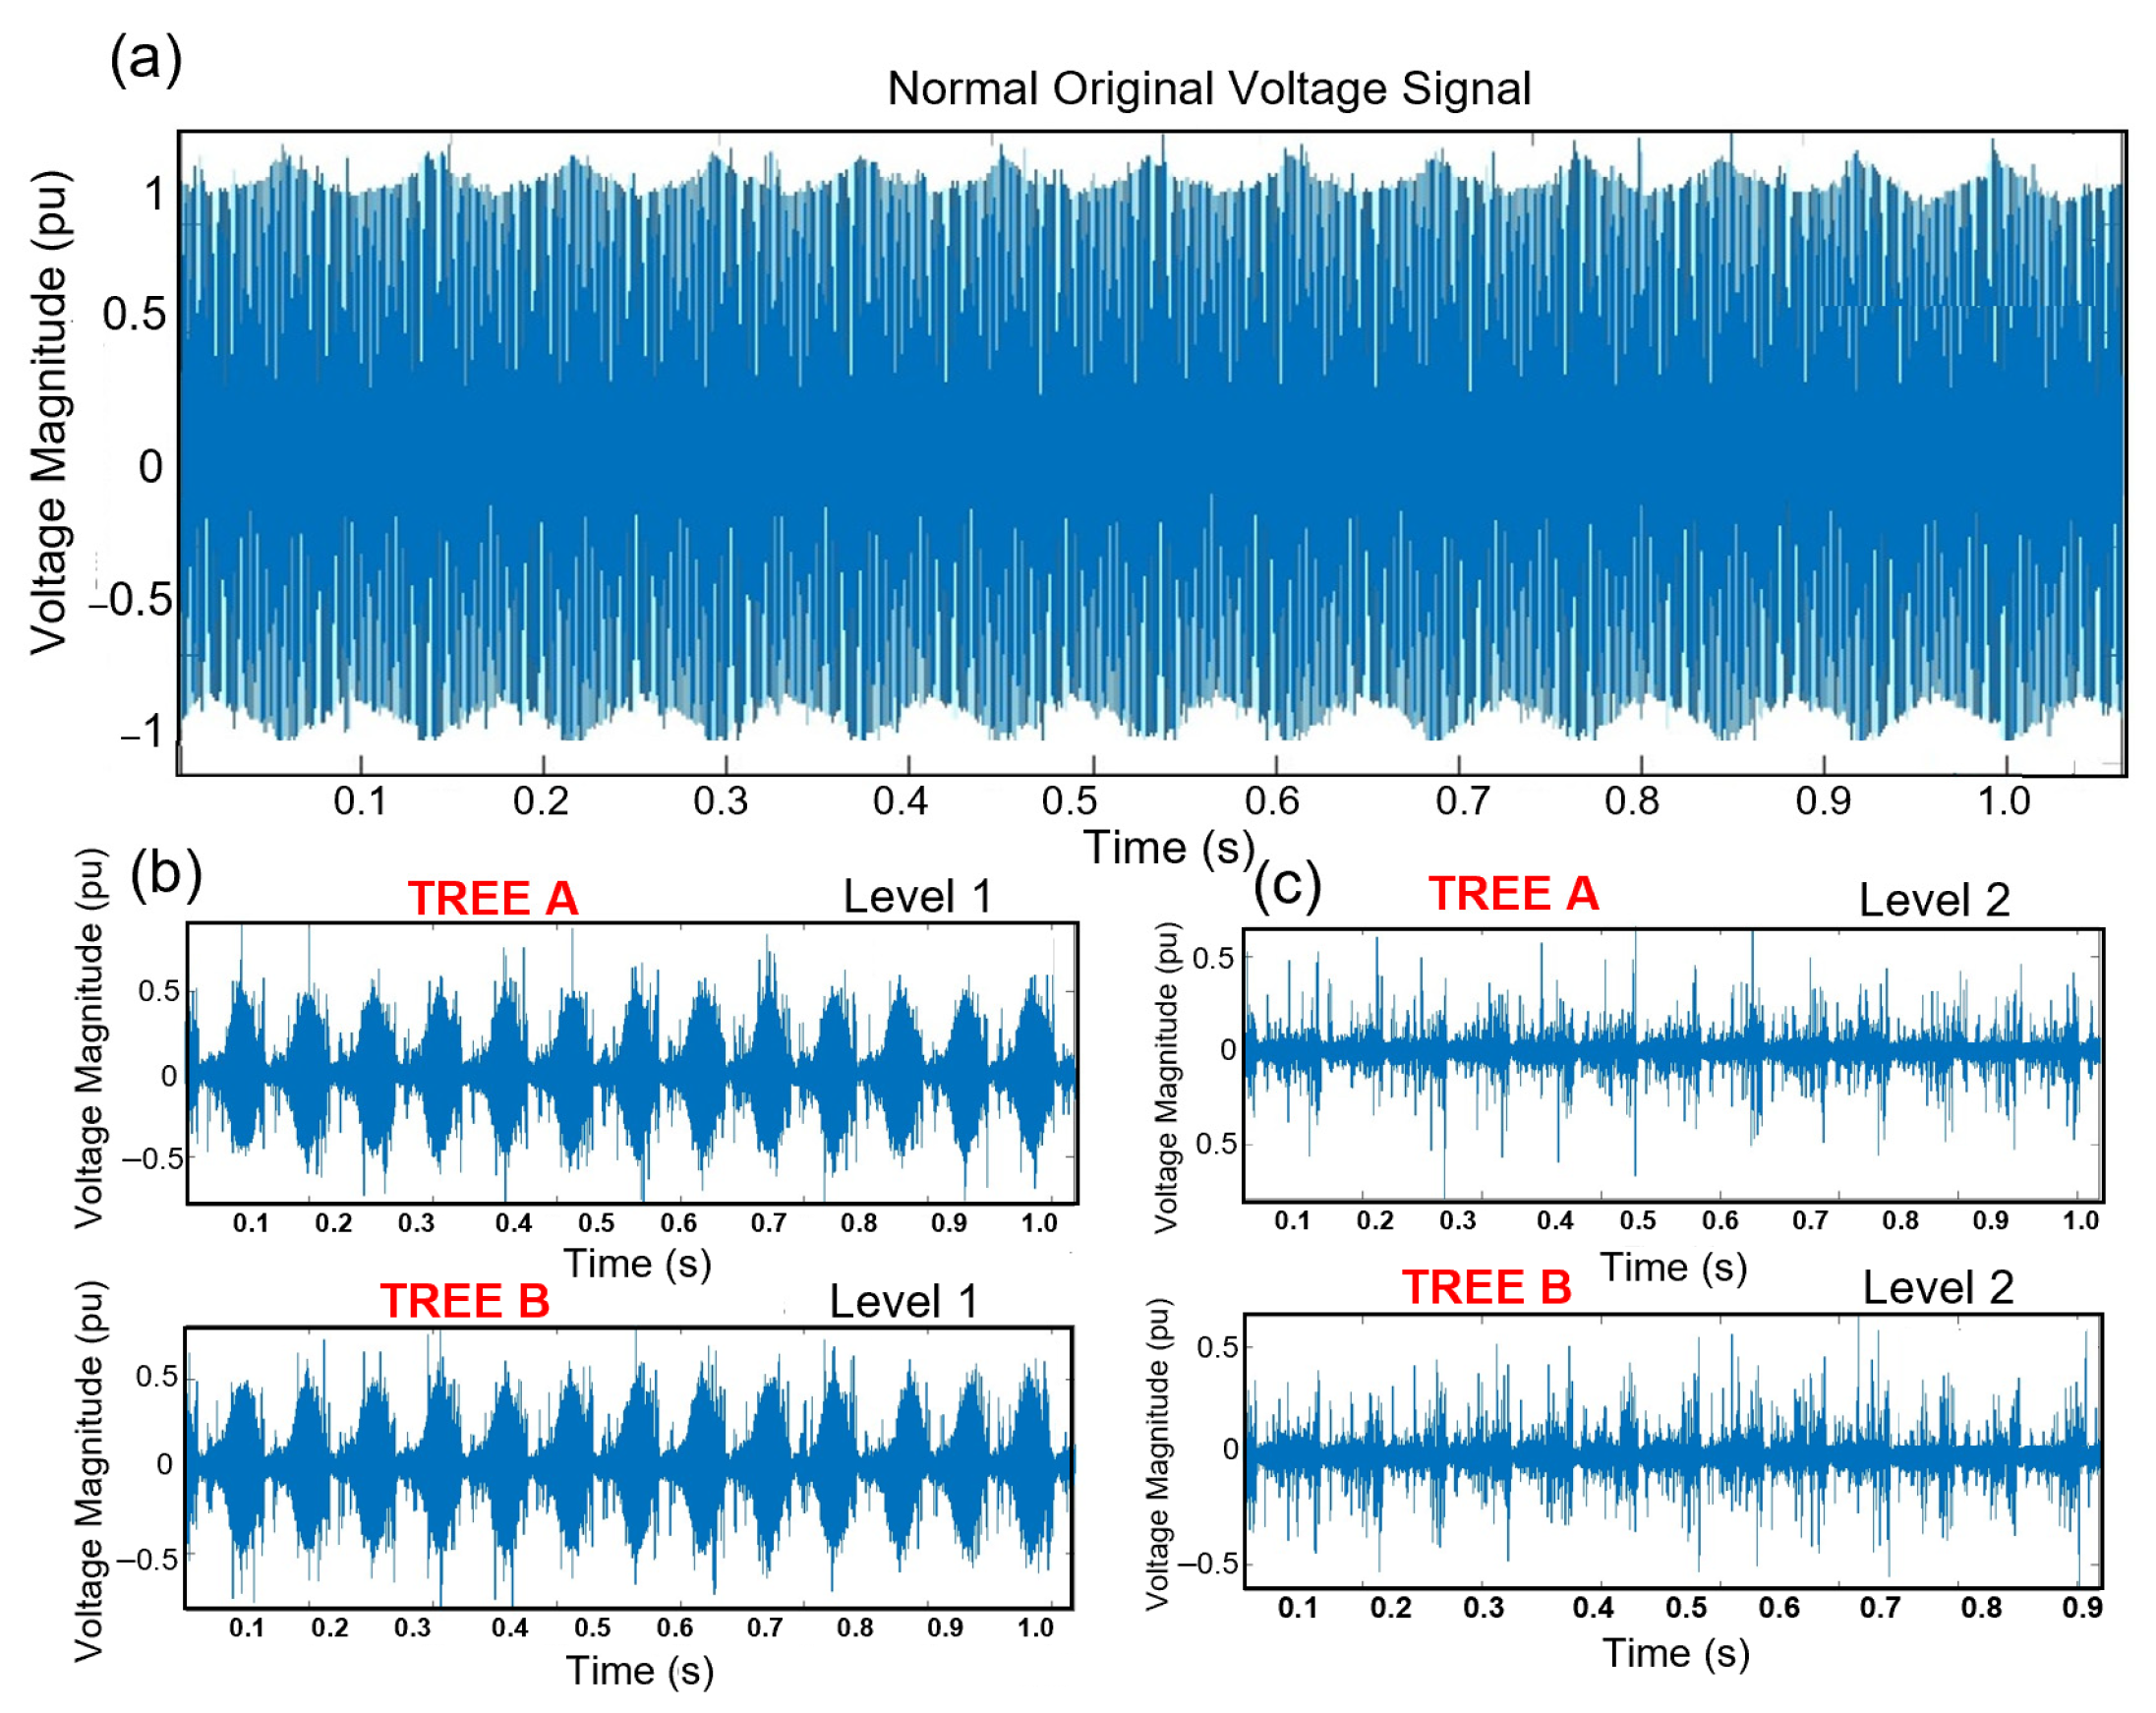
Figure 4a shows the voltage waveform V(n) decomposition at phase A of the PCC bus in MGTS under NIC. An LLG fault is applied to the DG2 terminals at (t = 0.6) s with a fault resistance of 0.1 ohm. The PCC bus voltage decreases to approximately 0.6 pu, remaining within the acceptable voltage threshold range of 50–120%. Figure 4b,c show the voltage decomposition for level 1 (q = 1) and level 2 (q = 2), respectively. Similarly, Figure 5a shows the voltage waveform V ( n ) measured at the PCC bus of MGTS under normal operating conditions. It can be observed that V ( n ) remains within the acceptable limits of 50–120% with the MG connected to the grid. Figure 5b,c show the voltage decomposition at level 1 (q = 1) and level 2 (q = 2), respectively. After the decomposition of the different faults/disturbance under various scenarios and varying resistance conditions, the decomposition of datasets is categorized into IC and NIC datasets. The dataset is the entire collection of data samples and datapoints used for the analysis of the MGTS. Table 2 presents the sample of the extracted detail and approximate coefficients corresponding to each decomposition level of the 3-phase MGTS. They are obtained from each dataset row representing the three-phase signals. Each data sample comprises a minimum of 14,378 and a maximum of 138,015 datapoints. The overall dataset is computed as the product of the number of data samples and the number of datapoints, resulting in the data size that is extracted for each case.

3.2. SMOTE Algorithm for Data Preprocessing

In this study, the extracted dataset exhibits a class imbalance, that is, the ratio of IC and NIC cases is approximately 3:1 (i.e., IC = 219 and NIC = 657 cases). Here the IC cases represent the minority class (having a total of 219 cases), while the NIC cases form the majority class (having 657 cases). By applying SMOTE to the dataset, data imbalance is addressed. Synthetic sample data is applied to the minority class data as obtained in (7) and (8), used for the preprocessing of the dataset [10] given as:
D j j =   | C o +   C l k |
D s y n t h e t i c = C o + ( D j j ×   P u n i f o r m ) ,
where C o   is the minority-class dataset, and C l k represents its kth nearest neighbor. D j j is the sum between C o   and   C j j k . The pre-processed dataset becomes (IC = 385 and NIC = 657) cases. The synthetic data samples produced by the SMOTE algorithm are summarized in Table 3.

3.3. Long Short-Term Memory

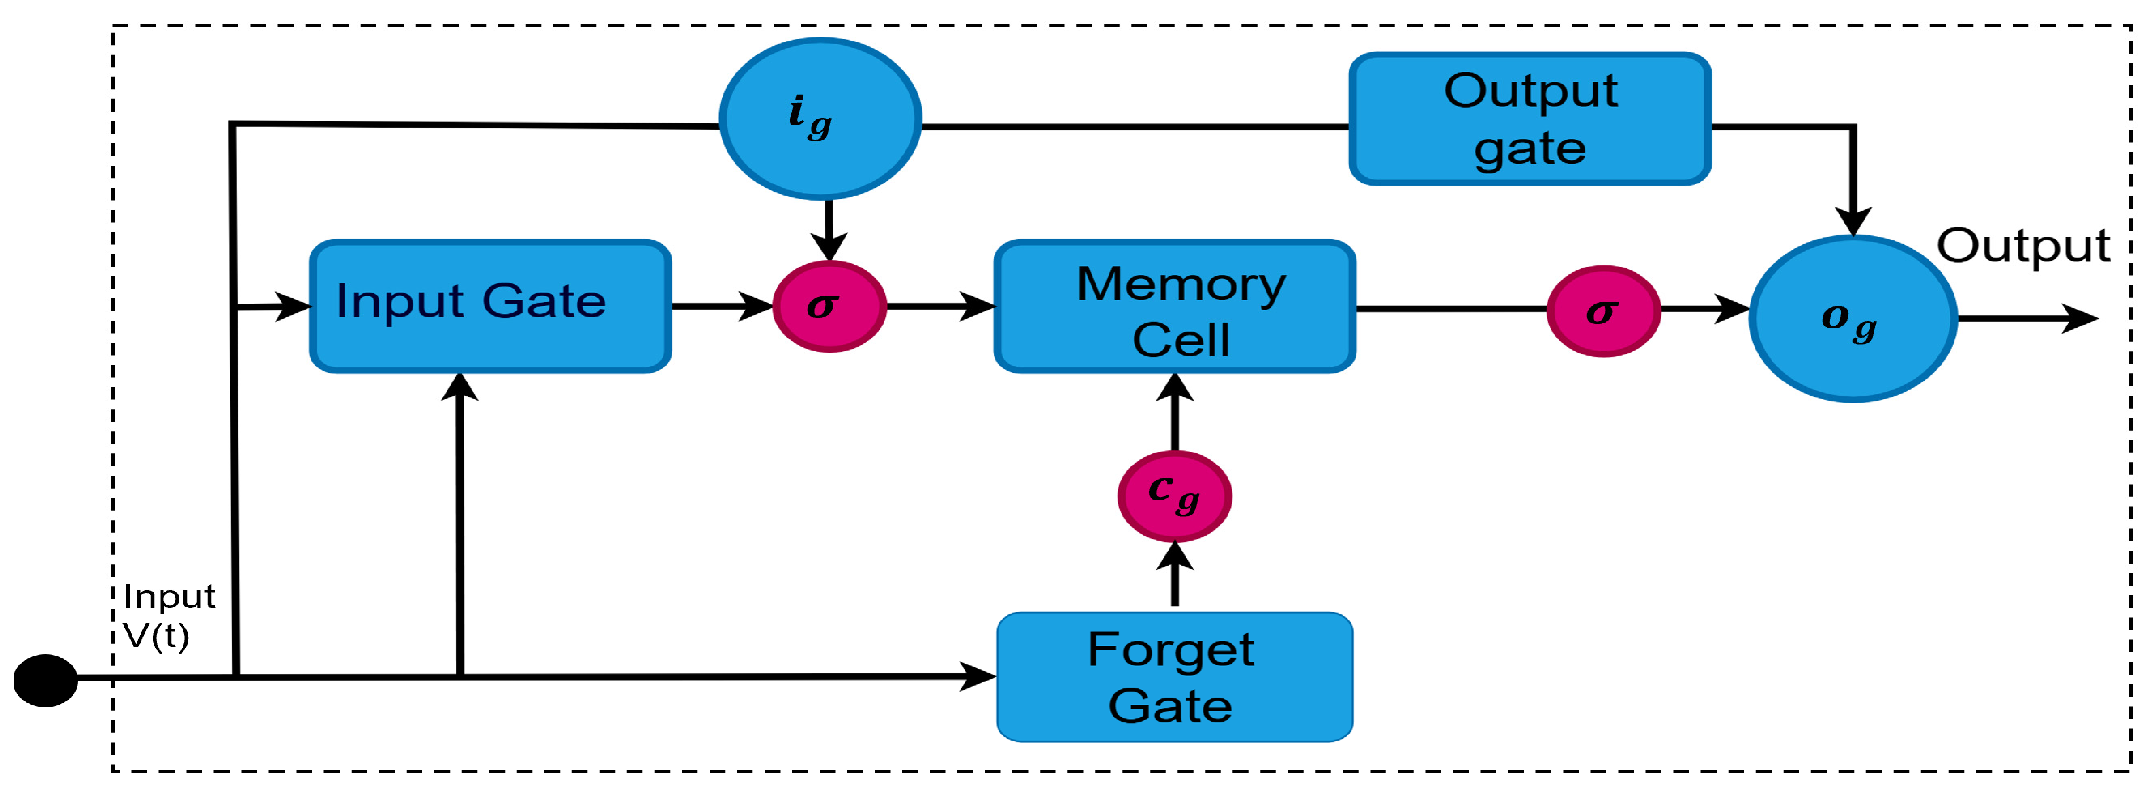
LSTM is employed in this study for robust extraction of temporal features and to track dynamic changes in fault and disturbance signals, to distinguish transient variations necessary for the detection of IC and NIC through training and testing of the model. The fundamental features of an LSTM network include the input gate, forget gate, and output gate, which are mathematically represented in Equations (9)–(11) [11]:
i g =   σ ( W M i x g   +   y i x g 1   + b i )
f g = σ ( W M f x g   +   y f x g 1 + b f )
o g = σ ( W M o x g   +   y o h g 1   +   b o )
where W M i , W M f , and W M o represent the weight matrices, b i , b f , and b o represent the respective bias vectors, i g is the input gate, f g is the forget gate, o g is the output gate, and σ indicates the sigmoid activation function. In LSTM architecture, datasets are fed into the input gate, which regulates the flow of information into the memory cell. The forget gate selectively retains or discards information of the dataset, while the memory cell provides long-term storage and supports model optimization. Finally, the output gate shapes the final output results, enabling accurate detection of faults or disturbances in MG networks. The structure of LSTM is shown in Figure 6.
The performance metrics used to evaluate the proposed scheme are accuracy, precision, and recall, (A, P, and R). Accuracy indicates the overall correctness of the proposed AIDM in distinguishing between IC and NIC, precision measures how correctly the proposed AIDM can detect IC and NIC, and recall checks the classifier overall reliability in detecting IC and NIC. The A, P, and R are calculated from confusion matrix which summarizes the proposed AIDM findings. The matrices are calculated using Equations (12)–(14):
A   ( % )   =   T P + T N   ( T P + F N + F P + T N )
P   ( % )   =   T P   ( T P + F P )
Recall   ( % )   =   T P   ( T P + F N )
where TP and TN are given as the true positive and true negative cases, respectively, and FP. and FN are false negative and false positive, respectively.

The LSTM Trained Model

The pre-processed data is fed into the input gate model for training and classification. The dataset is partitioned into training (70%), validation (15%), and testing (15%) from a total 12,791 data samples. During training, the model error is computed using cross-entropy loss. The model achieved an average accuracy of 100% across three independent runs, demonstrating the robustness of AIDM. Table 4 shows the MGTS parameter used in the simulation. The cross-entropy loss of the model is given by Equation (15) [6]:
L T =   l = 1 N y z l o g y ^ z
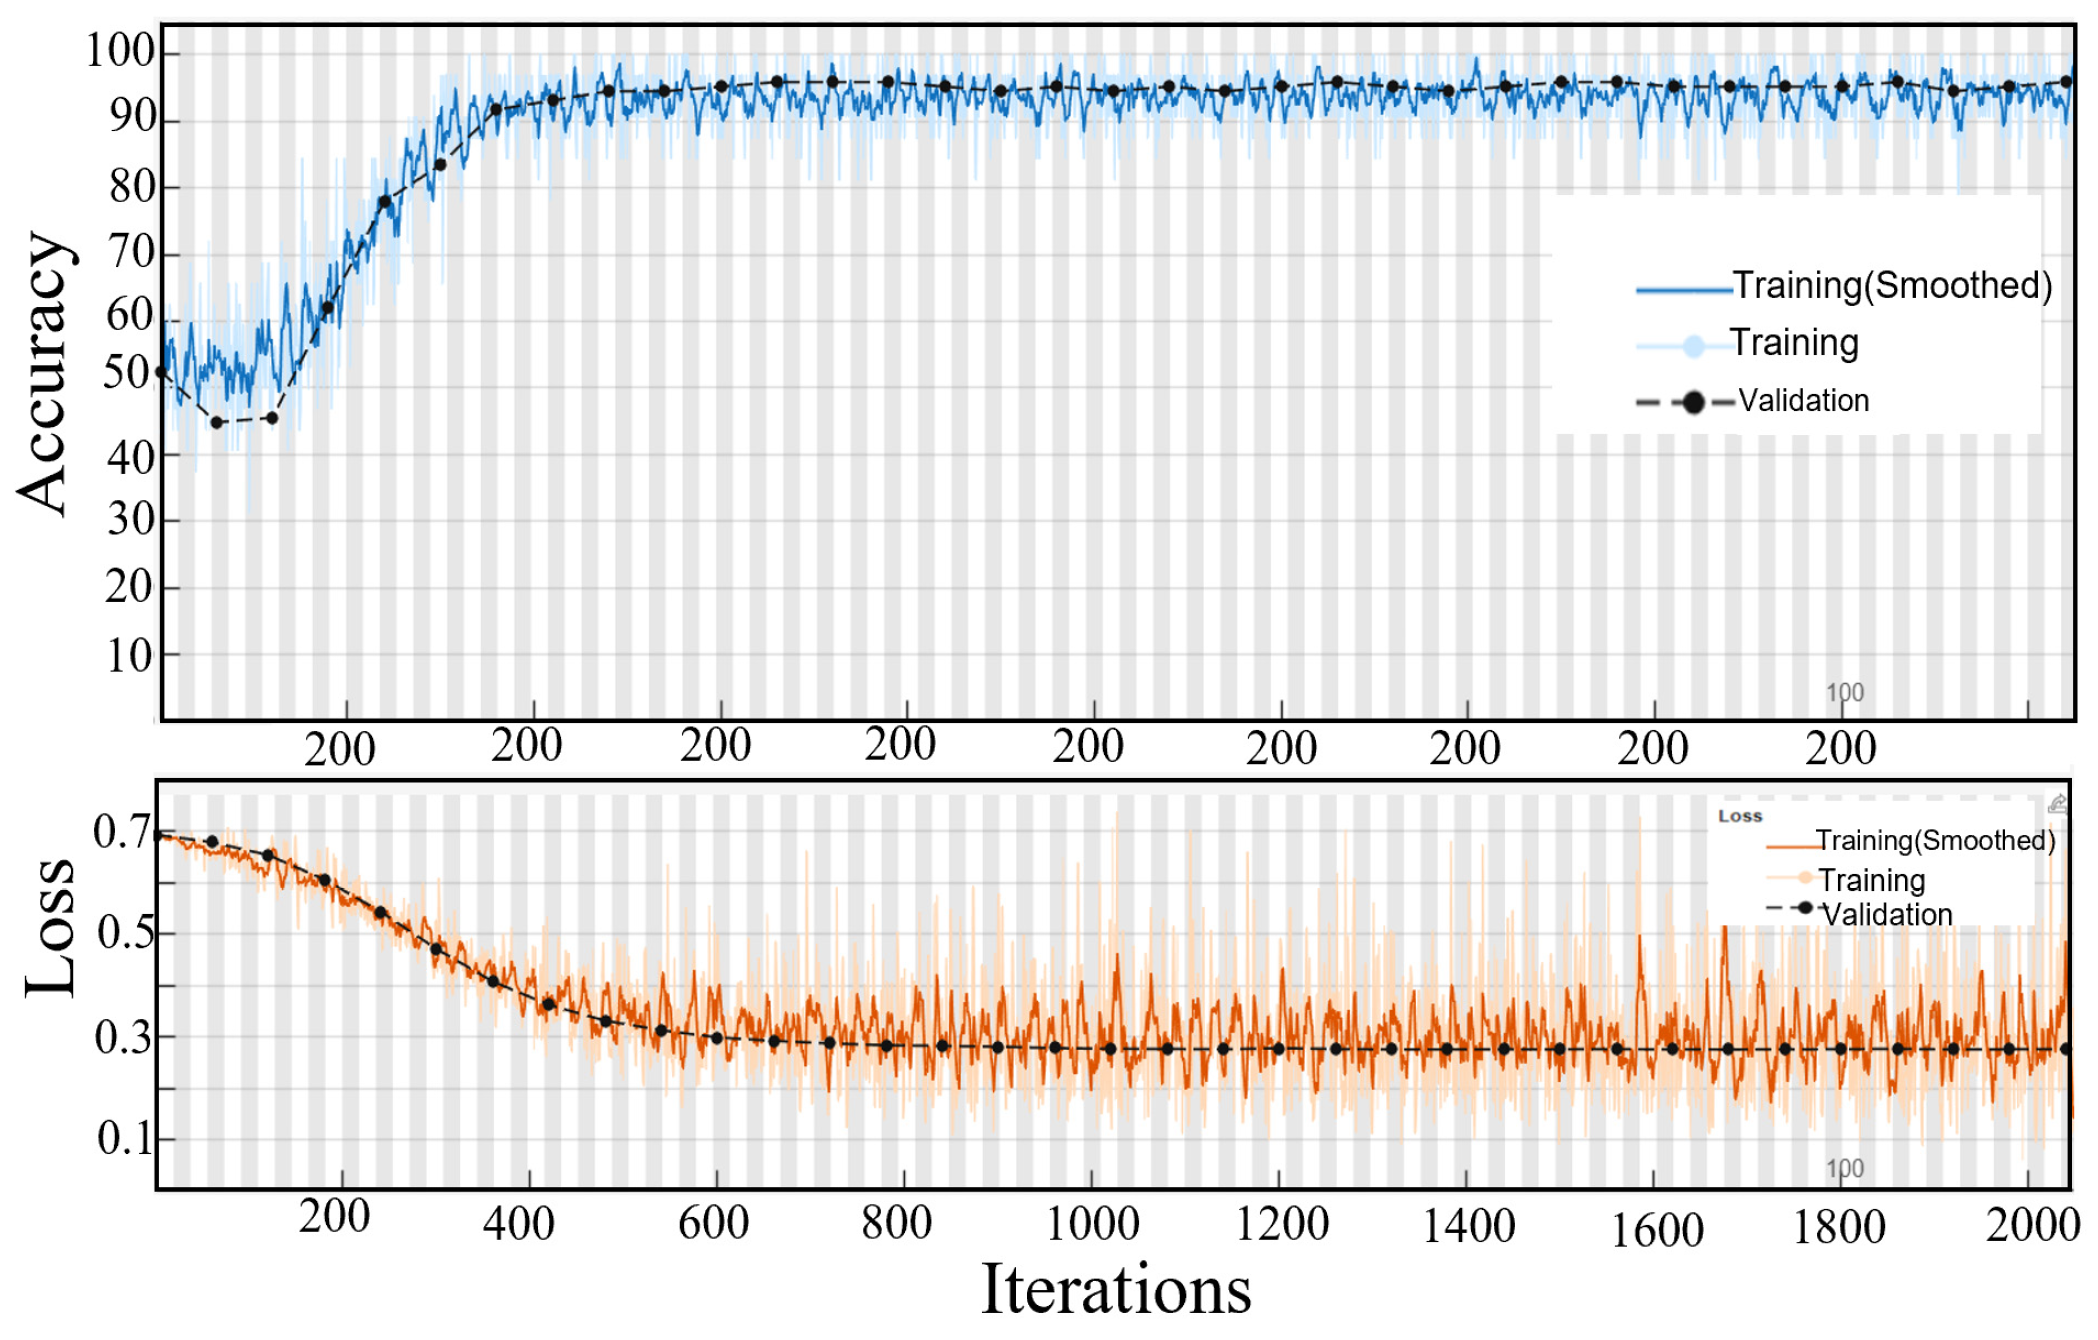
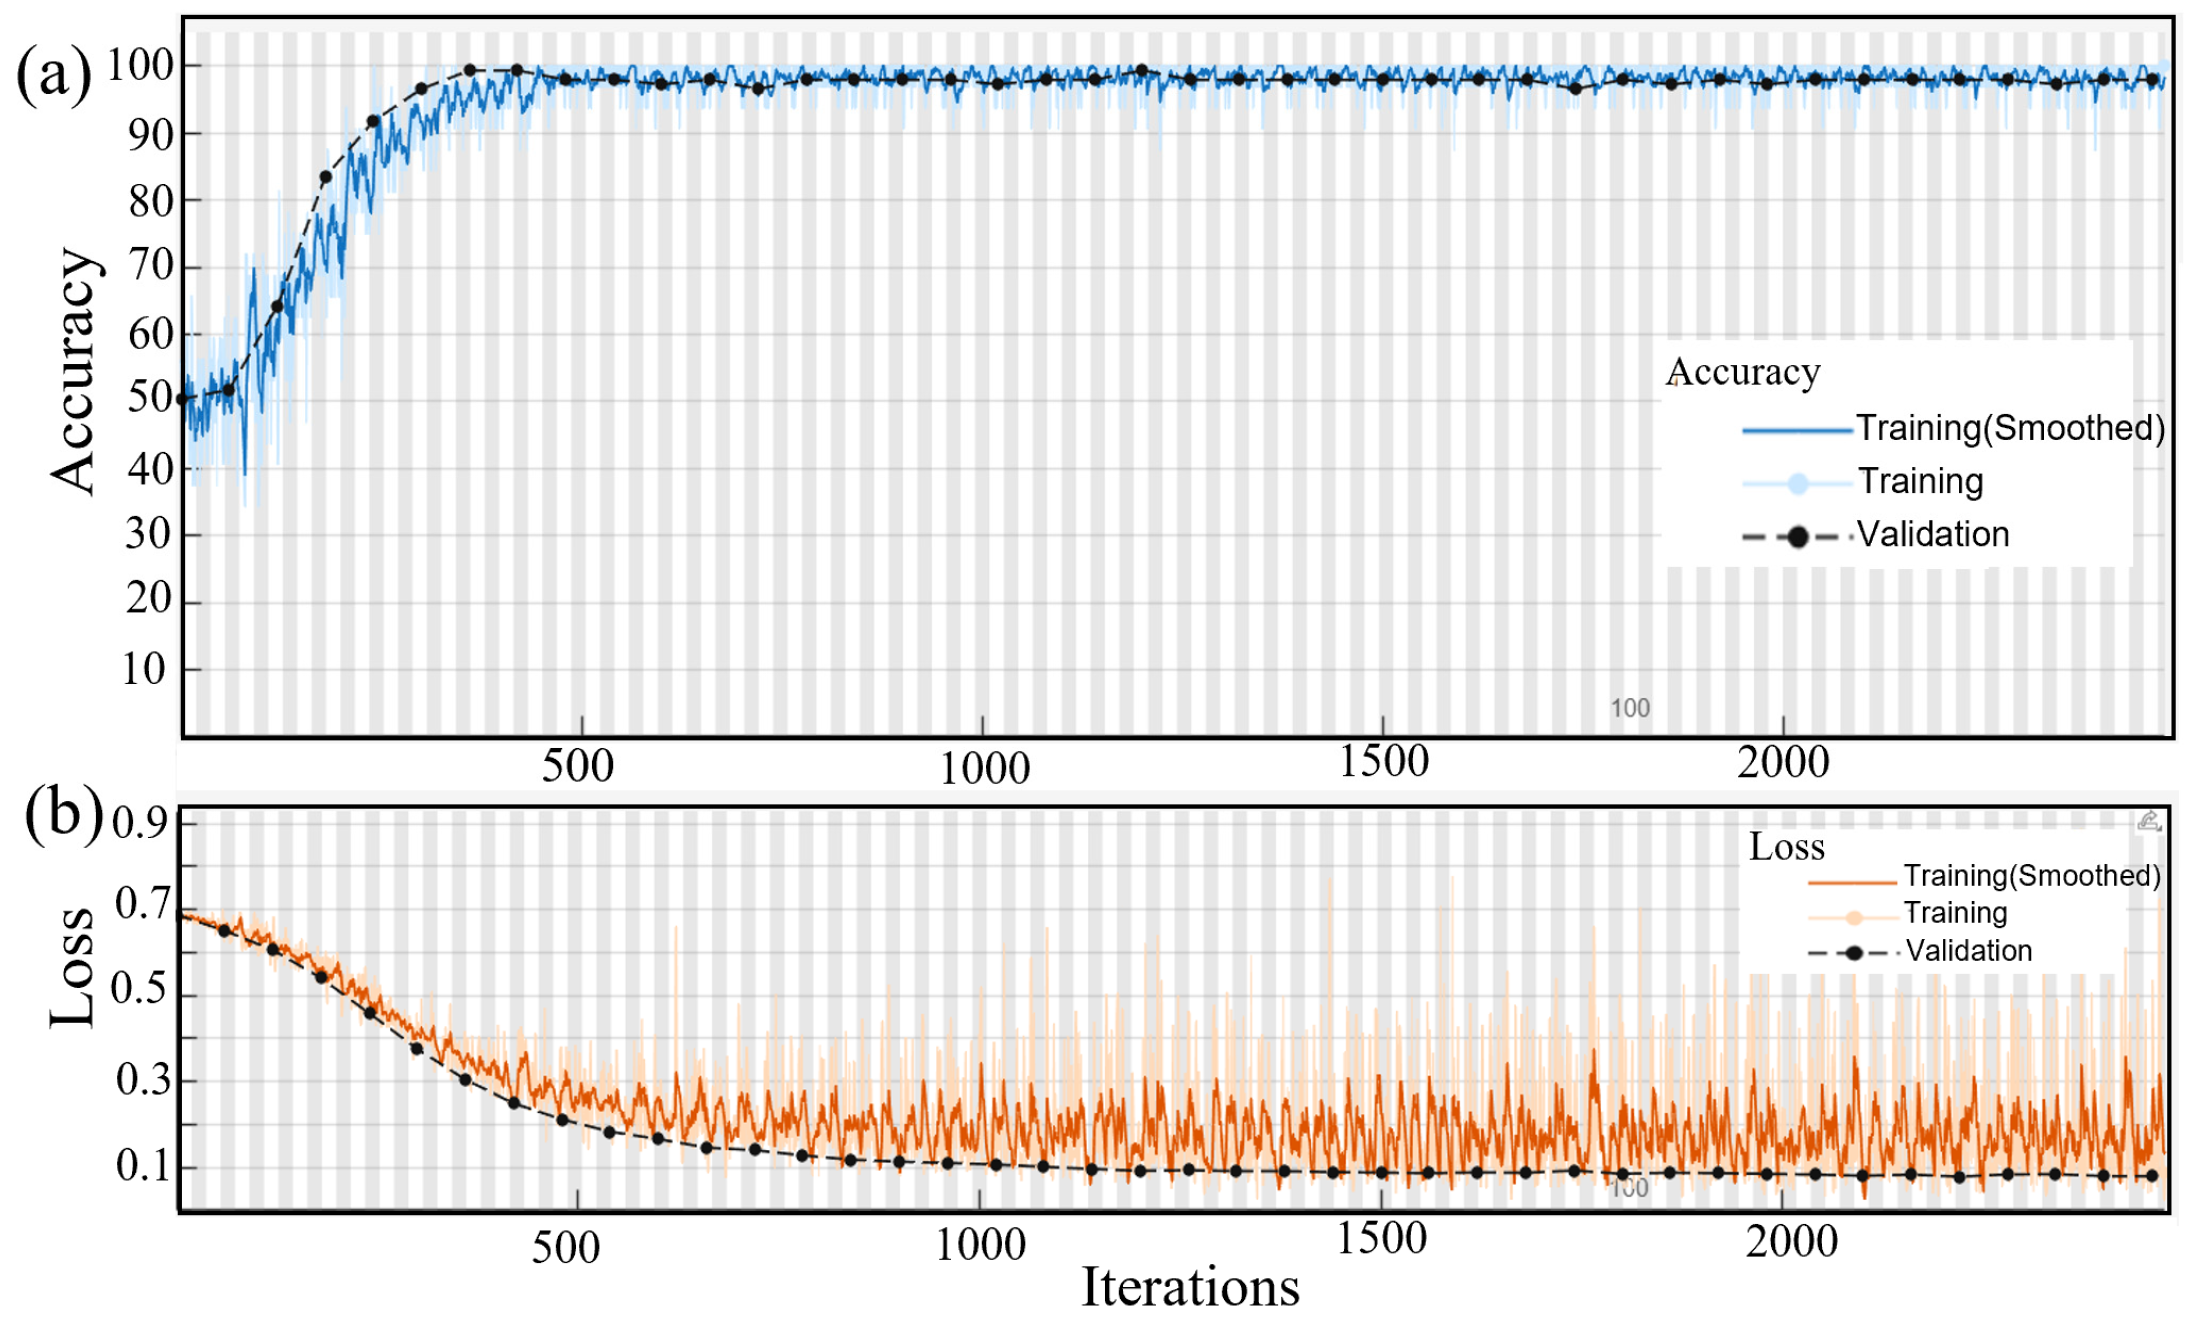
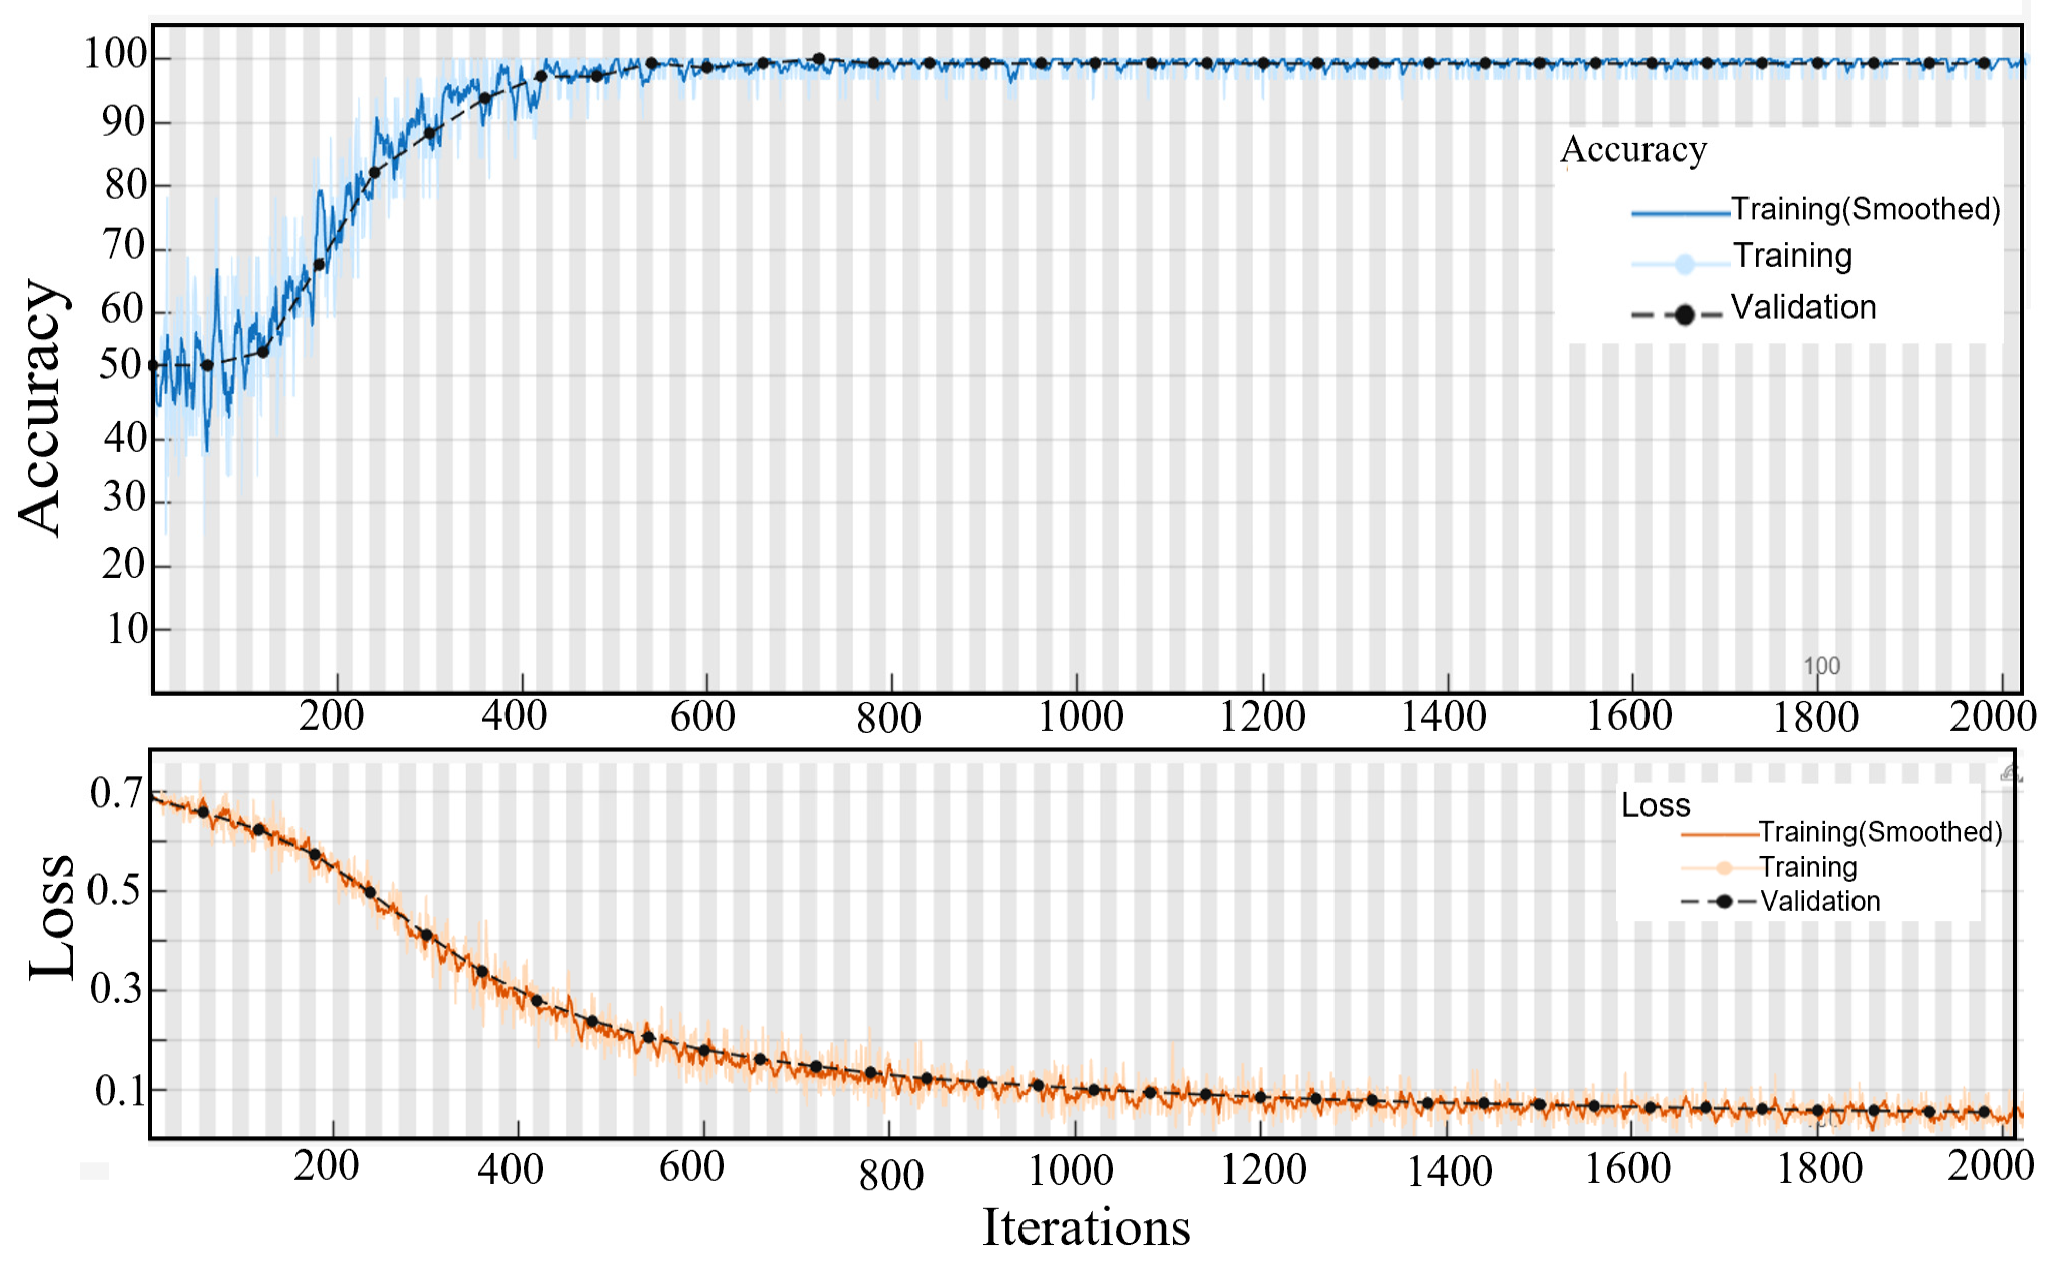
where L T   is the total loss in the classification, y z   is the true class label for sample z, and y ^ z is the predicted class label. In the trained model, the accuracy increased rapidly, reaching 100% as shown in Figure 7a, while the loss decreased to zero, as depicted in Figure 7b.

4. Analysis of Results

This section presents the evaluation of results of the proposed AIDM algorithm for detecting IC and distinguishing IC from NIC in MG with a HESS. For the analysis of the proposed algorithm, two different datasets are used for testing and classification of results to test the proposed AIDM reliability and effectiveness under different MG energy-storage technologies in detecting IC and NIC. The datasets are categorized as (TD1 and TD2). The TD1 dataset consists of data extracted from the MGTS with the HESS having a total of (IC = 299 and NIC 378) cases, and TD2 with (IC = 310 and NIC = 449) cases with (battery only). This dual dataset testing approach is used to analyze the effectiveness of HESS in intelligent IDM. The evaluation is conducted under three cases: (a) sudden load increase (IC), (b) disconnection of DG (NIC), and (3) analysis of the train LSTM model with TD1 and TD2 datasets (NIC). The simulation results for each case are given as follows.

4.1. Case 1: Sudden Load Increase—Power Mismatch (IC)

Here, external loads L9–L12 of MGTS, comprising a mix of capacitive and inductive loads with a combined capacity of 1.224 MW and 0.249 MVAr, are connected across bus 680, 652, 646, and 633 to the MG network. The MG total load increased from 2.4 MW and 1.8 MVAr to 3.62 MW and 2.049 MVAr. This leads to an approximate 51% increase in active power demand, exceeding the threshold limit of 50–120%. The PCC CB1 at bus 632 operates, disconnecting the MG from the utility. The voltage signals are extracted for testing and classification of proposed AIDM algorithm. Also, white Gaussian noise with signal-to-noise ratios (SNR) of 5, 10, and 15 dB are introduced into the network. The performance indices under these noise levels are also analyzed for robust performance of the model. The TD1 and TD2 datasets are used for testing and classification, and the results are presented in Table 5.
Table 5 shows that TD1 has an average A, P, and R of 100%, 99.99%, and 99.94%, while TD2 has an average A, P, and R of 99.77, 99.98%, and 99.33%, respectively. The average A, P, and R of TD1 exceeds TD2 This demonstrates the capability of the proposed AIDM in detecting IC and NIC with HESS. Also, the simulation result with added SNR has an average accuracy of 99.89% for TD1 and 98.25% for TD2. This proposed method shows robustness in distinguishing unwanted signals that may result in false tripping of the CB. MG with HESS boosts intelligent-based IDM performance and improves transient response. Compared to MG with non-HESSs, this leads to a better detection accuracy design for AIDM.

4.2. Case 2: Disconnection of DG (NIC)

The total installed capacity of the DGs in the MGTS is 7.7 MVA. The wind turbine (DG4), with a capacity of 1.2 MVA, is disconnected from the MG network at CB5 bus 680 in the MGTS, and this results in a loss of power of approximately 15.6% of the total power generation capacity. This significant loss induces voltage transients within the network. The resulting voltage signals are captured while the MG remains connected to the utility grid, for the testing and classification of the proposed AIDM algorithm. Additionally, white Gaussian noise with SNR of 10, 15, and 25, dB is introduced into the network to evaluate the robustness of the model. The performance indices of the trained model and result under these noise levels are analyzed with TD1 and TD2 datasets, and the results are presented in Table 6.
The average accuracy and precision for TD1 are 99.96% and 99.98%, while the average accuracy and precision for TD2 are 99.95% and 98.66%, respectively. TD1 has a higher average A and P than TD2. This demonstrates that the TD1 has better detection accuracy in the detection of IC and NIC. It is also observed that the average recall for TD2 (99.96%) is higher than average recall for TD1 (98.35%); this shows that TD2 shows more overall reliability than TD1 under grid-connected mode. Also, with added SNR, TD1 achieved an average accuracy of 98.96%, outperforming TD2, which achieved 96.71%. The results further demonstrate that the proposed method effectively detects IC and NIC and distinguishes unwanted signals that could otherwise lead to false CB tripping.

4.3. Case 3: Analysis of the Trained LSTM Model with TD1 and TD2 Datasets

Figure 8 presents the test results of the LSTM model with the TD1 dataset. The model demonstrates accuracy increasing from approximately 50% to 98–100% within the initial 500–600 training iterations. The validation accuracy closely tracks the training accuracy. The loss curve exhibits a steady decline from around 0.7 to 0.18 with minimal fluctuations. These results confirm the robust performance of the AIDM in detecting IC and NIC. Similarly, Figure 9 illustrates the LSTM model performance of the TD2 dataset. The model also achieves rapid accuracy improvement, reaching approximately 97–98% after about 600 iterations. However, the loss curve for TD2 shows more oscillations, ranging between 0.18 and 0.32. Despite these fluctuations, the trained model maintains strong detection capability for both IC and NIC. Comparative analysis indicates that the TD1 dataset, particularly when combined with HESS, provides more robust and stable detection performance for IC and NIC.

5. Conclusions

The design of the AIDM algorithm for the detection of IC and NIC in MG with HESS is presented in this study. The AIDM uses the combination of DTCWT for feature extraction of voltage signals; the SMOTE is applied for preprocessing imbalanced datasets; and LSTM for training, testing, and classification of the proposed algorithm. The proposed algorithm is simulated using two sets of data, T D 1 and T D 2 , for testing the proposed AIDM and subjected to different levels of SNR. The results obtained from MATLAB/Simulink show the effectiveness of the proposed AIDM algorithm for detecting IC and for being able to distinguish between IC and NIC. The key findings show that T D 1 (dataset with HESS) shows higher accuracy and precision than T D 2 (dataset with only battery). Also, a comparative analysis of the accuracy and loss curves demonstrates that the T D 1 dataset exhibits strong robustness in detecting IC and NIC. The following are recommended for future research: the use of data derived from real-world MG networks and incorporating hardware-based simulation platforms. These approaches will yield more comprehensive and practical insights into the performance and reliability of the use of HESS in MG networks. In conclusion, the application of HESS in MG networks, with advanced intelligent IDM, significantly improves the reliability and accuracy of detecting IC and NIC.

Author Contributions

Conceptualization, E.I. and S.C.; methodology, E.I.; software, E.I. and S.C.; validation, E.I.; formal analysis, E.I.; investigation, E.I.; resources, E.I. and S.C.; data curation, E.I.; writing—original draft preparation, E.I.; writing—review and editing E.I. and S.C.; visualization, E.I.; supervision, S.C.; project administration, S.C.; funding acquisition, S.C. All authors have read and agreed to the published version of the manuscript.

Funding

This research was funded by National Research Foundation of South Africa (Grant Numbers: 150523).

Institutional Review Board Statement

The study was approved by the Ethics in Research Committee of the Faculty of Engineering and the Built Environment of UNIVERSITY OF CAPE TOWN (date of approval—10 March 2022).

Informed Consent Statement

Not applicable.

Data Availability Statement

The raw data supporting the conclusions of this article will be made available by the authors on request.

Acknowledgments

The authors gratefully acknowledge National Research Foundation and Sasol, South Africa for funding this research and Electrical Engineering Department, University of Cape Town, South Africa for providing the infrastructure for this research.

Conflicts of Interest

The authors declare no conflicts of interest.

Abbreviations

AIArtificial intelligence
AIDMAdaptive islanding detection method
CWComplex wavelet
DGDistributed Generator
DTCWTDual-Tree Complex Wavelet Transform
HESSHybrid energy storage system
IDMIslanding detection method
DTCWTDual-Tree Complex Wavelet Transform
IDMIslanding detection method
ICIslanding condition
LSTMLong short-term memory
MGMicrogrid
MGTSMicrogrid test system
NICNon-islanding condition
NDZNon-detection zone
PCCPoint of common coupling
SMOTESynthetic minority oversampling technique

References

  1. Yu, J.J.Q.; Hou, Y.; Lam, A.Y.S.; Li, V.O.K. Intelligent Fault Detection Scheme for Microgrids With Wavelet-Based Deep Neural Networks. IEEE Trans. Smart Grid 2019, 10, 1694–1703. [Google Scholar] [CrossRef]
  2. Kermany, S.D.; Joorabian, M.; Deilami, S.; Masoum, M.A.S. Hybrid Islanding Detection in Microgrid With Multiple Connection Points to Smart Grids Using Fuzzy-Neural Network. IEEE Trans. Power Syst. 2017, 32, 2640–2651. [Google Scholar] [CrossRef]
  3. Hussain, A.; Kim, C.H.; Mehdi, A. A Comprehensive Review of Intelligent Islanding Schemes and Feature Selection Techniques for Distributed Generation System. IEEE Access 2021, 9, 146603–146624. [Google Scholar] [CrossRef]
  4. Kim, H.; Lim, Y. A Communication Framework in Multiagent System for Islanded Microgrid. Int. J. Distrib. Sens. Netw. 2012, 2012, 382316. [Google Scholar] [CrossRef]
  5. Dutta, S.; Sadhu, P.K.; Reddy, M.; Mohanta, D. Shifting of Research Trends in Islanding Detection Method—A Comprehensive Survey. Prot. Control Mod. Power Syst. 2018, 3, 1. [Google Scholar] [CrossRef]
  6. Abdelsalam, A.A.; Salem, A.A.; Oda, E.S.; Eldesouky, A.A. Islanding Detection of Microgrid Incorporating Inverter Based DGs Using Long Short-Term Memory Network. IEEE Access 2020, 8, 106471–106486. [Google Scholar] [CrossRef]
  7. El-Arroudi, K.; Joos, G.; Kamwa, I.; McGillis, D.T. Intelligent-Based Approach to Islanding Detection in Distributed Generation. IEEE Trans. Power Deliv. 2007, 22, 828–835. [Google Scholar] [CrossRef]
  8. Igbineweka, E.; Chowdhury, S. Application of Dual-Tree Complex Wavelet Transform in Islanding Detection for a Hybrid AC/DC Microgrid with Multiple Distributed Generators. Energies 2024, 17, 5133. [Google Scholar] [CrossRef]
  9. Selesnick, I.W.; Baraniuk, R.G.; Kingsbury, N.C. The dual-tree complex wavelet transform. IEEE Signal Process. Mag. 2005, 22, 123–151. [Google Scholar] [CrossRef]
  10. Mishra, M.; Patnaik, B.; Bansal, R.C.; Naidoo, R.; Naik, B.; Nayak, J. DTCDWT-SMOTE-XGBoost-Based Islanding Detection for Distributed Generation Systems: An Approach of Class-Imbalanced Issue. IEEE Syst. J. 2022, 16, 2008–2019. [Google Scholar] [CrossRef]
  11. Bukhari, S.B.A.; Mehmood, K.K.; Wadood, A.; Park, H. Intelligent Islanding Detection of Microgrids Using Long Short-Term Memory Networks. Energies 2021, 14, 5762. [Google Scholar] [CrossRef]
Figure 1. The proposed methodology steps for AIDM.
Engproc 140 00034 g001
Figure 2. Microgrid test system [8].
Engproc 140 00034 g002
Figure 3. DTCWT decomposition of power variation at DG2 for the MGTS (IC): (a) voltage decomposition, (b) level 1 voltage decomposition with Tree A and Tree B, (c) level 2 voltage decomposition with Tree A and Tree B.
Engproc 140 00034 g003
Figure 4. DTCWT decomposition of fault at DG2, operation for MGTS (NIC): (a) voltage signal, (b) level 1 voltage decomposition Tree A and B, (c) level 2 decomposition of voltage for Tree A and B.
Engproc 140 00034 g004
Figure 5. DTCWT decomposition for normal operation for the MGST: (a) voltage signal, (b) level 1 decomposition of voltage for Tree A and B, (c) level 2 voltage decomposition for Tree A and B.
Engproc 140 00034 g005
Figure 6. The LSTM architecture [11].
Engproc 140 00034 g006
Figure 7. The LSTM trained model (a) accuracy versus iterations, (b) Loss versus iterations.
Engproc 140 00034 g007
Figure 8. The LSTM trained model for T D 1   dataset.
Engproc 140 00034 g008
Figure 9. The LSTM trained model for T D 2   dataset.
Engproc 140 00034 g009
Table 1. Events representing IC and NIC cases.
Extraction CriteriaDG Number(s)/Fault TypesPower Variation/FaultNo. of CasesTotal IC and NIC Cases1
IC casesDG1-DG4±50% Power variation
at L1–L4
70219 cases
DG1 and DG2±50% Power variation
at L4 and L5
80
DG2 and DG4±50% Power variation
at L6 & L7
69
NIC casesExternal fault,
LG, LLG,
LLLG, and
normal operation
Fault resistance from
0.1 to 100 ohms discrete
steps of 0.5 ohms for
(External fault, LG & LLG)
245
271
141
657 cases
Table 2. Data samples for power variation for DG1 in IC cases.
Detail CoefficientsApproximate Coefficients
Sl. No.Phase APhase BPhase CPhase APhase BPhase C
1−2.70 × 10⁻¹²−3.11 × 10⁻¹¹−5.16 × 10−103.70 × 10−102.22 × 10−093.58 × 10−06
2−2.74 × 10⁻¹²−3.16 × 10⁻¹¹−3.60 × 10−103.70 × 10−102.16 × 10−09−1.09 × 10−06
3−2.79 × 10⁻¹²−3.21 × 10⁻¹¹−3.66 × 10−103.70 × 10−102.17 × 10−092.52 × 10−06
4−2.84 × 10⁻¹²−3.26 × 10⁻¹¹−3.71 × 10−103.70 × 10−102.17 × 10−09−3.81 × 10−07
5−2.88 × 10⁻¹²−3.32 × 10⁻¹¹−3.77 × 10−103.70 × 10−102.17 × 10−094.86 × 10⁻¹²
Table 3. Samples of pre-processed data after SMOTE application.
Samples of Pre-Processed Data for Power Variation for DG1 in IC Cases
Sl. No.Phase APhase BPhase C
1−5.01 × 10−60.0146570.733008
2−3.96 × 10−50.0199840.706829
32.57 × 10⁻⁶−3.20 × 10−50.693231
42.20 × 10−70.0001280.012813
5−3.87 × 10−78.00 × 10−50.005660
Table 4. MGTS parameters corresponding to Figure 2.
S.I UnitGridTransformers
TR1–TR5
DG1.
(Super
Capacitor)
DG2.
(Solar PV)
DG3
(Battery)
DG4.
(Wind
Turbine)
P(MVA)1000 51.53.51.21.5
V(volts)79,00011/4.16 kV5751300400575
F (Hz)505050505050
Load (MW & MVAr)L1 (100 MW 111 MVAr) L2–L8 2.4MW 1.8MVAr
Table 5. Performance analysis and accuracy results of noise signal of AIDM for T D 1 and T D 2 datasets (Case 1).
Data SchemeS.I NoA (%)P (%)R (%)SNR
Level (dB)
Accuracy (%)
TD1110099.9899.95599.97
TD121001001001099.95
TD131001001001599.76
TD1Average10099.9999.94%Average99.89%
TD2110010098.70599.95
TD2299.9599.9699.971098.90
TD2399.971001001595.90
TD2Average99.7799.9899.33Average98.25%
Table 6. Performance analysis and accuracy results of noise signal of AIDM for T D 1 and T D 2 datasets (Case 2).
Data SchemeS.I NoA (%)P (%)R (%)SNR
Level (dB)
Accuracy
TD111001001001099.70
TD1299.9010095.951597.50
TD1310010099.102599.70
TD1Average99.9699.9898.35Average98.96
TD2199.9999.501001098.70
TD2299.9899.501001595.50
TD2399.9010099.902595.95
TD2Average99.9598.6699.96Average96.71
Disclaimer/Publisher’s Note: The statements, opinions and data contained in all publications are solely those of the individual author(s) and contributor(s) and not of MDPI and/or the editor(s). MDPI and/or the editor(s) disclaim responsibility for any injury to people or property resulting from any ideas, methods, instructions or products referred to in the content.