Proceeding Paper

Analysis of Power System Stability Indices Concerning High Penetration of Renewable Energies †

Faculty of Electrical Engineering, University of Sciences and Technology Houari Boumediene, Algiers 16111, Algeria
*
Author to whom correspondence should be addressed.
Presented at the 1st International Online Conference on Designs (Designs 2026), 9–10 February 2026; Available online: https://sciforum.net/event/Designs2026.
Eng. Proc. 2026, 138(1), 10; https://doi.org/10.3390/engproc2026138010
Published: 1 June 2026
(This article belongs to the Proceedings of The 1st International Online Conference on Designs)

Abstract

Currently, the large-scale integration of renewable energy sources (RESs), such as wind turbines and photovoltaic array, is profoundly altering the dynamic behavior of power systems. In particular, the reduction in system inertia makes transient stability more critical and increases the sensitivity of the network to disturbances. The originality of this work lies in the systematic analysis of the nonlinear dynamics of power systems by thoroughly examining the impact of RESintegration on system stability, particularly through frequency response and voltage profile. In this context, a methodology for the evaluation and optimization of power system stability was proposed, based on two key indicators: the Critical Clearing Time (CCT) and the Rate of Change of Frequency (RoCoF). The IEEE 39-bus test system was used as a benchmark to simulate different scenarios. Three-phase faults are applied to determine the corresponding CCT values and to assess the system’s ability to regain a stable operating state after a severe disturbance. In addition, RoCoF variations are analyzed to quantify the impact of RES penetration on the frequency stability of the network. The obtained results show that a high penetration of renewable energy sources tends to reduce the CCT and increase the RoCoF, indicating a reduction in the dynamic robustness of the system. These observations are confirmed through comparative simulations performed with and without renewable energy integration. In conclusion, this study highlights the importance of optimal placement of renewable generation units, as well as the use of the CCT and RoCoF indices as effective diagnostic and optimization tools for modern power systems characterized by a high penetration of renewable energy sources.

1. Introduction

The rapid growth in global electricity demand, combined with increasing environmental concerns, has accelerated the large-scale integration of green power generation into modern power systems. Renewable energy sources (RES), such as wind turbines and photovoltaic (PV) systems, play a key role in reducing greenhouse gas emissions and mitigating the effects of climate change [1]. However, the intermittent and stochastic nature of renewable power generation introduces new operational challenges that significantly affect the stability, reliability, and security of power systems. This evolution highlights the importance of a thorough understanding of the impact of RES integration on system stability. Without such knowledge, it becomes difficult to develop and implement effective solutions to ensure system reliability in the presence of increasing renewable penetration, particularly as renewable energy sources progressively replace conventional power plants that inherently provide system inertia [2].
Conventional power systems mainly rely on synchronous machines to provide the inertia required to maintain system stability by naturally damping frequency variations during disturbances. Due to their large rotational inertia, these machines help mitigate frequency fluctuations by absorbing and releasing kinetic energy during contingencies [3]. In contrast, variable renewable energy sources (RES), which are generally connected to the grid through power electronic converters, contribute little or no inertia, thereby increasing the vulnerability of power systems to frequency variations [4]. The transition toward low-inertia power systems therefore raises major concerns regarding the ability to maintain system frequency within operational limits and prevent large-scale instabilities [5]. In this context, analyzing the impact of renewable energy integration on key stability indicators, such as frequency nadir, Rate of Change of Frequency (RoCoF), frequency response time, and rotor angle synchronization of generators, becomes essential for the design and operation of future power systems. Frequency stability remains a fundamental indicator of the balance between generation and demand, which is essential to prevent widespread outages and to protect grid equipment [6]. The evolution of power systems, characterized by the increasing integration of new generation units and operation at higher voltage levels, has intensified concerns related to system instability and network security. In this context, the analysis of steady-state voltage stability has become a critical issue for ensuring the balance, reliability, and security of power systems, as variations in active power and nodal voltages directly influence the overall system performance [7]. Power system instability can lead to persistent voltage oscillations across the network, particularly following voltage drops or faults, as well as delayed voltage recovery after fault clearance. It may also result in reduced fault ride-through capability of generators and malfunction of protection devices, especially relays. So-called “weak” power systems, characterized by limited robustness, therefore exhibit reduced resilience to voltage disturbances [8]. The determination of the Critical Clearing Time (CCT) is an important characteristic of circuit breaker operation. It plays a crucial role in the analysis, planning, and operation of power systems. The value of the CCT depends not only on the location and severity of the fault but also on the intrinsic parameters of the power system [9].
Furthermore, the reduction in system inertia may lead to rapid frequency variations, commonly referred to as the Rate of Change of Frequency (RoCoF), following significant power disturbances [10]. A high RoCoF, exceeding 2 Hz/s, may result in the loss of synchronism of photovoltaic generators [11], failures in the grid-following mechanisms of generators connected through power electronic interfaces, as well as an inadequate response of under-frequency load shedding (UFLS) schemes [11,12]. Low-inertia power systems, often referred to as “light” grids, are therefore particularly vulnerable to the degradation of frequency control and exhibit a reduced capability to withstand electrical disturbances. Consequently, the new requirements related to system robustness and inertia in power systems with high penetration of renewable energy sources must be carefully investigated in order to address the operational security challenges associated with voltage and frequency control [8]. This analysis highlights that the stability and robustness of power systems are inevitably affected by the increasing integration of converter-based renewable energy sources [13].
The objective of this paper was to clarify the main stability indices used to assess renewable energy integration in power systems. The IEEE 39-bus test system was used as the study case, to which renewable energy sources were added. The system was modeled using well-established components documented in the IEEE and WECC standards.

2. Main Stability Indices in Power Energy Systems

2.1. Inertia and Rate of Change of Frequency (RoCof)

In a power system, inertia refers to the kinetic energy stored in the rotating masses connected to the system, particularlysynchronous generators and large industrial motors. When a significant disturbance occurs, the kinetic energy stored in the rotors of synchronous generators is instantaneously released to counteract angular variations and maintain the balance between electrical and mechanical torques. This inertial response helps reduce the Rate of Change of Frequency (RoCoF), thereby allowing frequency control mechanisms to act effectively in stabilizing the system. The continuous exchange of energy between the rotating masses of generators and the electrical network mitigates the dynamic variations of the system and helps maintain the frequency within acceptable limits [14].
The relationship between system inertia and the power imbalance can be represented as follows [15]:
2 H ω s d 2 δ d t 2 = P m P e
where H is the inertia constant, ω the angular speed, P m and P e are the mechanical and electrical powers, respectively.
In general, the equivalent inertia of a system composed of N synchronous machines and M renewable energy sourcescan be evaluated using the following equation [14]:
H = i = 1 N H S G , i . S S G , i + k = 1 M H V i r t u a l , k . S R E S , k i = 1 N S S G , i + k = 1 M S R E S , k
where S S G , i and H S G , i are the rated power and the synchronous inertiaconstant of the ith synchronous generator; S R E S , k and H V i r t u a l , k arethe rated power and the virtual inertia constant of the kth renewable energy source.
According to the above expression, it can be observed that in a conventional power system (without renewable energy sources), the equivalent inertia constant of the system corresponds to the sum of the inertia constants of the synchronous generators connected to the grid (HSG = H). In contrast, in a hybrid system integrating both synchronous generators and renewable energy sources, and in the absence of virtual inertia, the overall equivalent inertia of the system is reduced.
The Rate of Change of Frequency (RoCoF) is a key indicator used to evaluate the speed at which the system frequency varies following a disturbance or a power imbalance. It represents the rate at which the frequency deviates from its nominal value when an imbalance between power generation and consumption occurs. Such an imbalance may result, for example, from a sudden loss of generation (such as the tripping of a generator) or from rapid load variations. In modern power systems characterized by a high penetration of variable renewable energy sources, such as solar and wind power, the reduction in system inertia may lead to faster frequency variations, making RoCoF particularly critical. High RoCoF values can impose significant stress on equipment, compromise network stability, and in some cases lead to cascading failures if not properly controlled.
The RoCoF can be approximated using the following expression [14,15,16]:
R o c o f = P P L o a d . f n 2 . H
where P is the power imbalance, P L o a d the total active power of system loads and f n is the nominal frequency.
The RoCoF is inversely proportional to the equivalent system inertia. Consequently, low-inertia systems exhibit higher RoCoFvalues and lower frequency nadirs [16]. Generally, the maximum frequency deviation Δ f M a x and the RoCoF d f d t are used as triggering signals for protection and control devices in power systems. The threshold values for the maximum frequency deviation and RoCoF are typically defined by power system operators.

2.2. Transient Stability CCT

Transient stability is defined in [17] as the ability of a power system to maintain synchronism when subjected to a severe transient disturbance. When such an event occurs, the system dynamics are characterized by significant variations in the rotor angles of generators, which are strongly influenced by the nonlinear relationship between electrical power and rotor angle (the power–angle relationship).
A widely used indicator for assessing transient stability is the Critical Clearing Time (CCT). This index defines the maximum duration during which a short circuit can persist before being cleared by protection devices while still allowing the system to maintain synchronism after fault removal. In other words, the CCT represents the time limit beyond which the system becomes transiently unstable. From an analytical perspective, the CCT depends in a complex manner on the system pre-fault operating conditions, the characteristics and location of the fault, as well as the post-fault conditions, which are themselves influenced by the protection strategy and the tripping scheme employed.
Several methods have been proposed in the literature to determine the Critical Clearing Time (CCT). In this work, the CCT is evaluated using time-domain simulations, which consist of applying a short circuit at a specific bus while progressively increasing the fault duration. The CCT is then identified based on the evolution of the rotor angle, beyond which the synchronous generator is no longer able to maintain synchronism. However, with the increasing integration of renewable energy sources connected through power electronic converters, traditional approaches for evaluating the CCT are becoming less suitable. Recent studies, such as [18], have therefore proposed new criteria that take into account the technical constraints of static power electronic converters.
In interconnected but independently controlled microgrids, the power generation within each area must be adjusted in order to maintain system stability and ensure proper power balance.

3. Study Case and Simulation Results

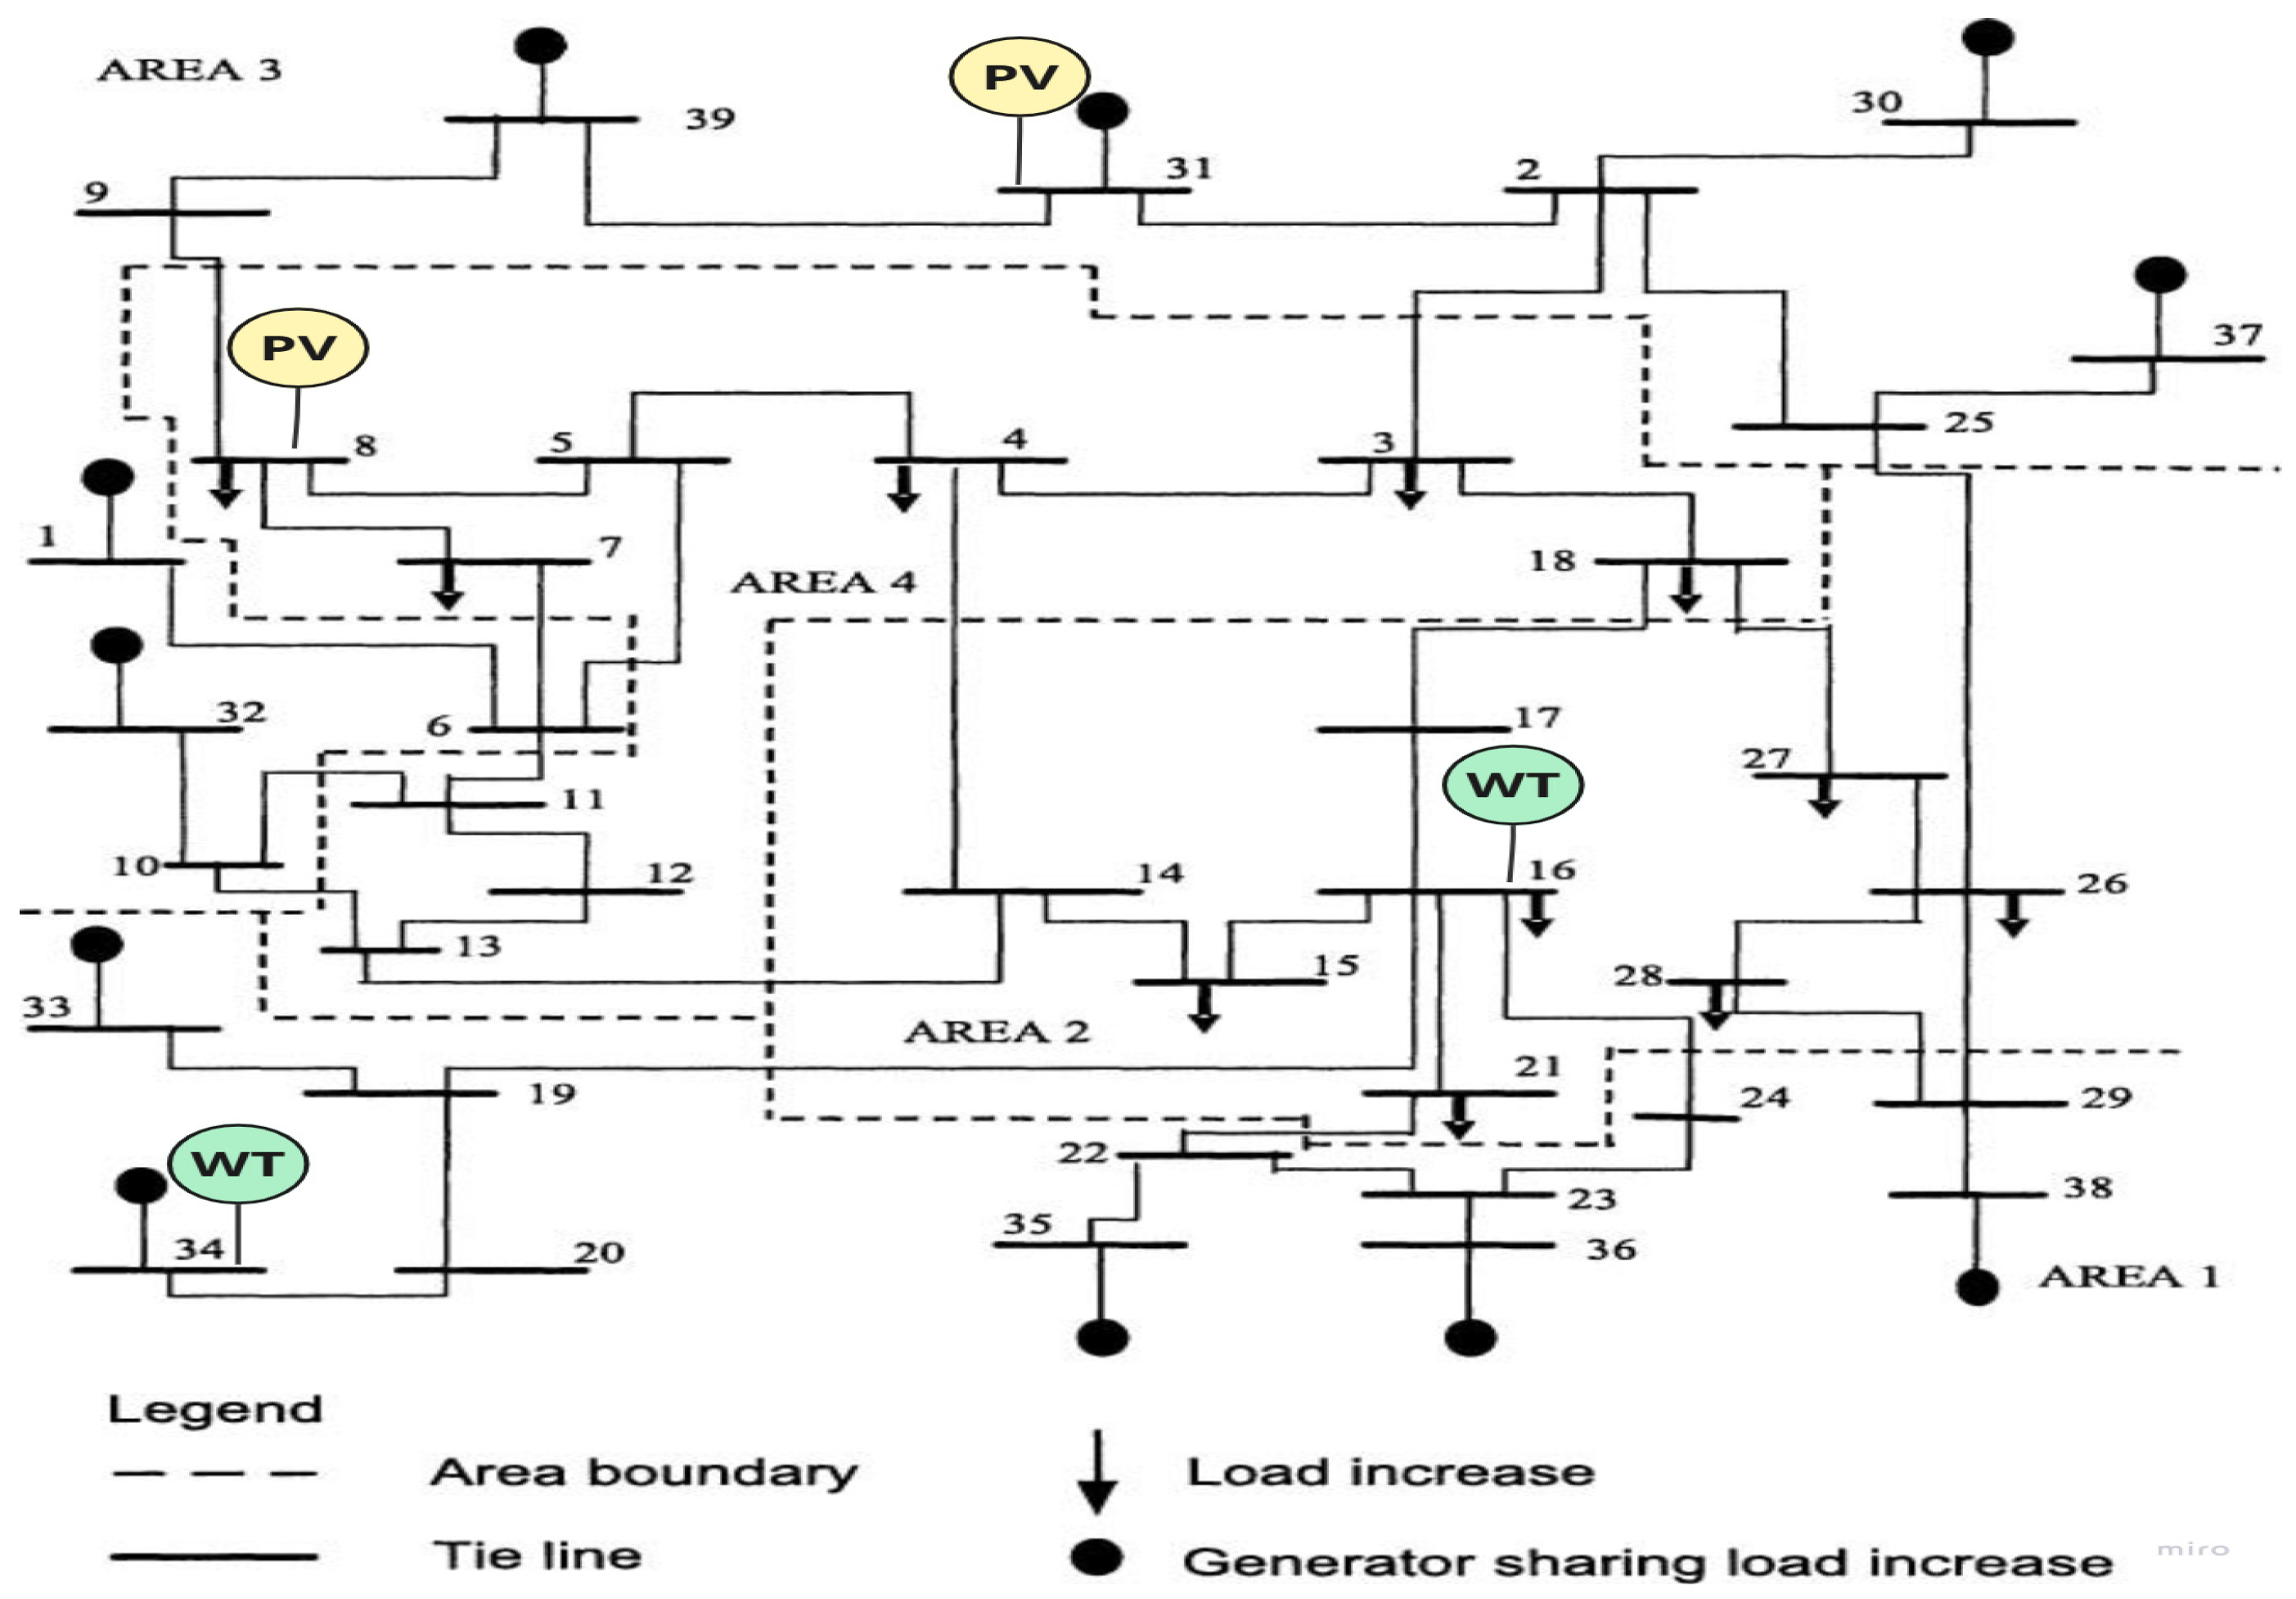
The case study presented in this work focuses on the IEEE 39-bus power system. The system comprises 46 transmission lines, 39 buses, 10 synchronous generators, 10 synchronous compensators, and 19 load buses, as shown in Figure 1.
For system simulation, the Power System Analysis Toolbox(PSAT) under MATLAB 2024b was used. Wind turbines and photovoltaic generators were integrated at generation and load buses. The system was simulated under both stable and unstable operating scenarios. The dynamic stability analysis is based on two main stability indices: the critical clearing time (CCT) and the rate of change of frequency (RoCoF). The investigated disturbances include a three-phase short circuit at a network bus and a generator tripping event. These disturbances were selected to represent the most severe operating scenarios. It can be noticedthat optimizing the stability index can enhance the dynamic behaviour of the system in the presence of load changes and renewable sources.

3.1. Load Flow Analysis and System Strength Evaluation

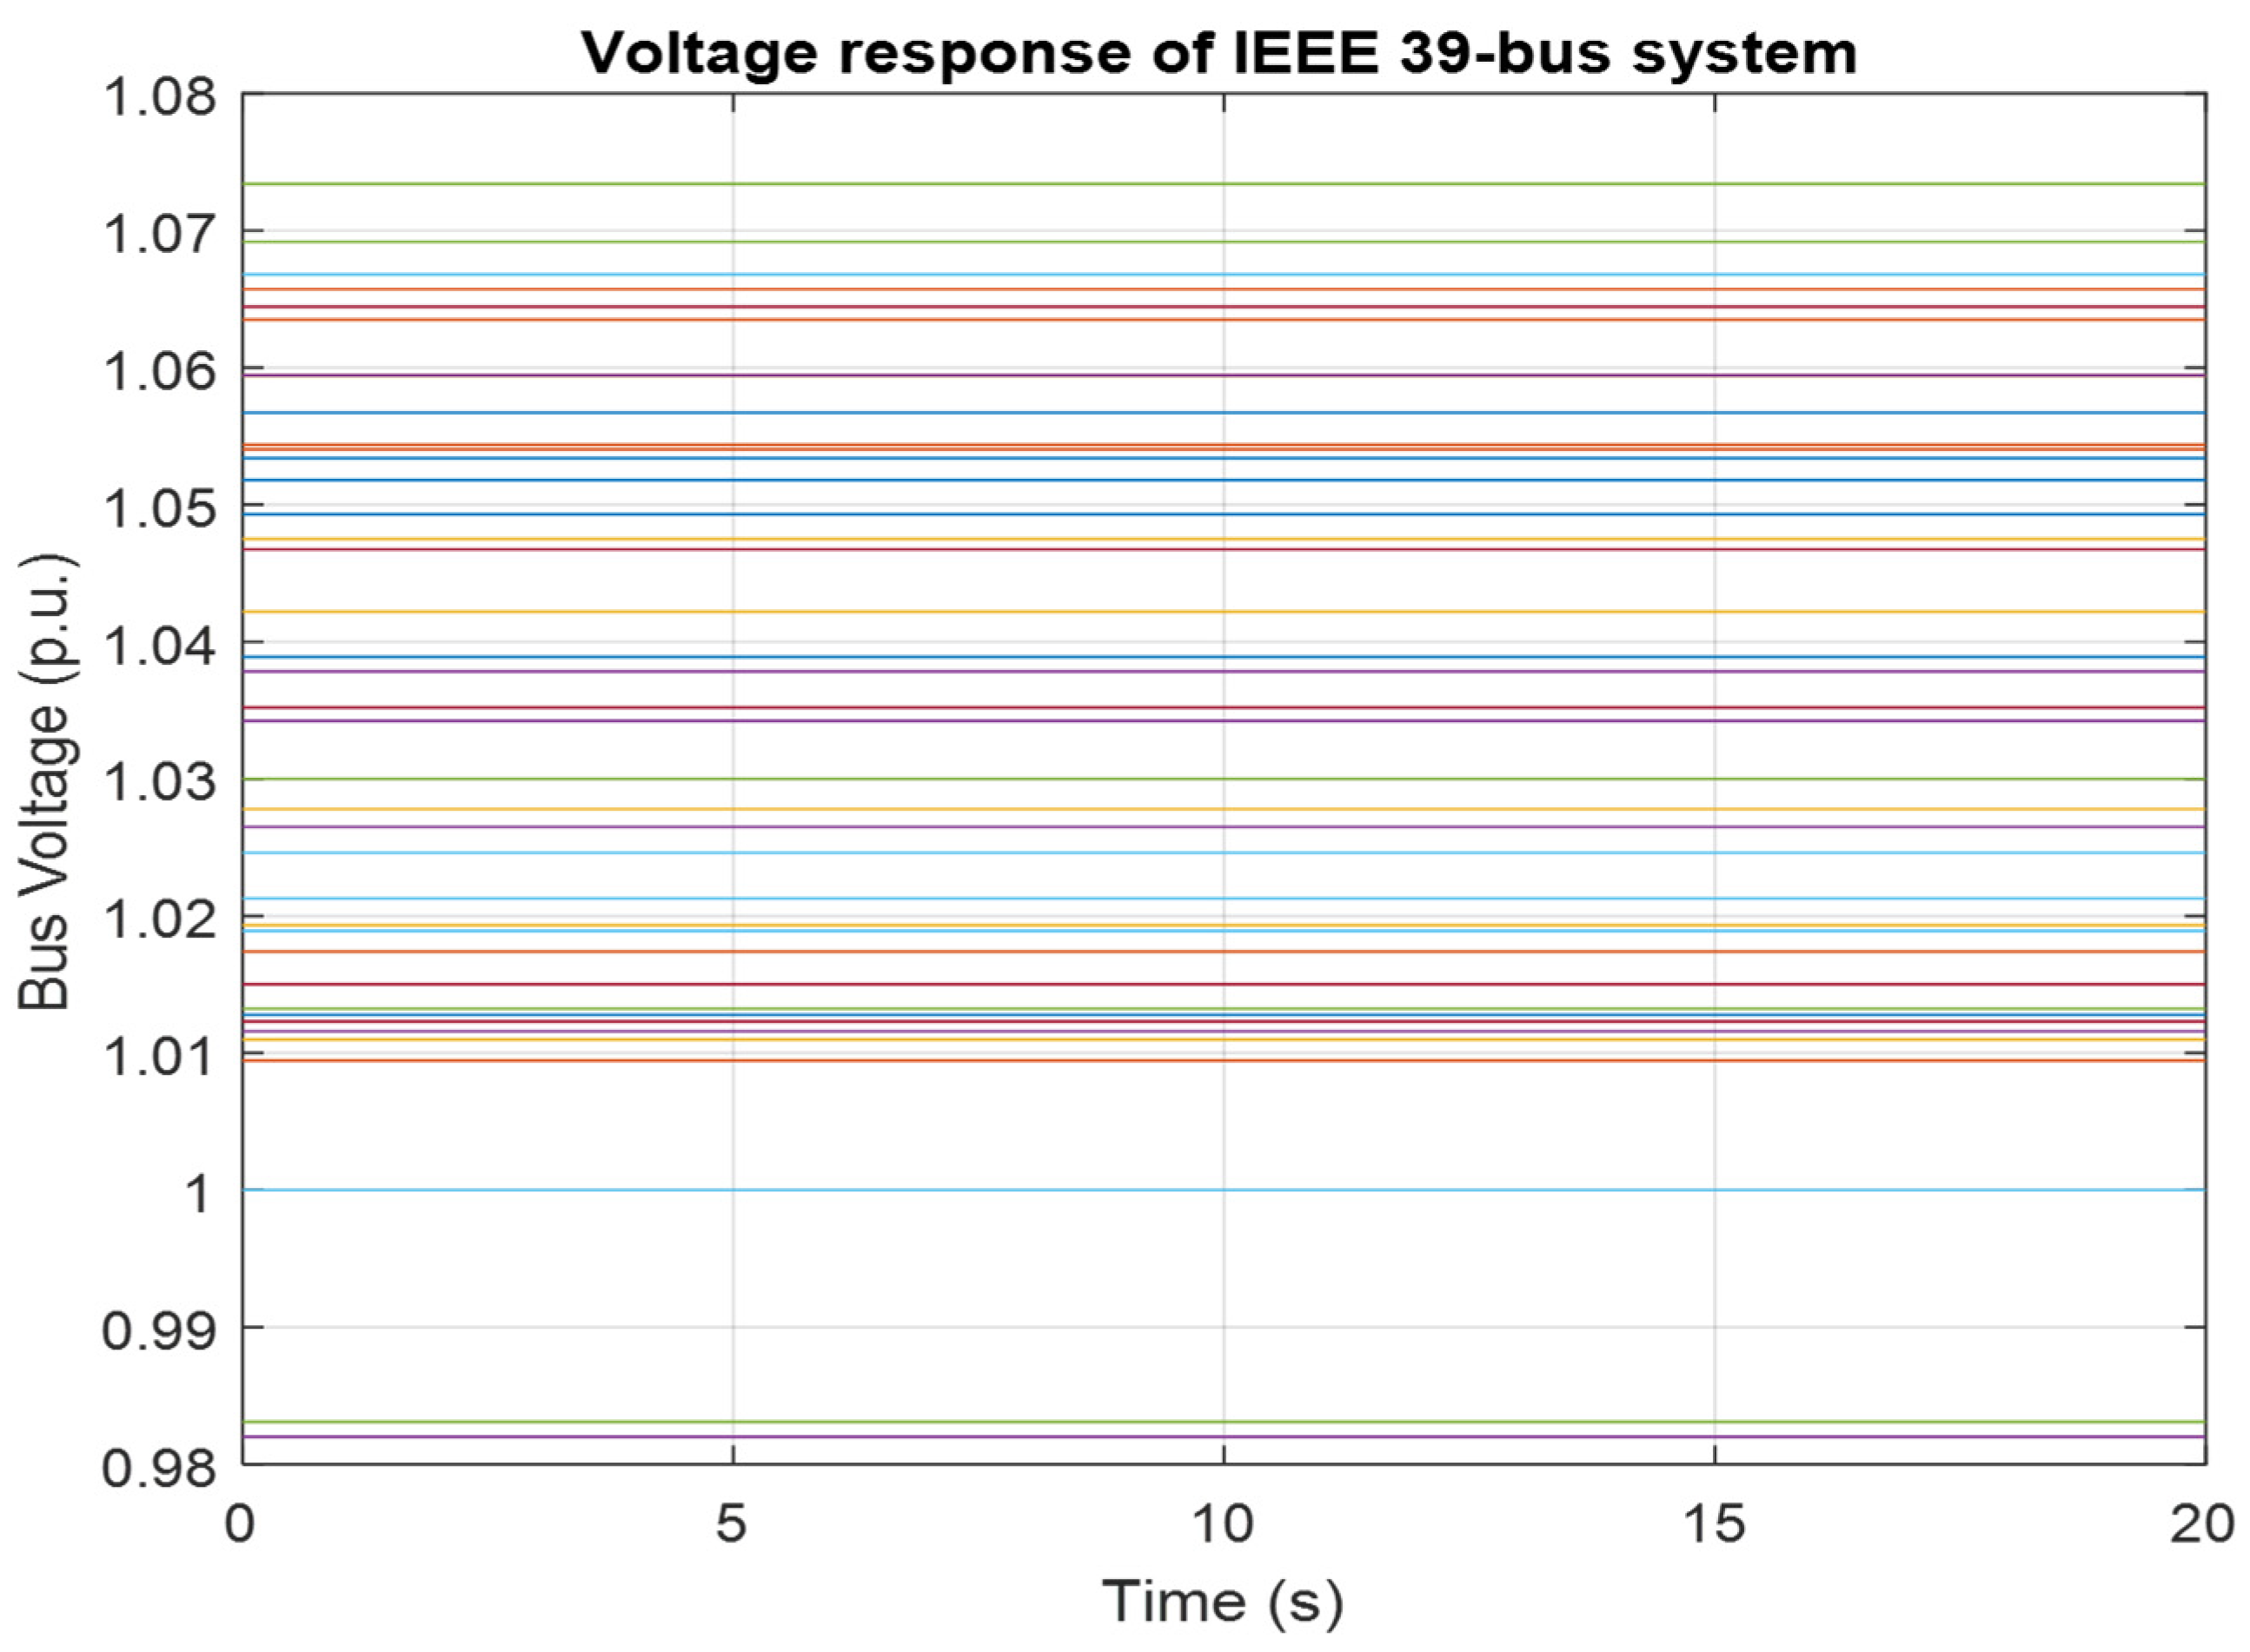
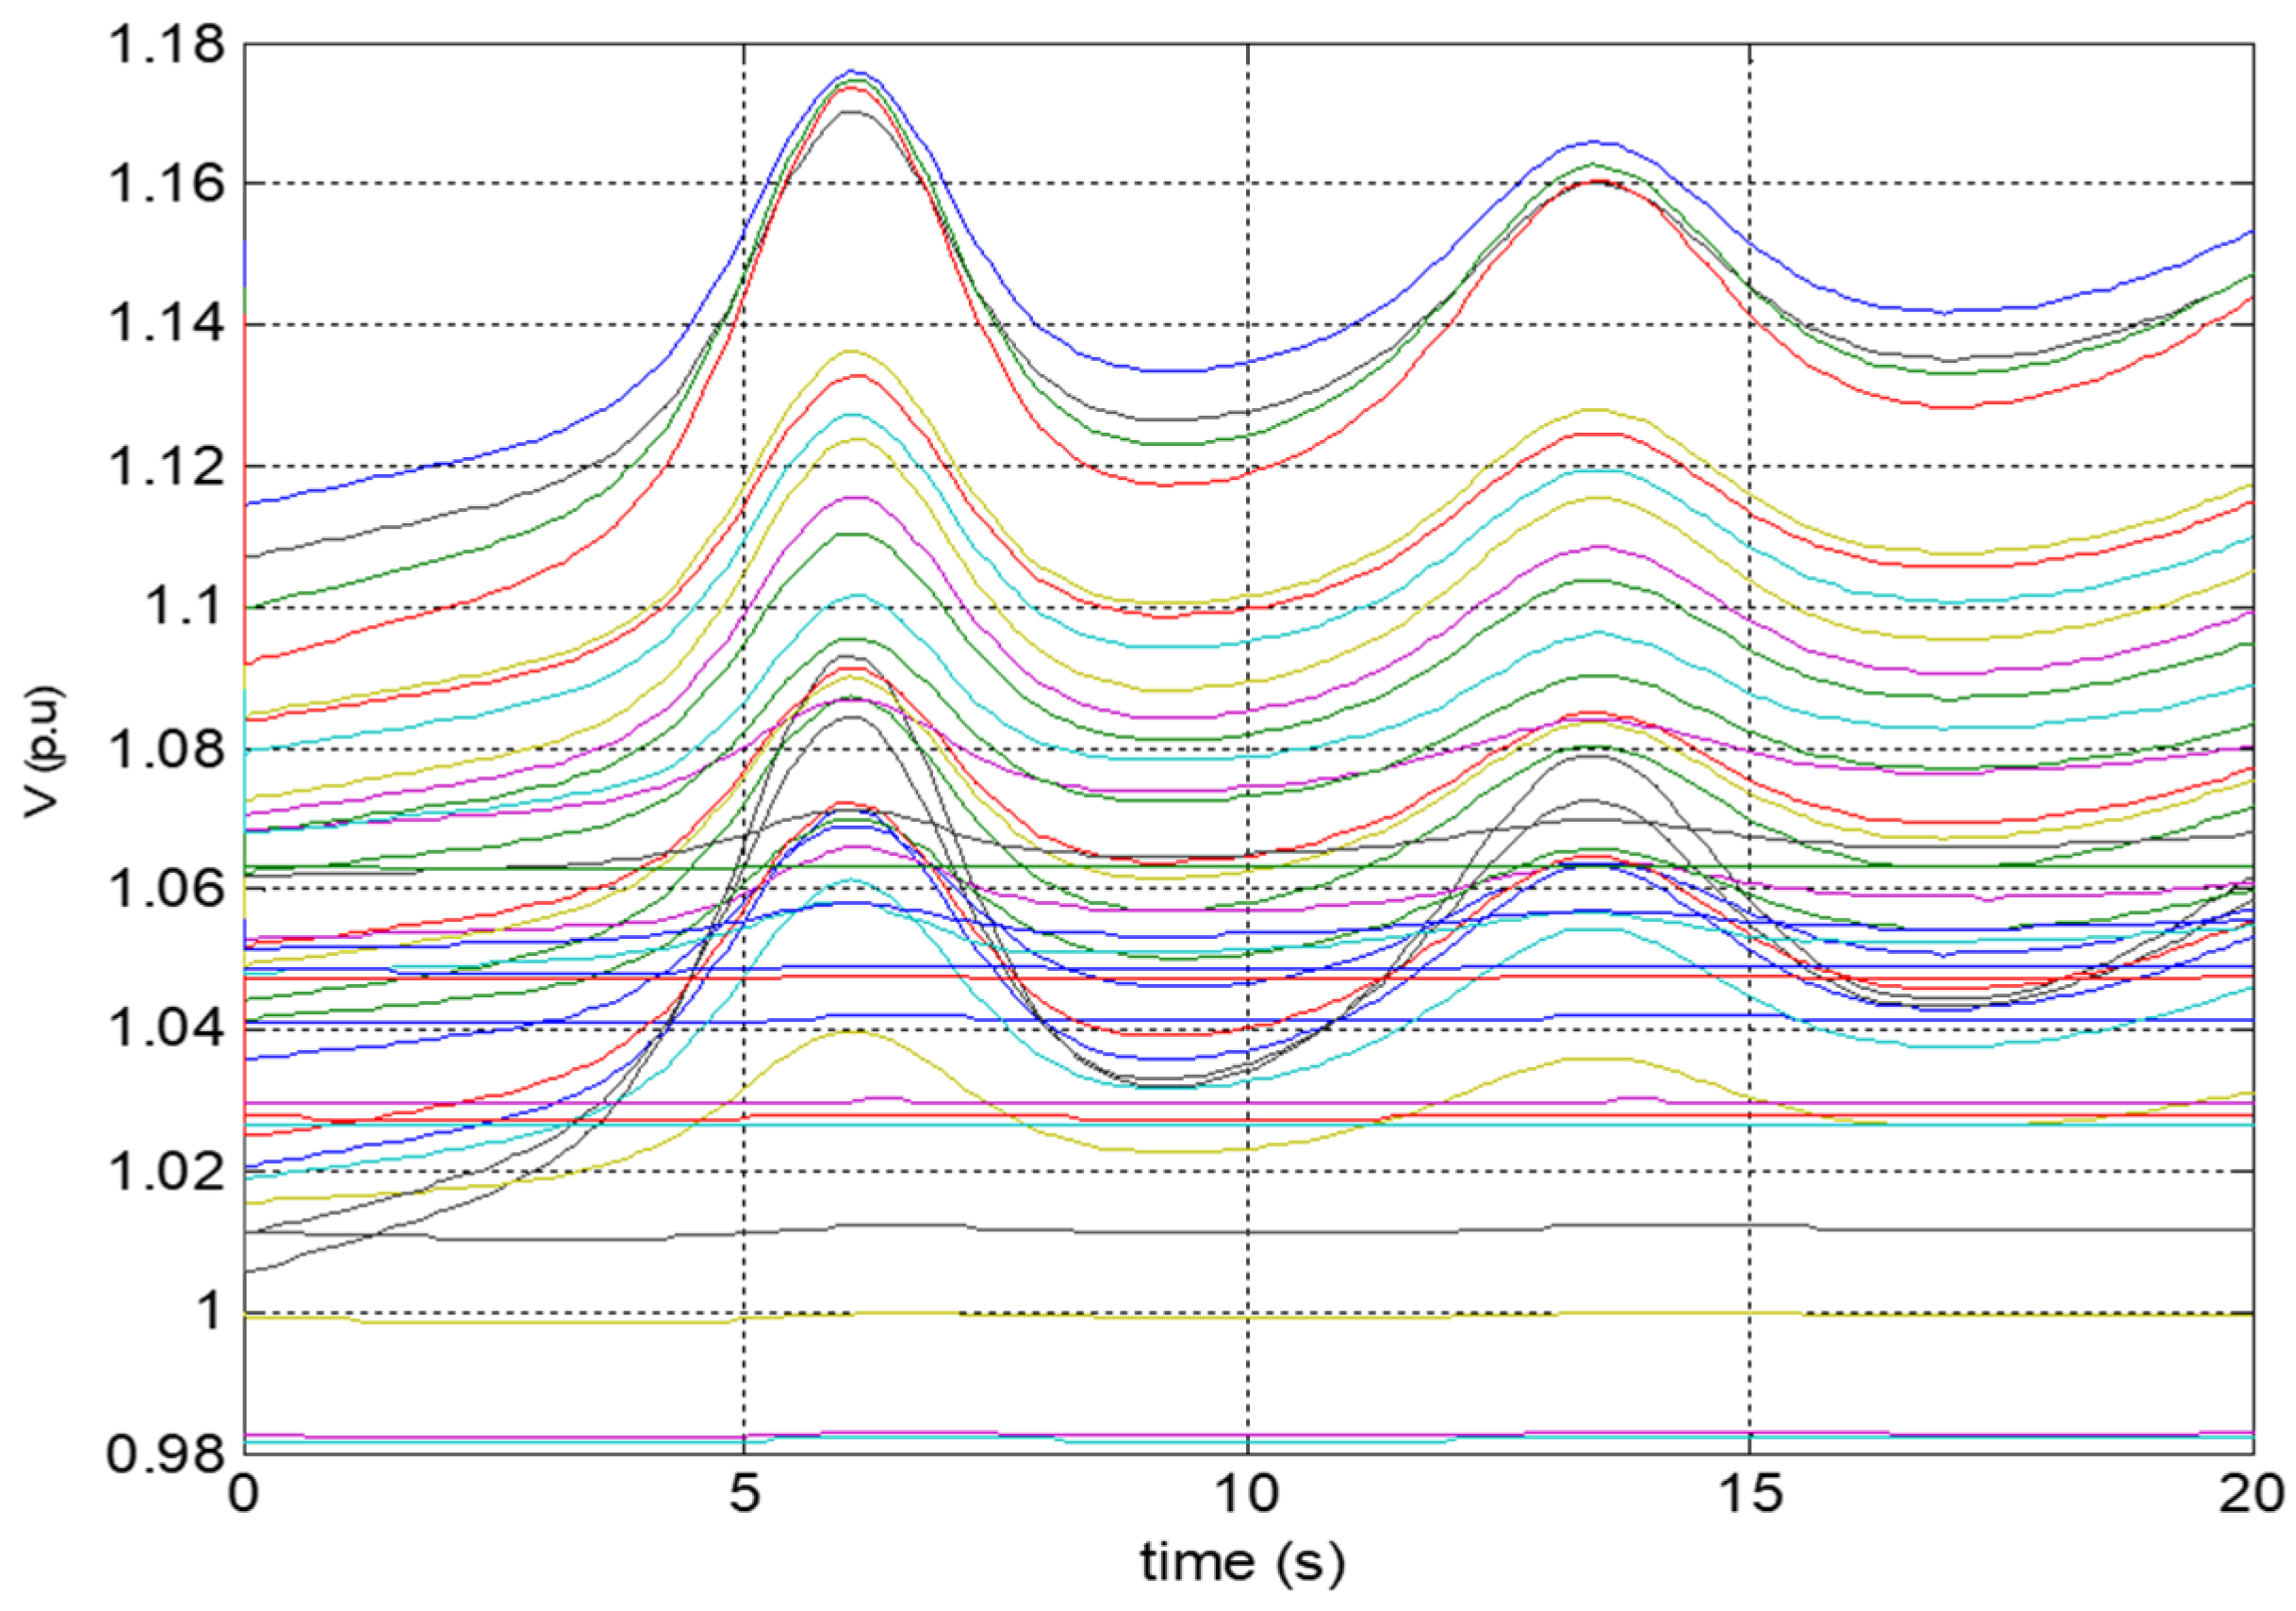
Power flow simulations are first carried out to determine the steady-state operating conditions of the system prior to the fault, including phase angles, active and reactive power flows, and voltage levels at all network buses. The Newton–Raphson algorithm is used for the power flow calculations within the PSAT environment implemented in MATLAB. The results are shown in Figure 2.

3.2. Assessment of Dynamic Stability Indices

The dynamic stability analysis is based on two main indices: the Critical Clearing Time (CCT) and the Rate of Change of Frequency (RoCoF). Two types of disturbances are considered in this study: a three-phase short circuit applied at bus 16 and a generator tripping event. These disturbances were selected to represent particularly severe scenarios for the system. The three-phase short circuit is likely to have a significant impact on the entire network; therefore, bus 16 was chosen as the fault location for the estimation of the CCT. The second disturbance corresponds to a power imbalance caused by the loss of the generator with the highest inertia constant, namely generator G1.
  • Case 1: Three phases short-circuit fault
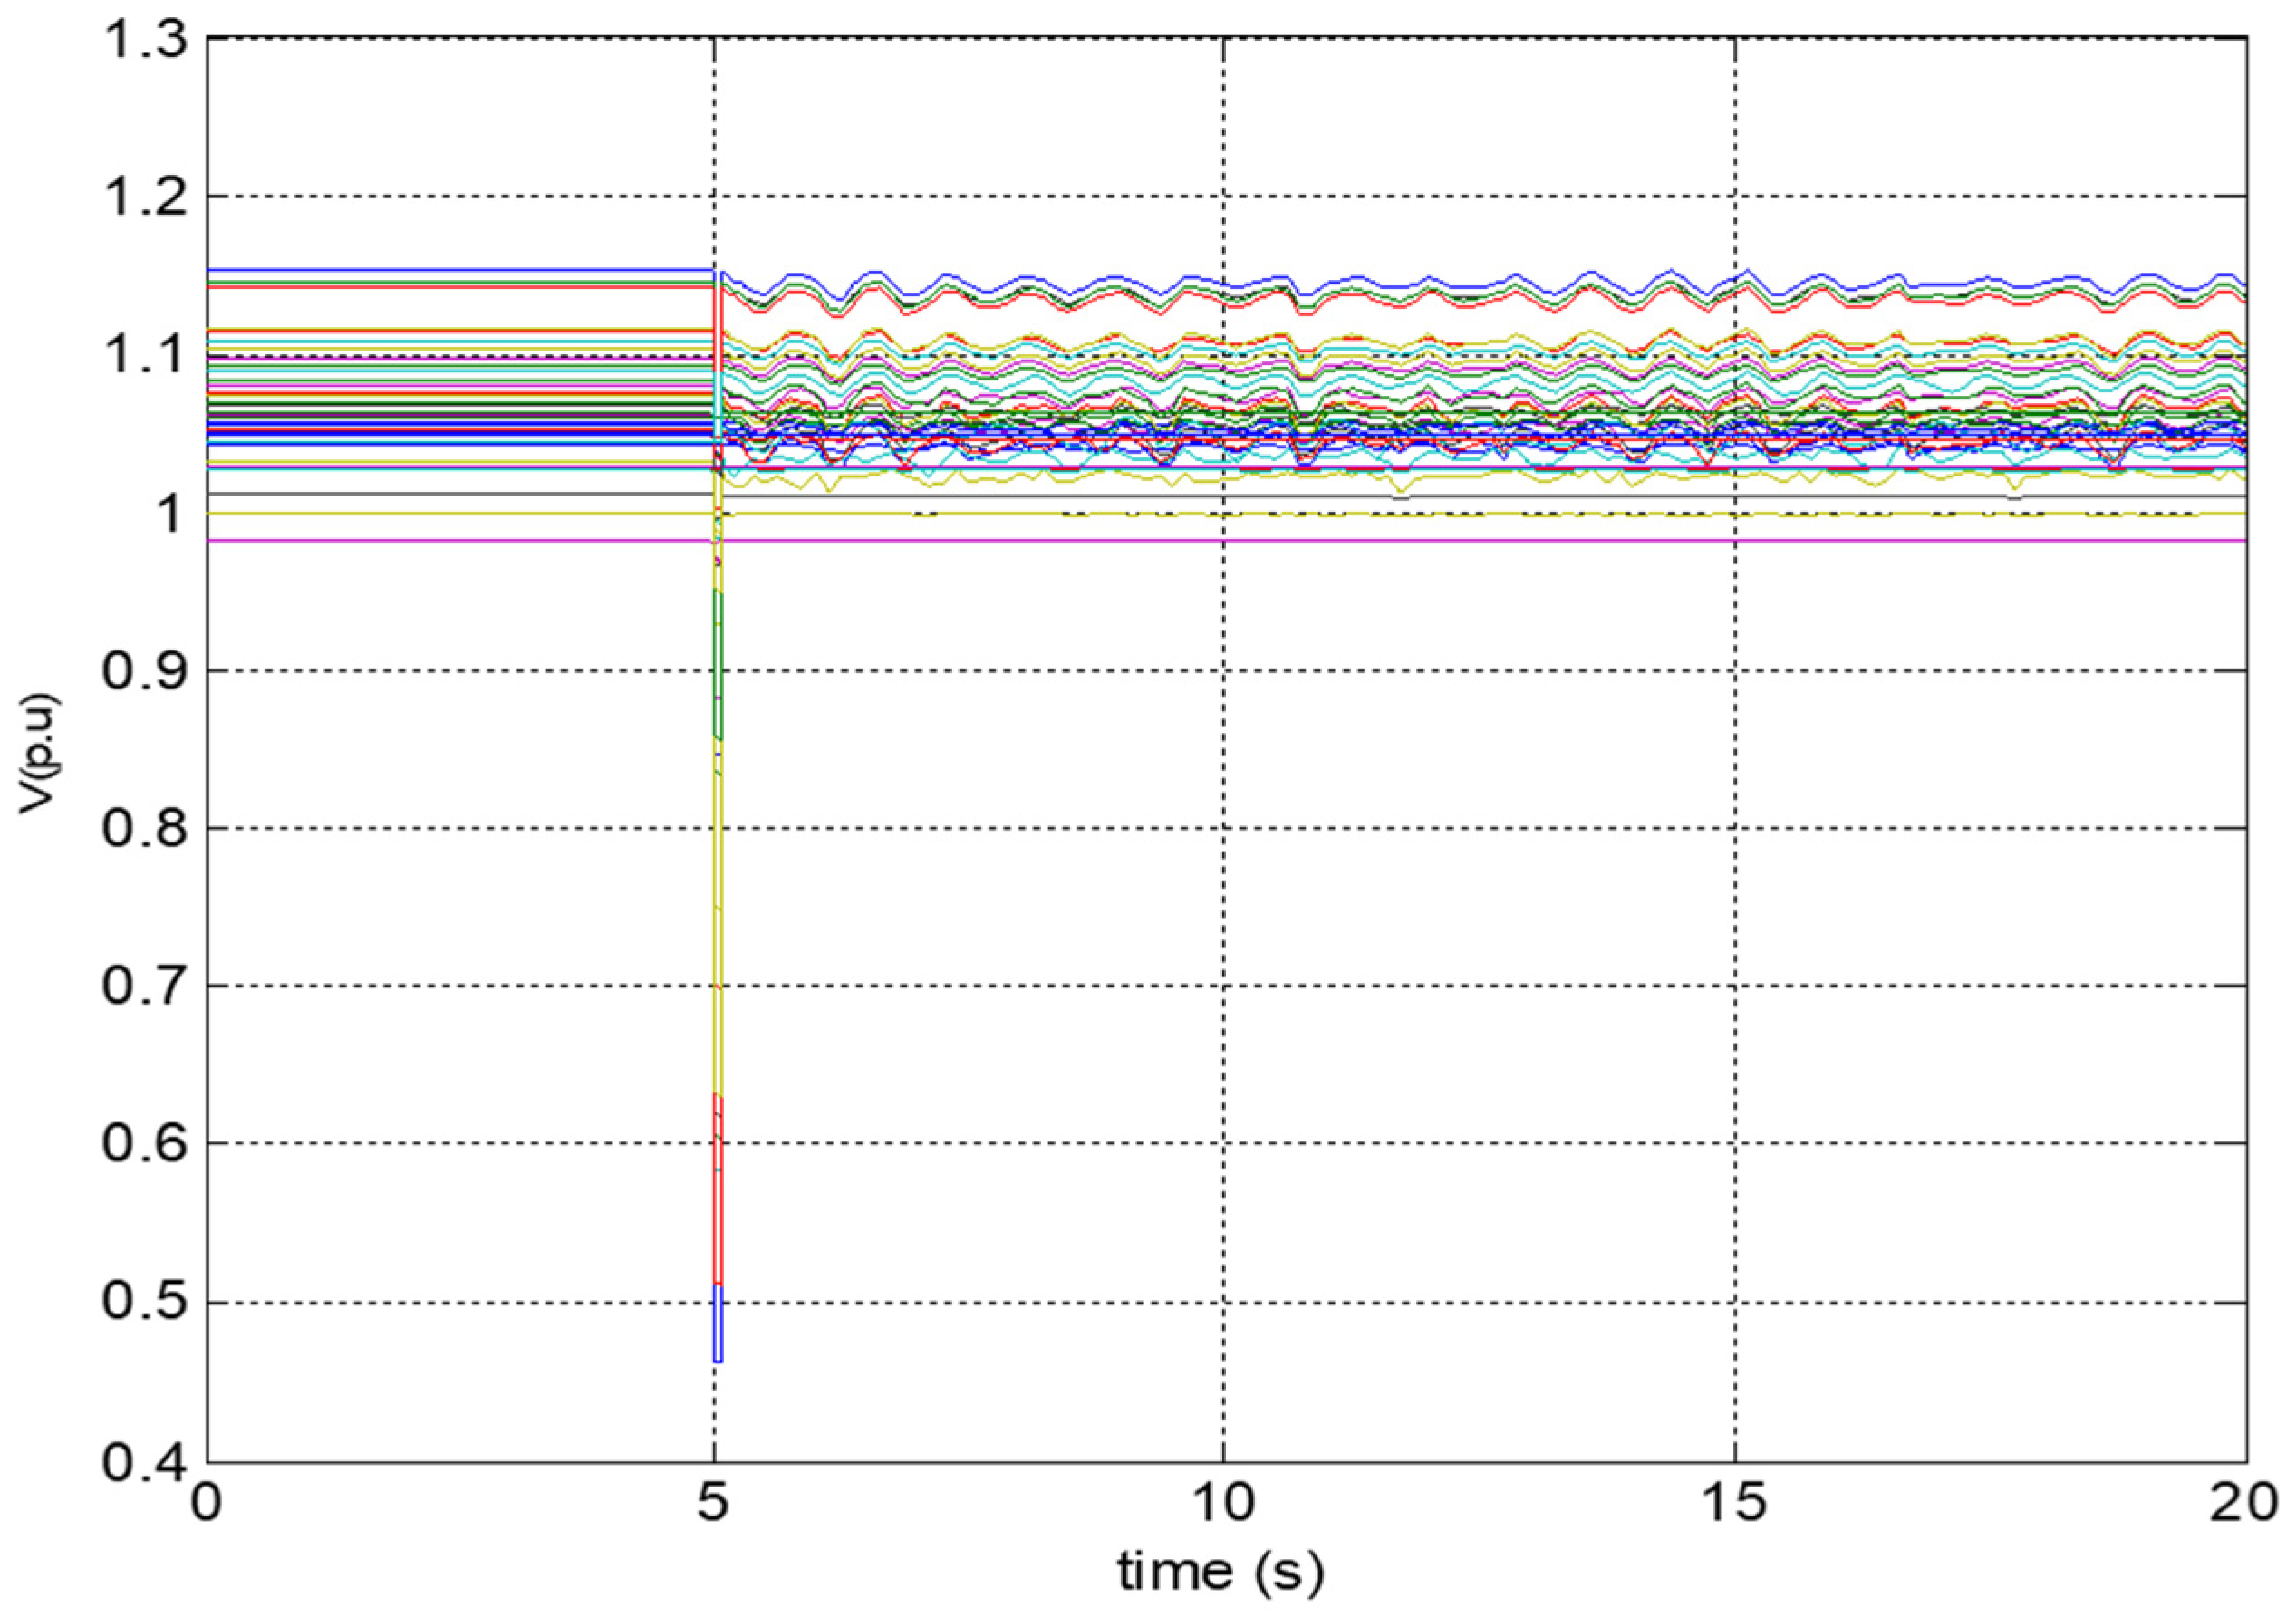
As a reference case, simulations were carried out on the above-mentioned network in order to determine the Critical Clearing Time (CCT). The short-circuit fault was considered as the base disturbance and was applied at 0.07 s. A balanced three-phase short-circuit fault was applied at bus 16, as illustrated in Figure 3, Figure 4 and Figure 5.
  • Case 2: Trip of Generator G1
The following figures present the temporal evolution of the electrical frequency following the tripping of generator G1. An initial frequency drop is observed, followed by stabilization around a value lower than the nominal frequency, accompanied by slight oscillations. This behavior is observed for all generators in the system, which experience a power deficit whose magnitude depends on their frequency regulation characteristics (droop control).
The determination of RoCoF strongly depends on the selection of an appropriate measurement window. During transient phenomena, the frequency measured at different points of the network may exhibit significant variations. In order to obtain a more representative estimation of the RoCoF, it is necessary to filter out fast electrical transients and consider only the mechanical transients of the system. This can be achieved by increasing the measurement window, which allows for a more consistent estimation of the RoCoF [14]. However, the use of excessively large measurement windows may also lead to inaccurate estimations of this indicator. The rated power of Generator 1 is 100 MVA. The inertia constants of all generators are set to M = 2 H, and the damping coefficients of the generators in the IEEE 39-bus system are presented in Table 1. The results are illustrated in Figure 6 and Figure 7.

3.3. Impact of Renewable Energy Integration on Power System Stability

In this study, renewable energy sources (PV and WT) were integrated into the IEEE 39-bus test system. A 2 MVA wind turbine (WT) was connected at bus 16, while four photovoltaic (PV) units rated at 60 MW and 80 MVar were integrated at buses 8, 15, 21, and 39, as illustrated in the single-line diagram presented in Figure 1.
The system was simulated under two main scenarios: normal operating conditions without faults, and fault conditions in order to evaluate the dynamic behavior and stability of the electrical power system.
  • Case 1: Integration of RES without a fault
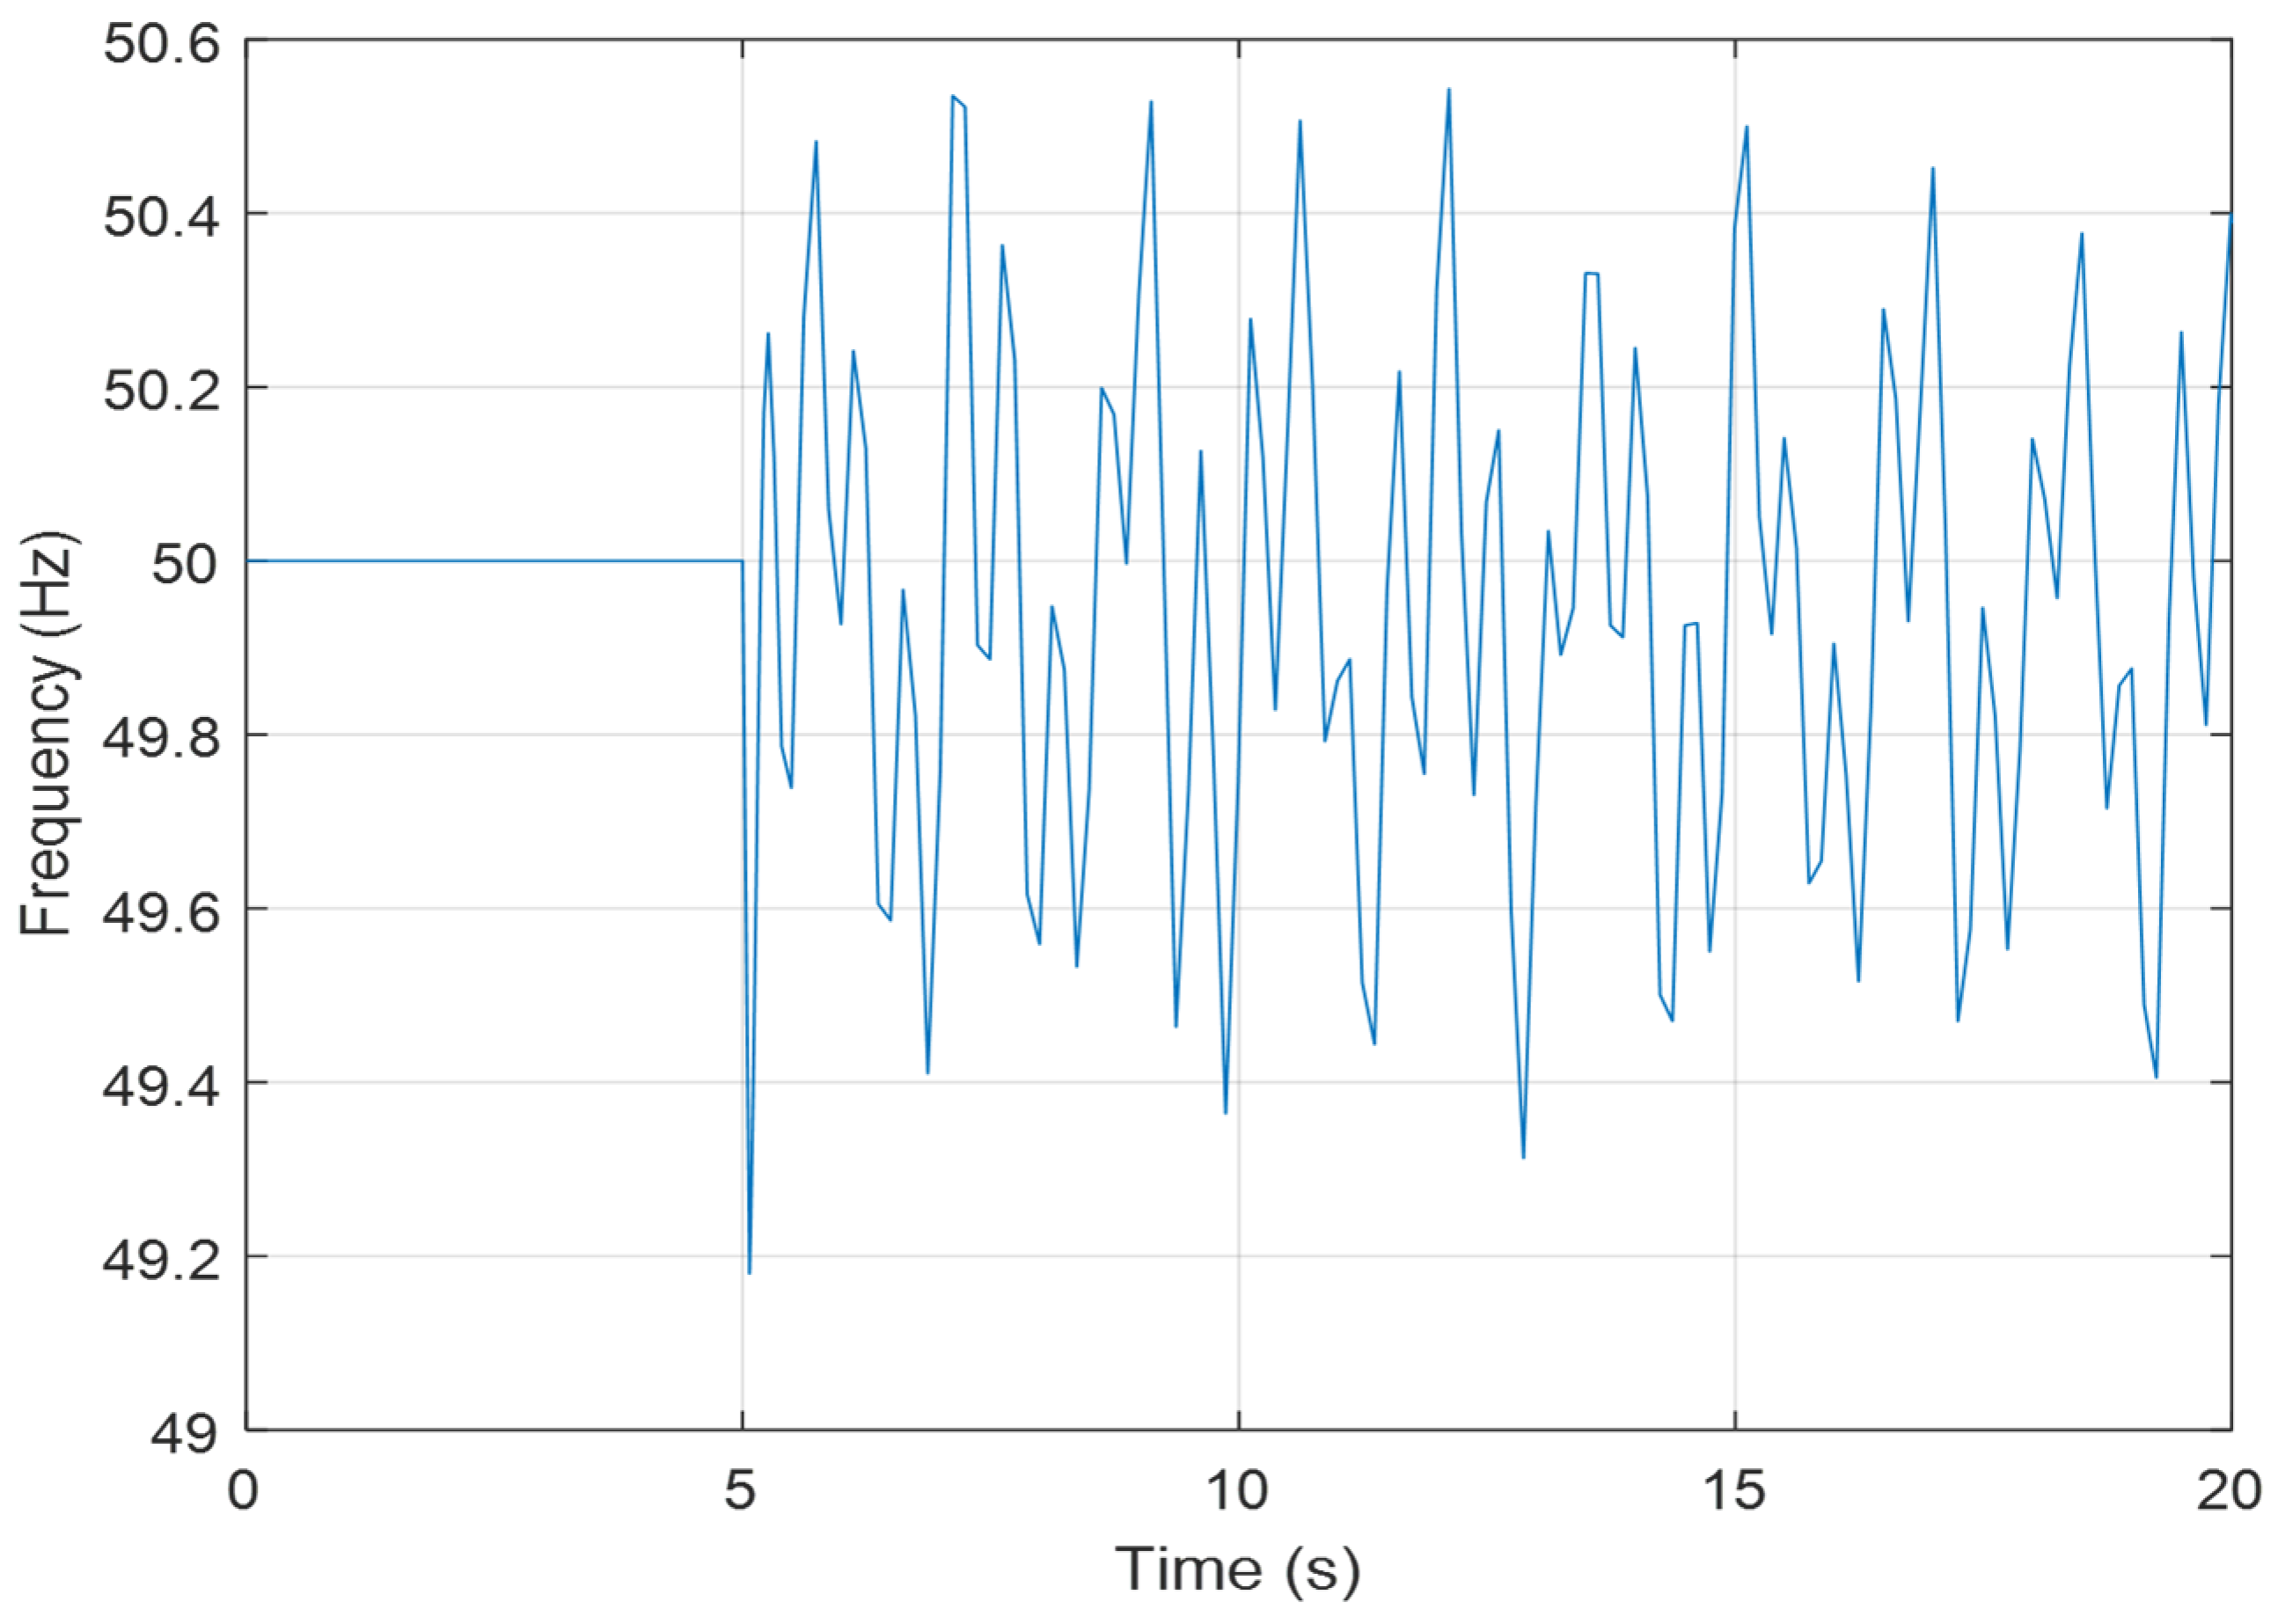
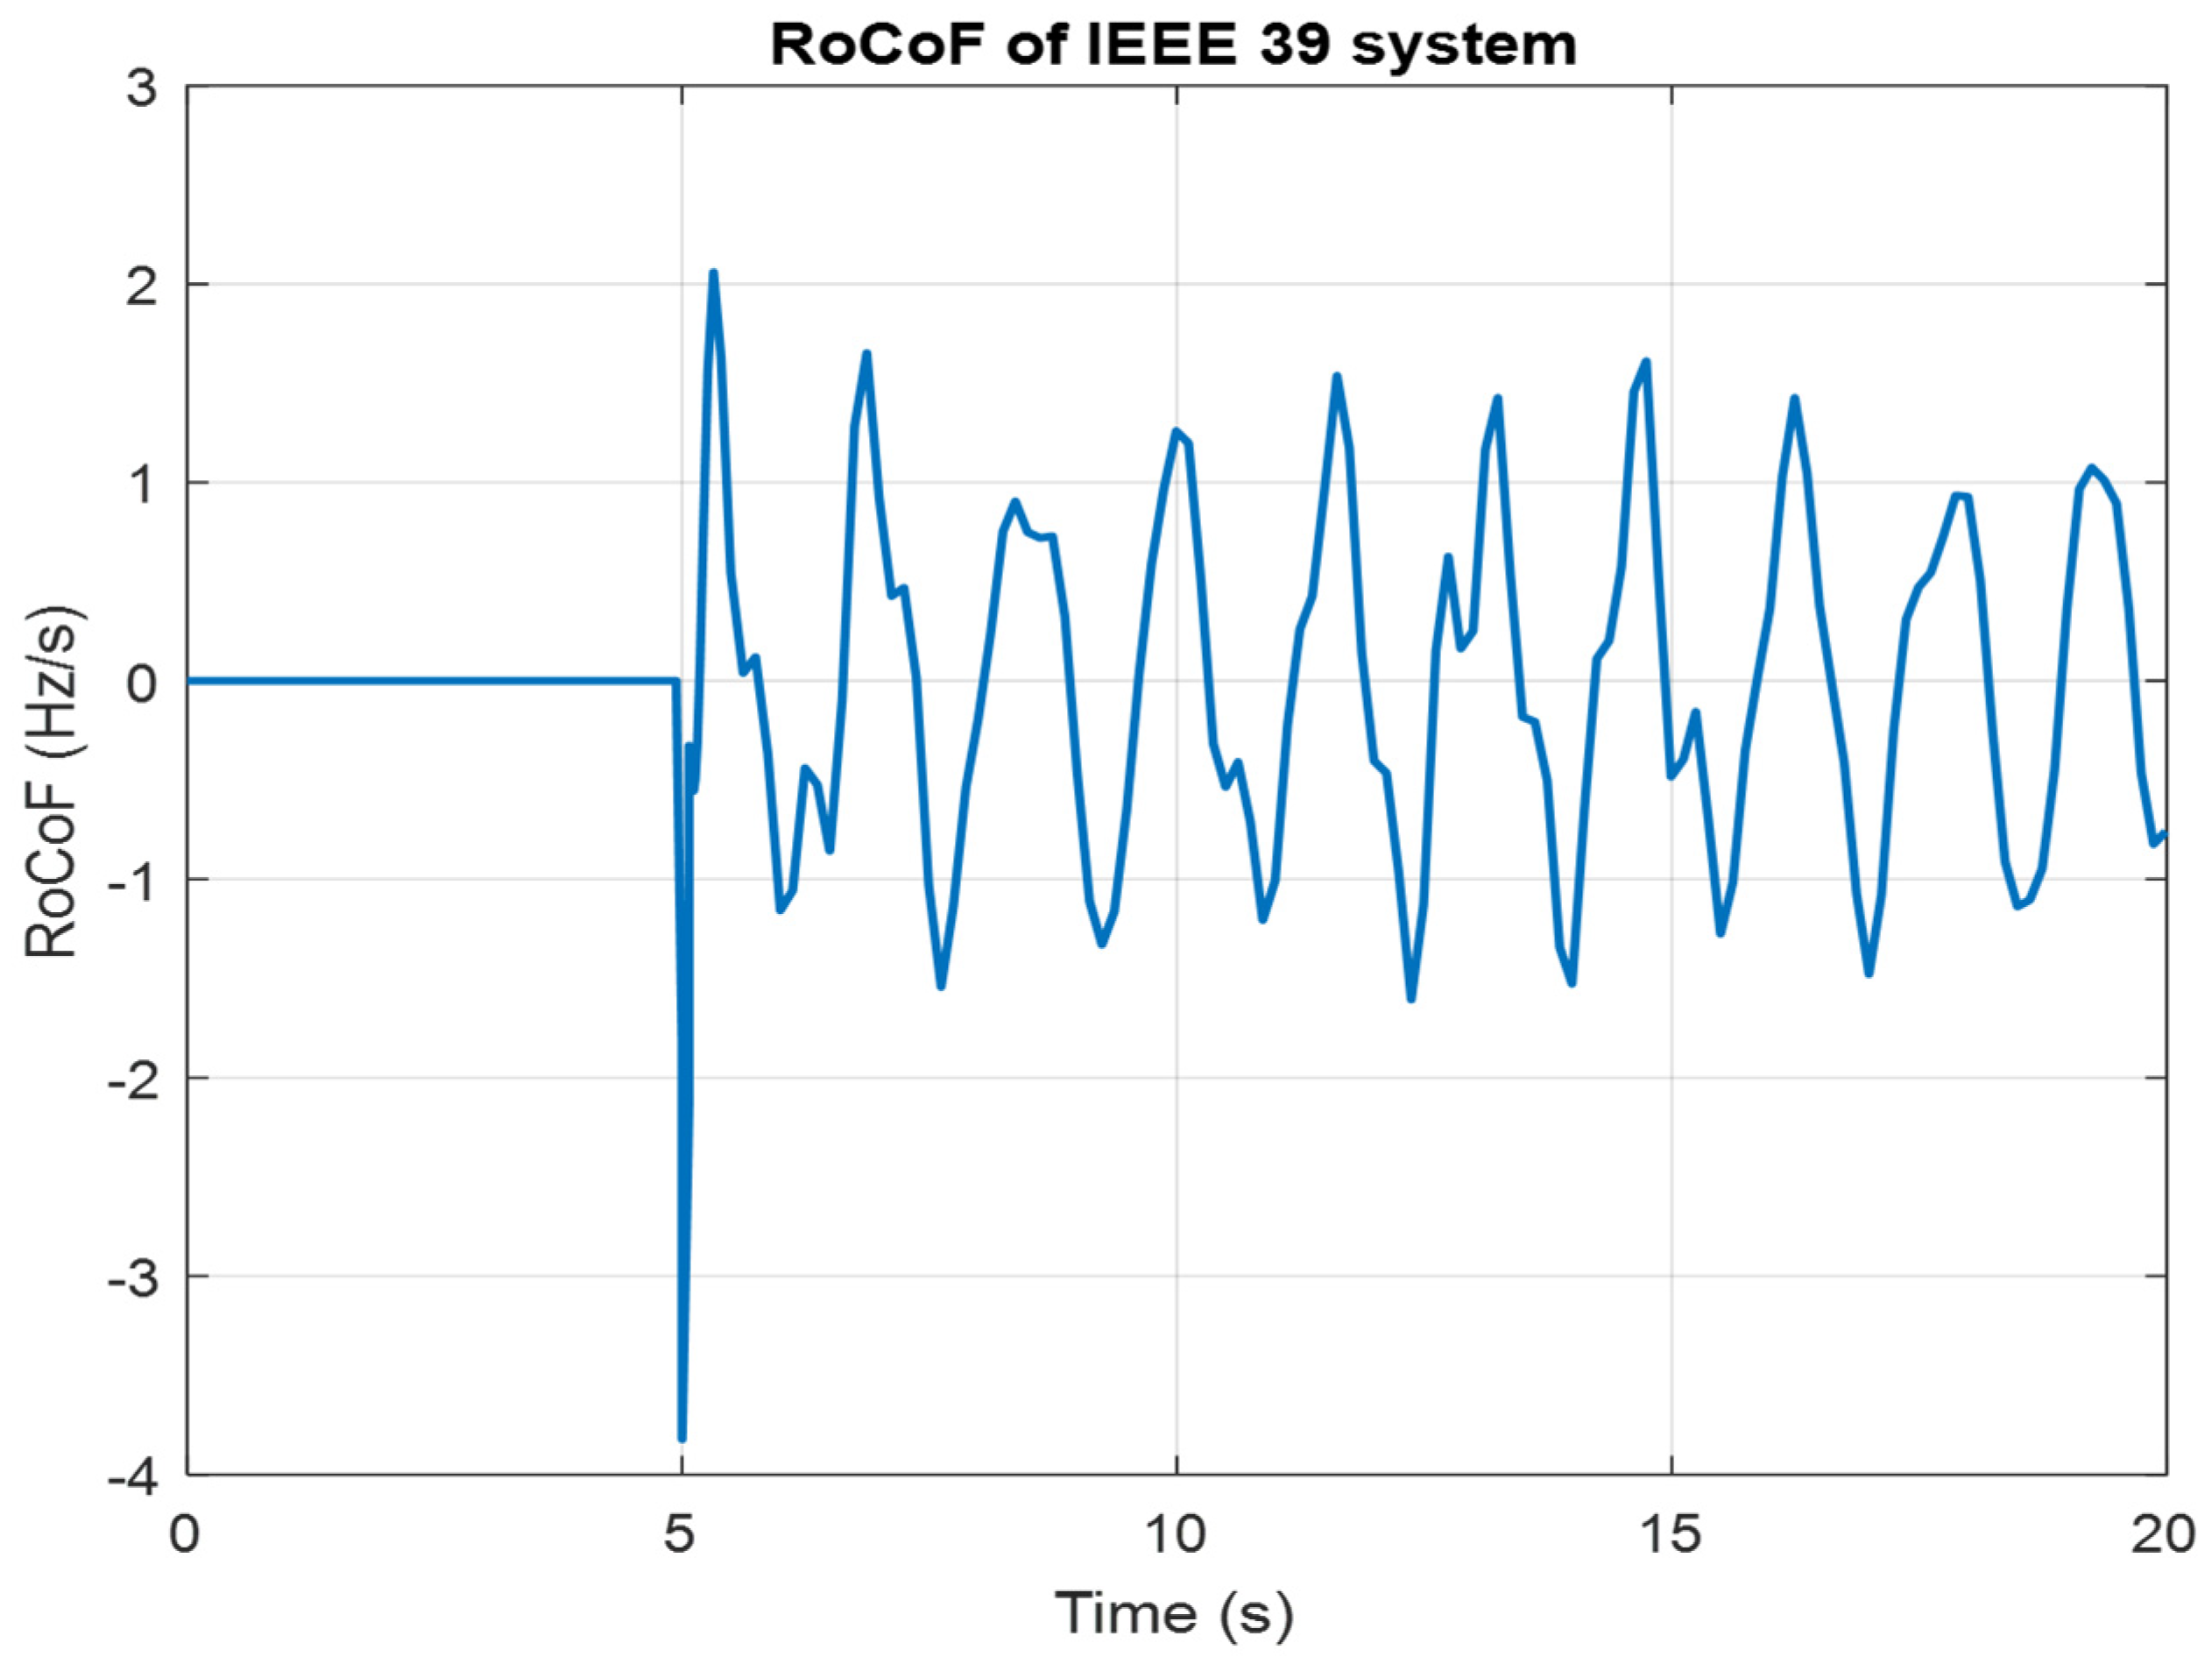
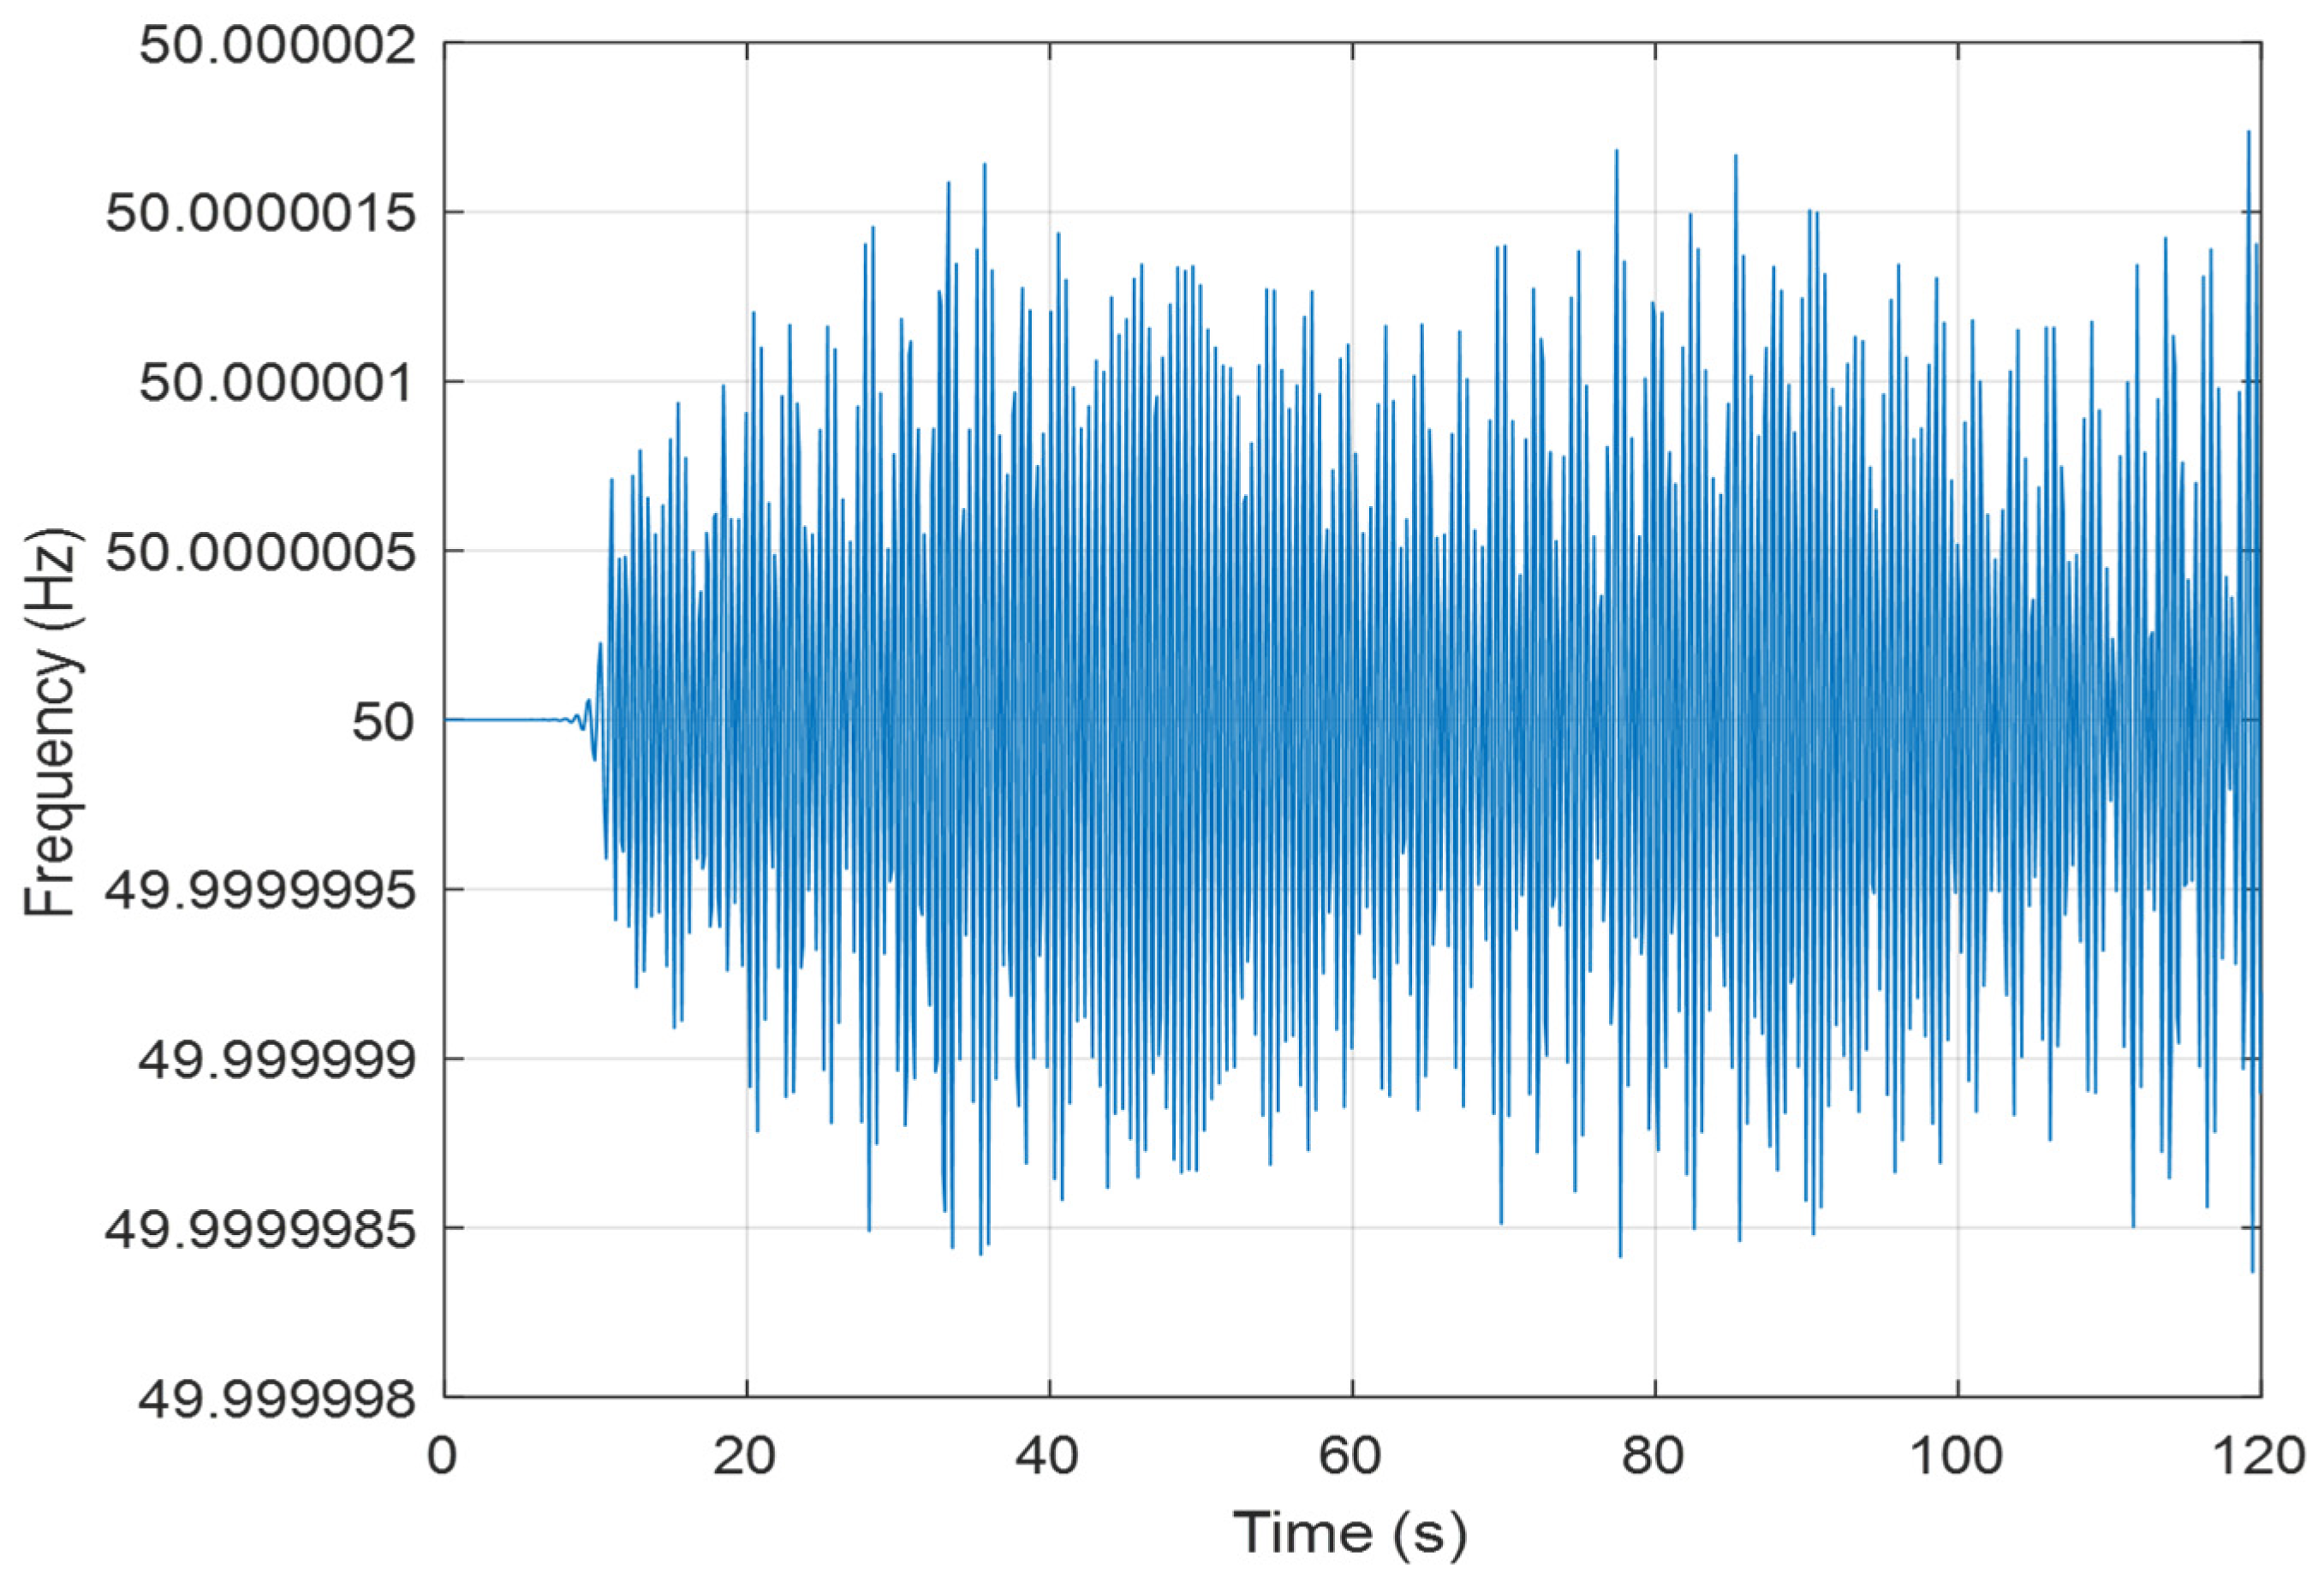
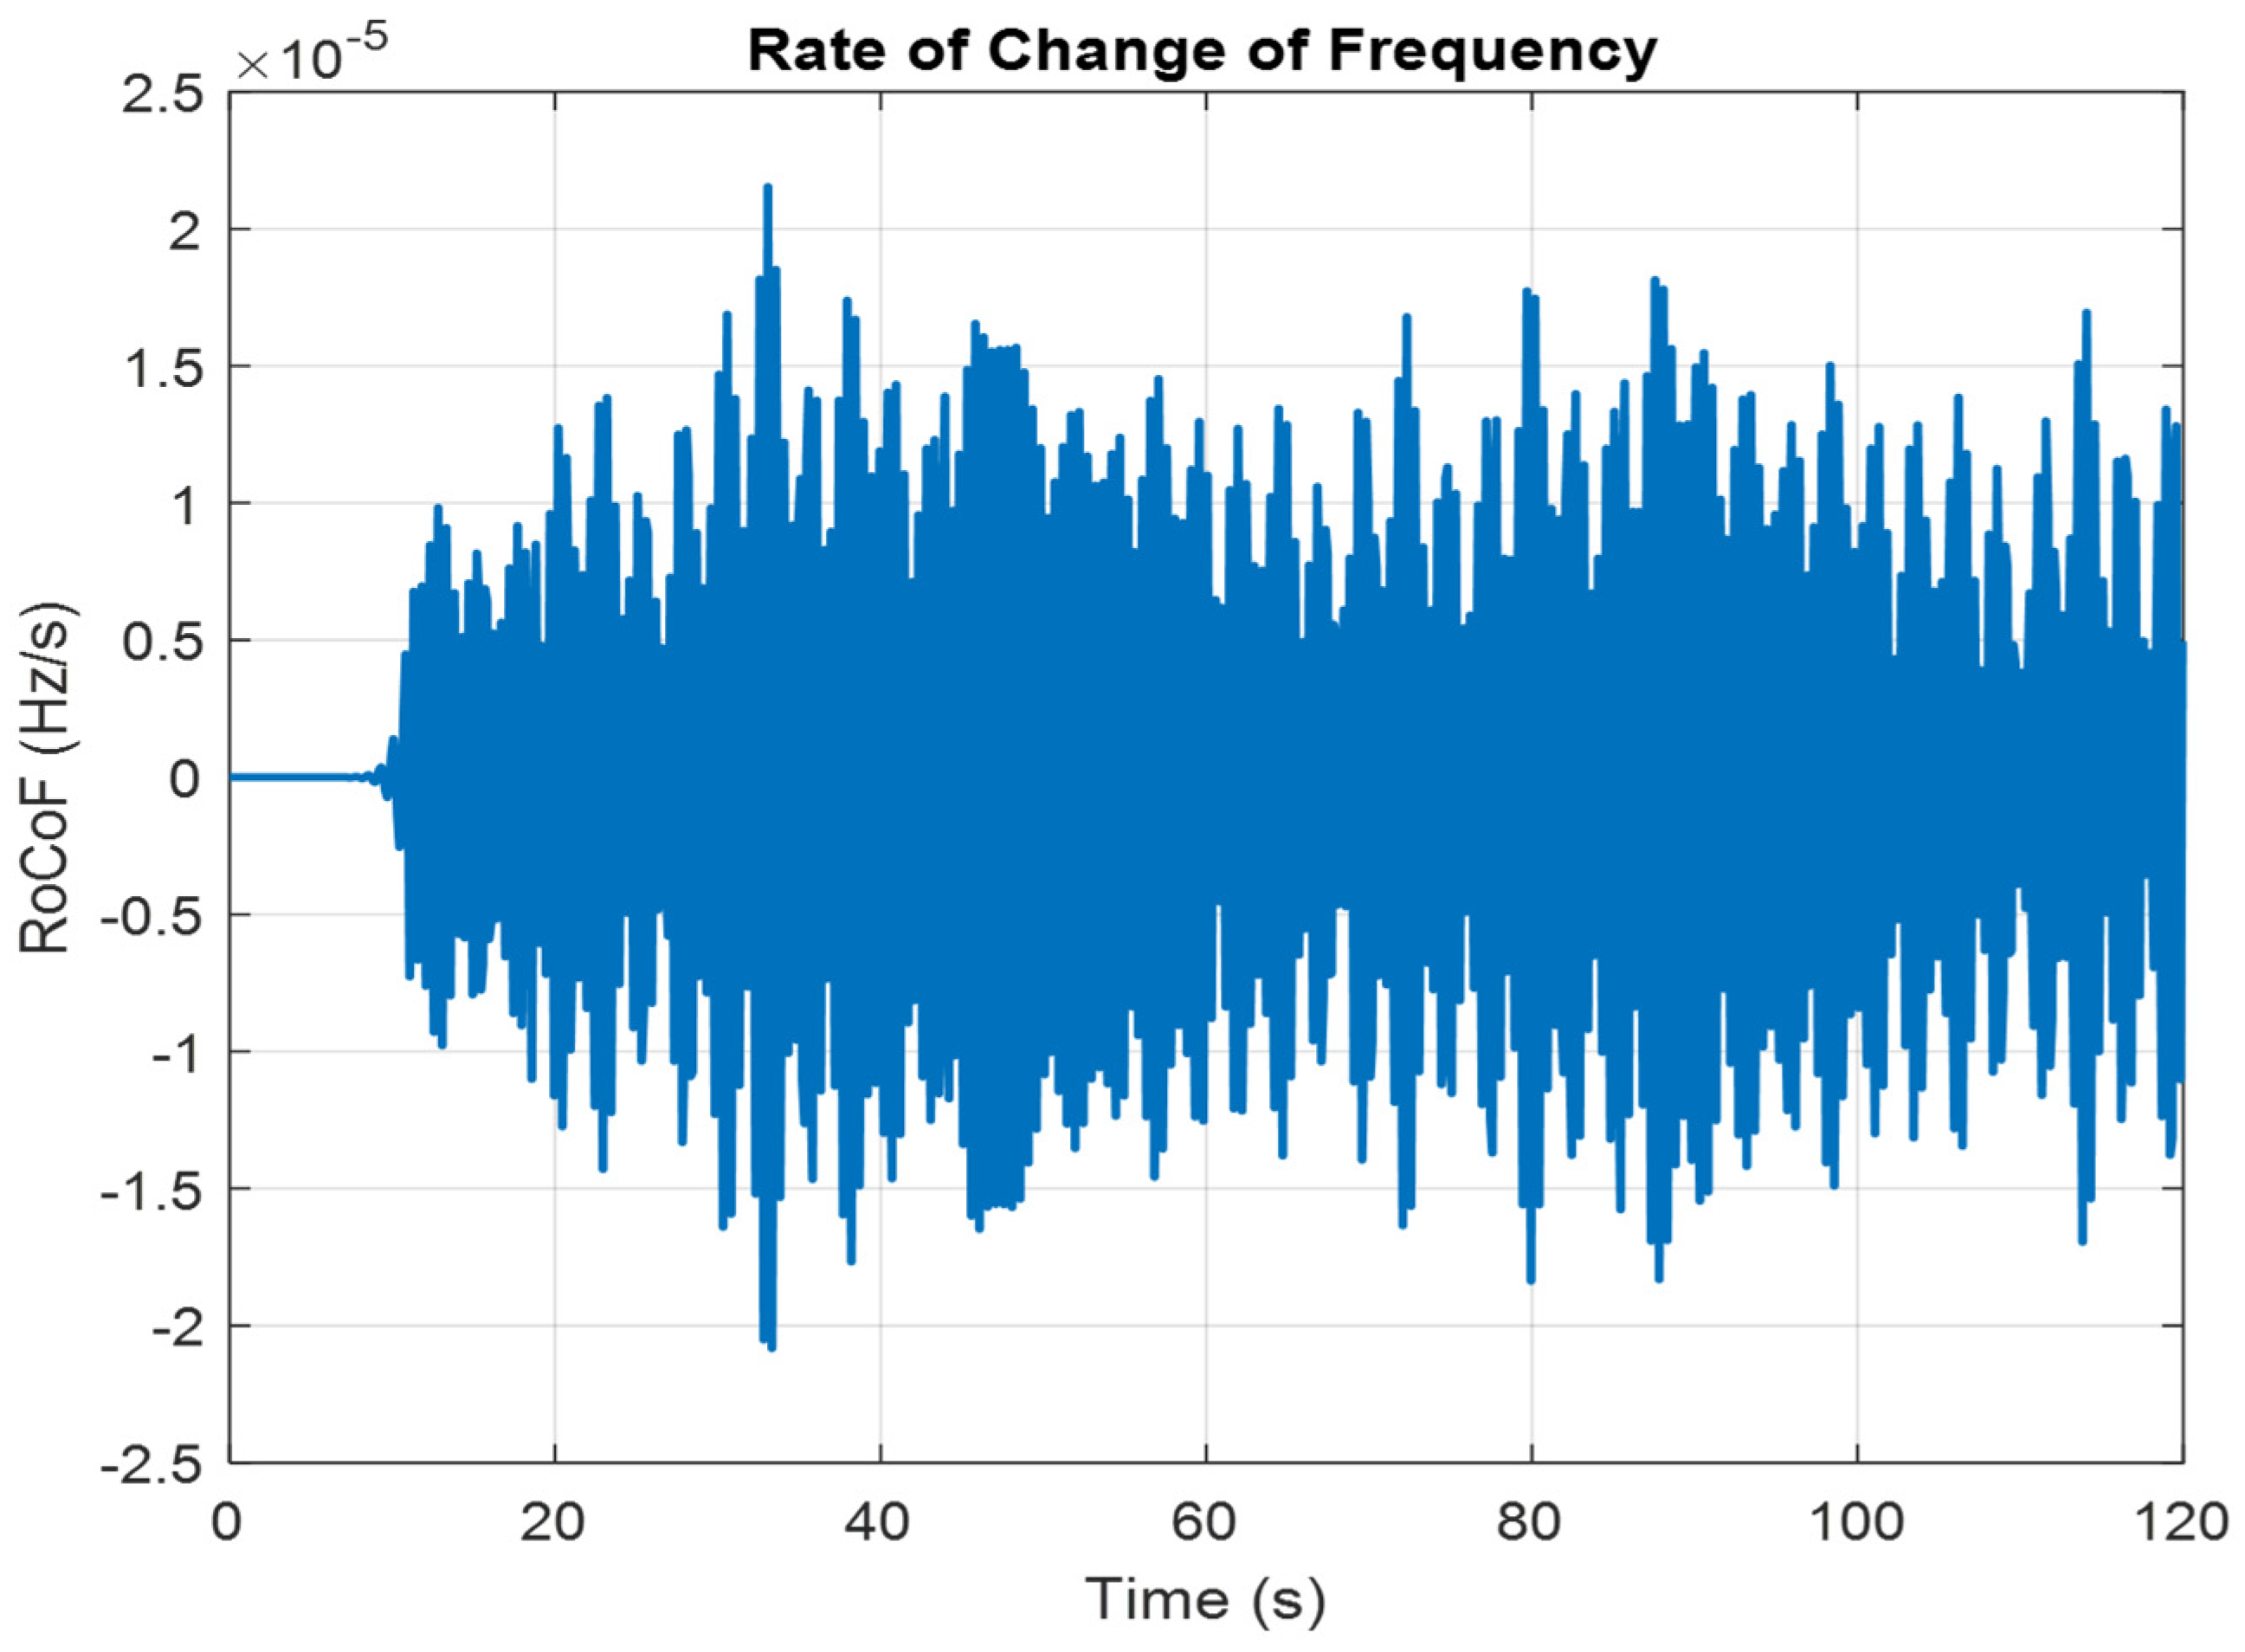
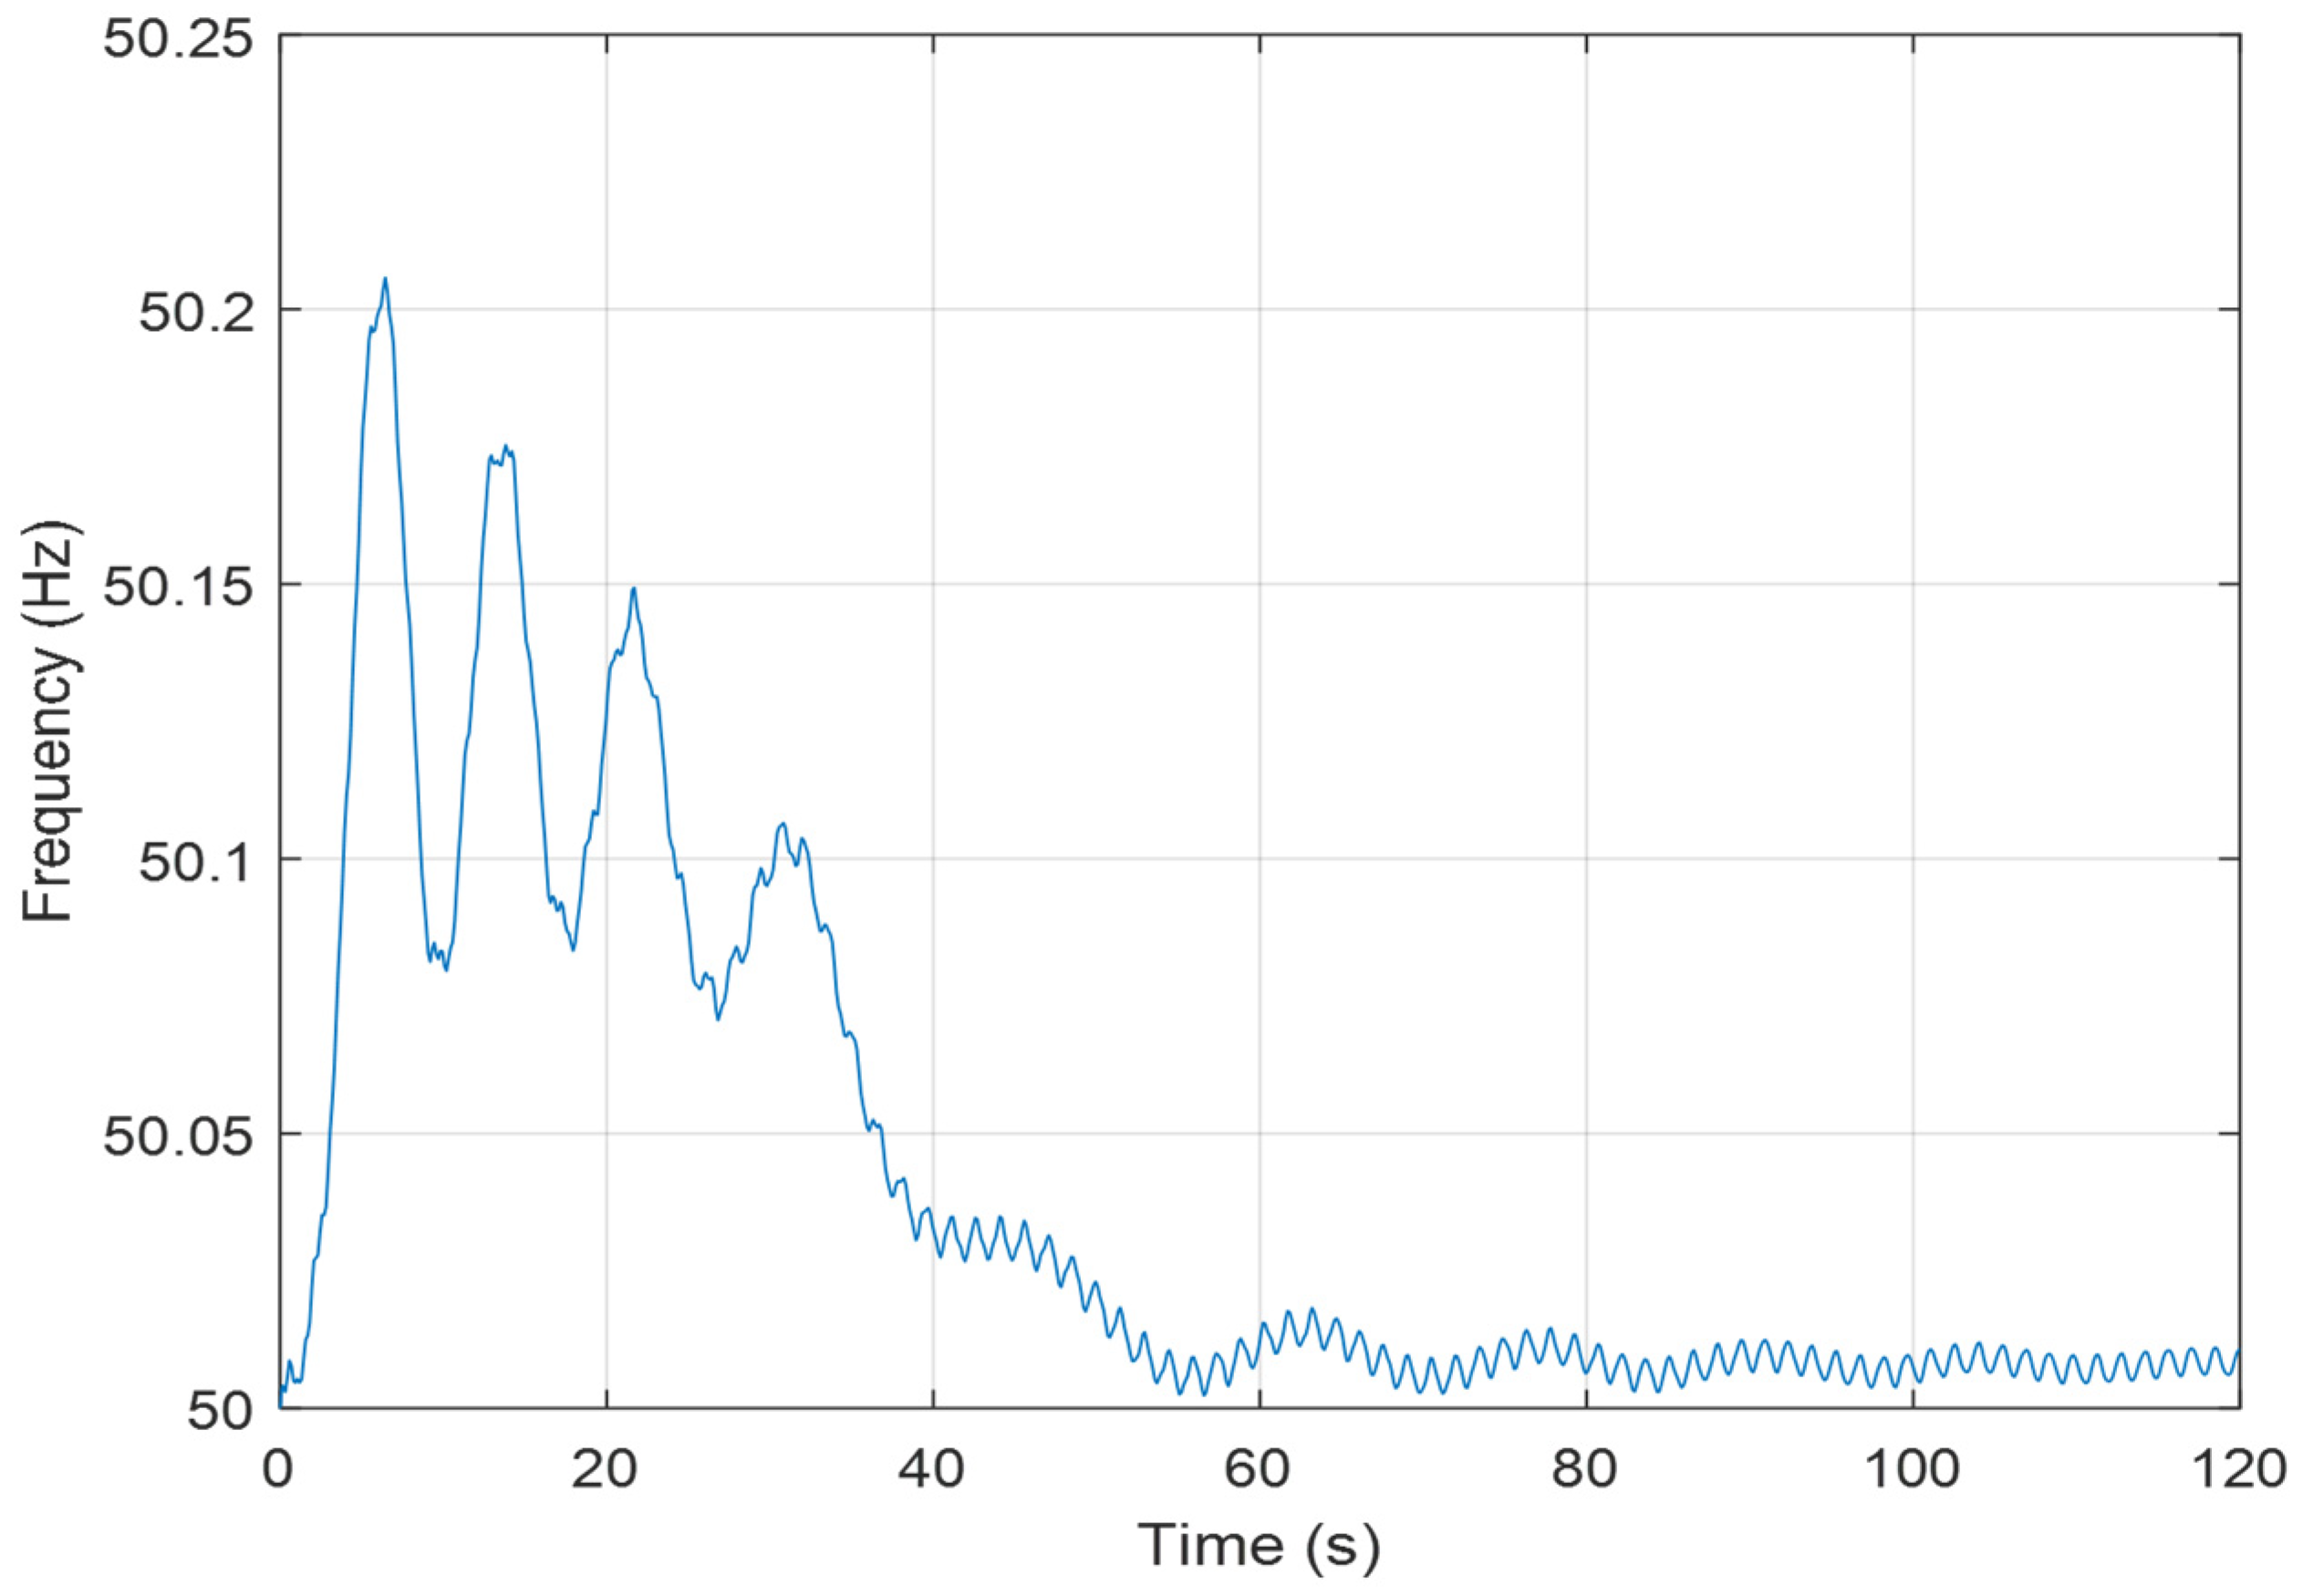
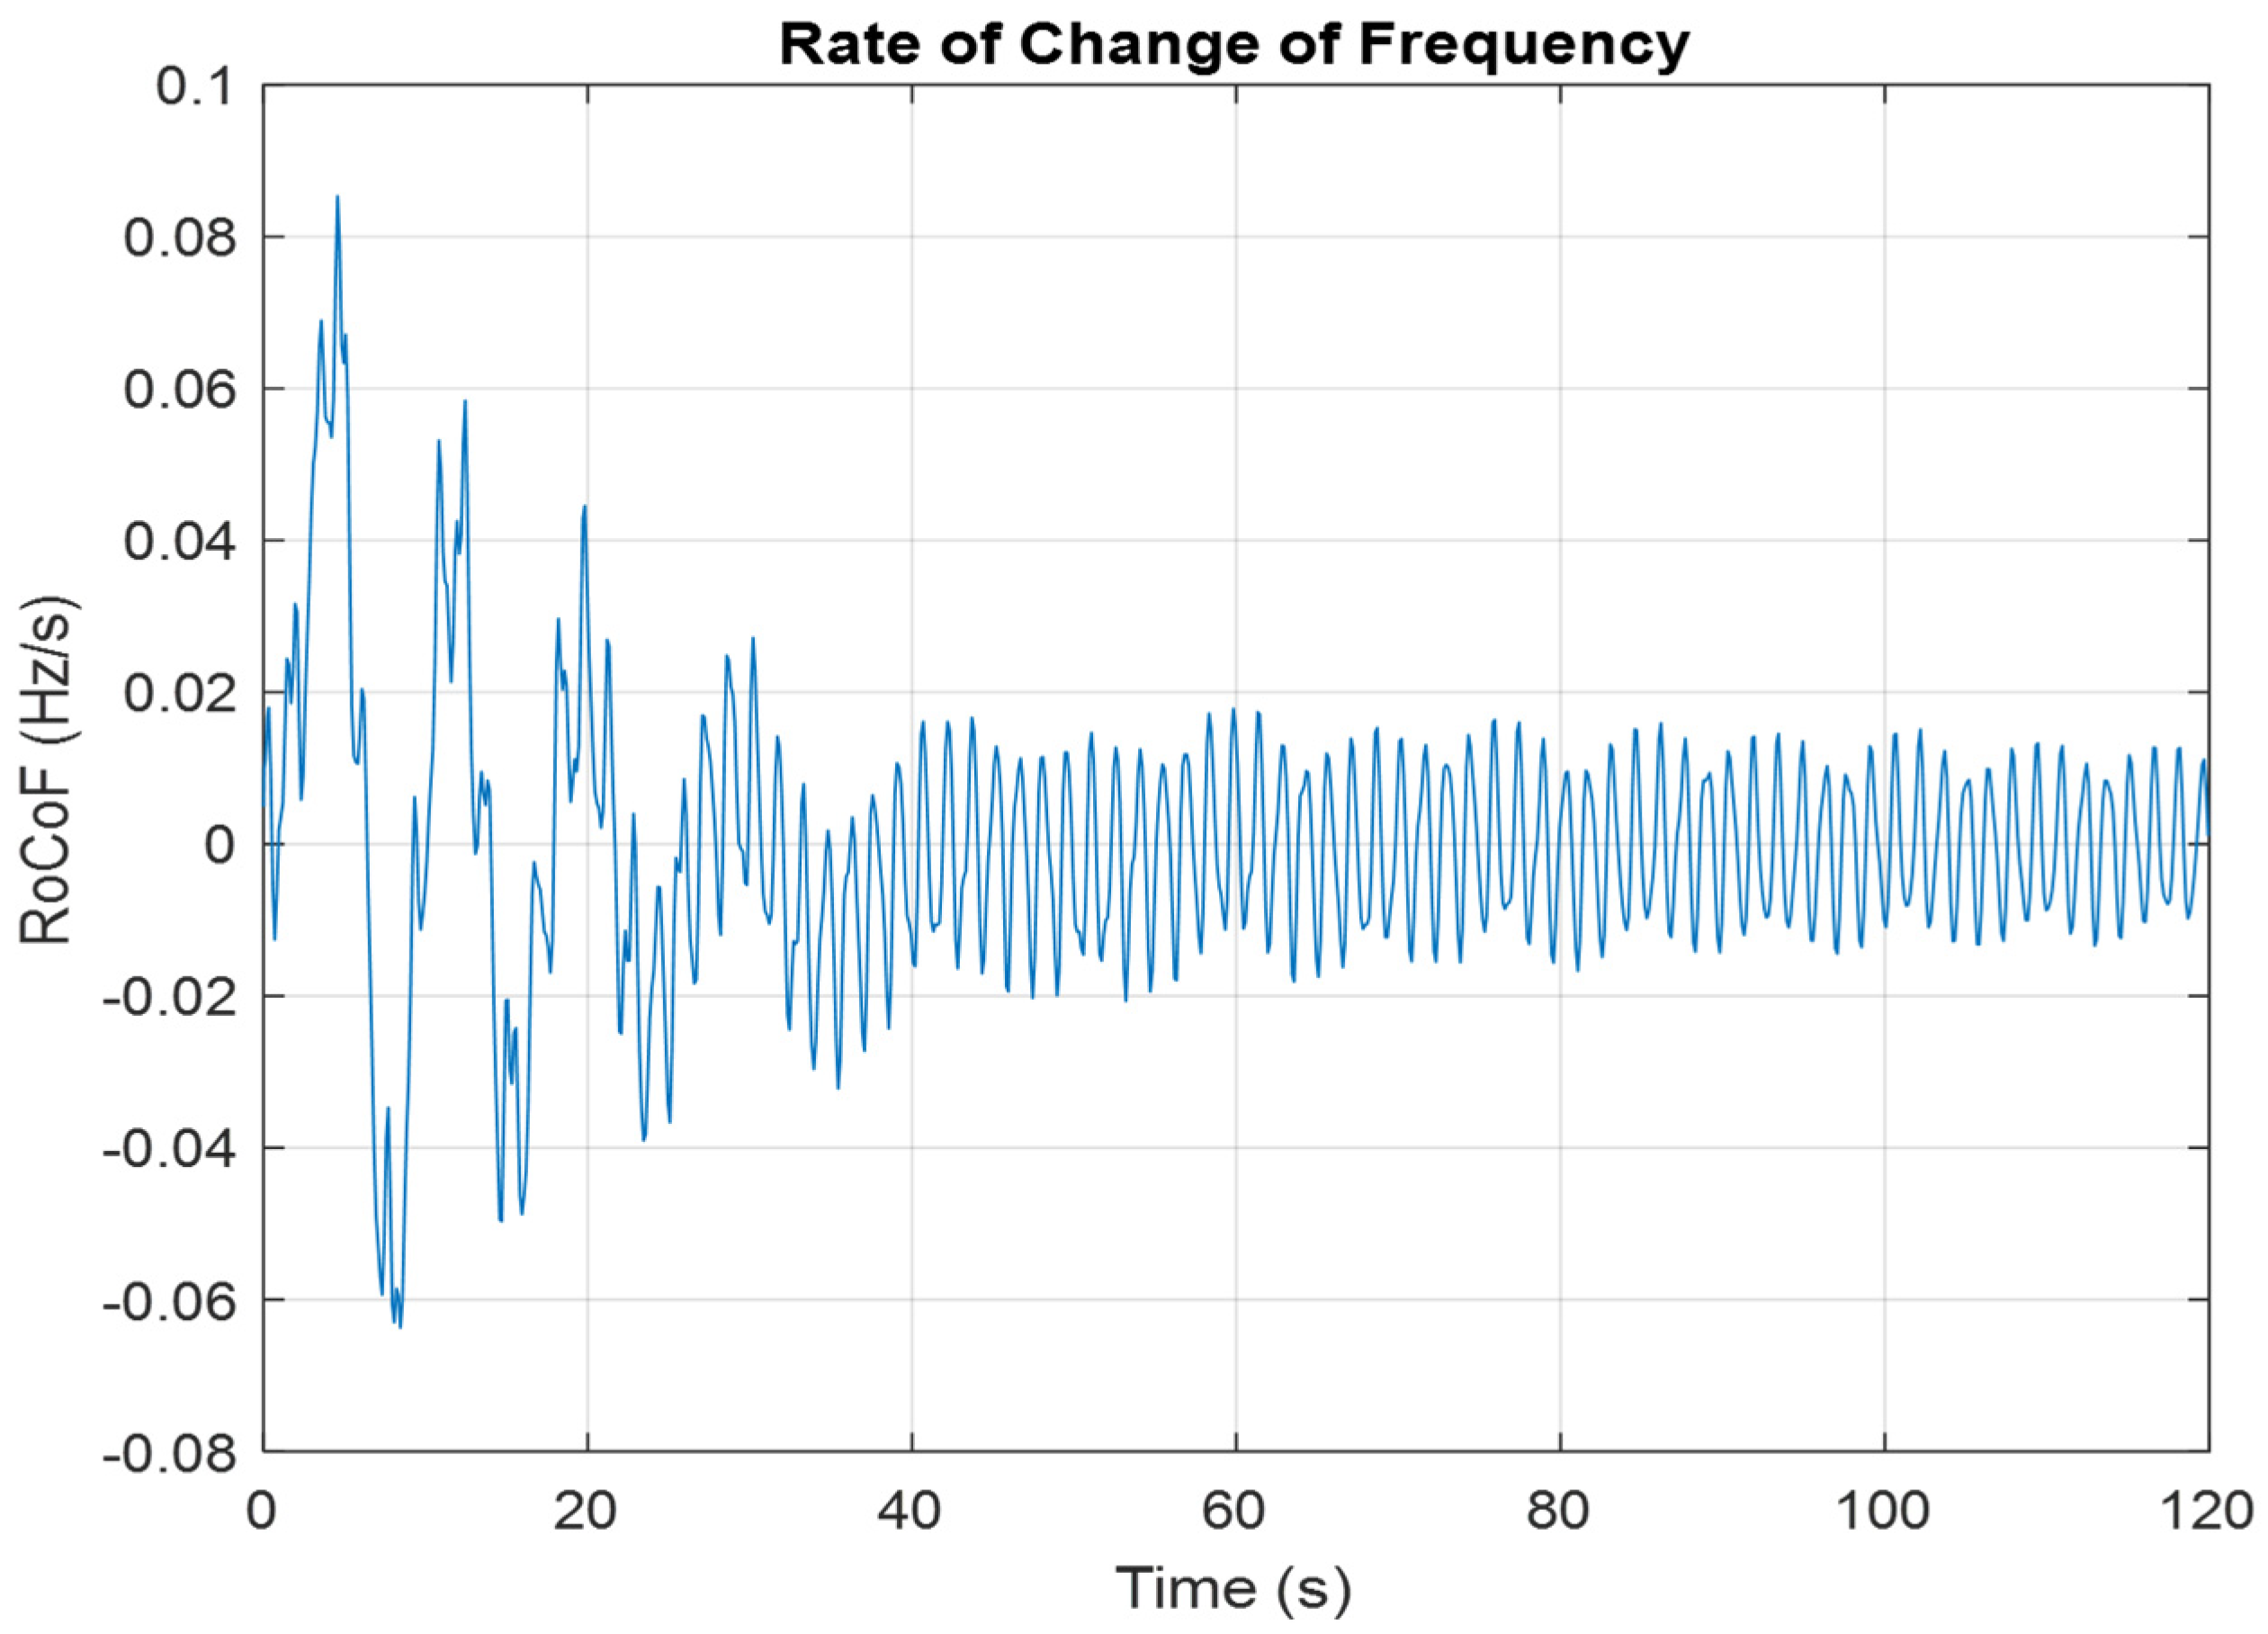
In this part a wind farm and solar PV generator have been integrated in the IEEE 39 bus power system. The voltage profile, frequency, and RoCoF are presented in Figure 8, Figure 9 and Figure 10.
  • Case 2: Integration of RES with a fault
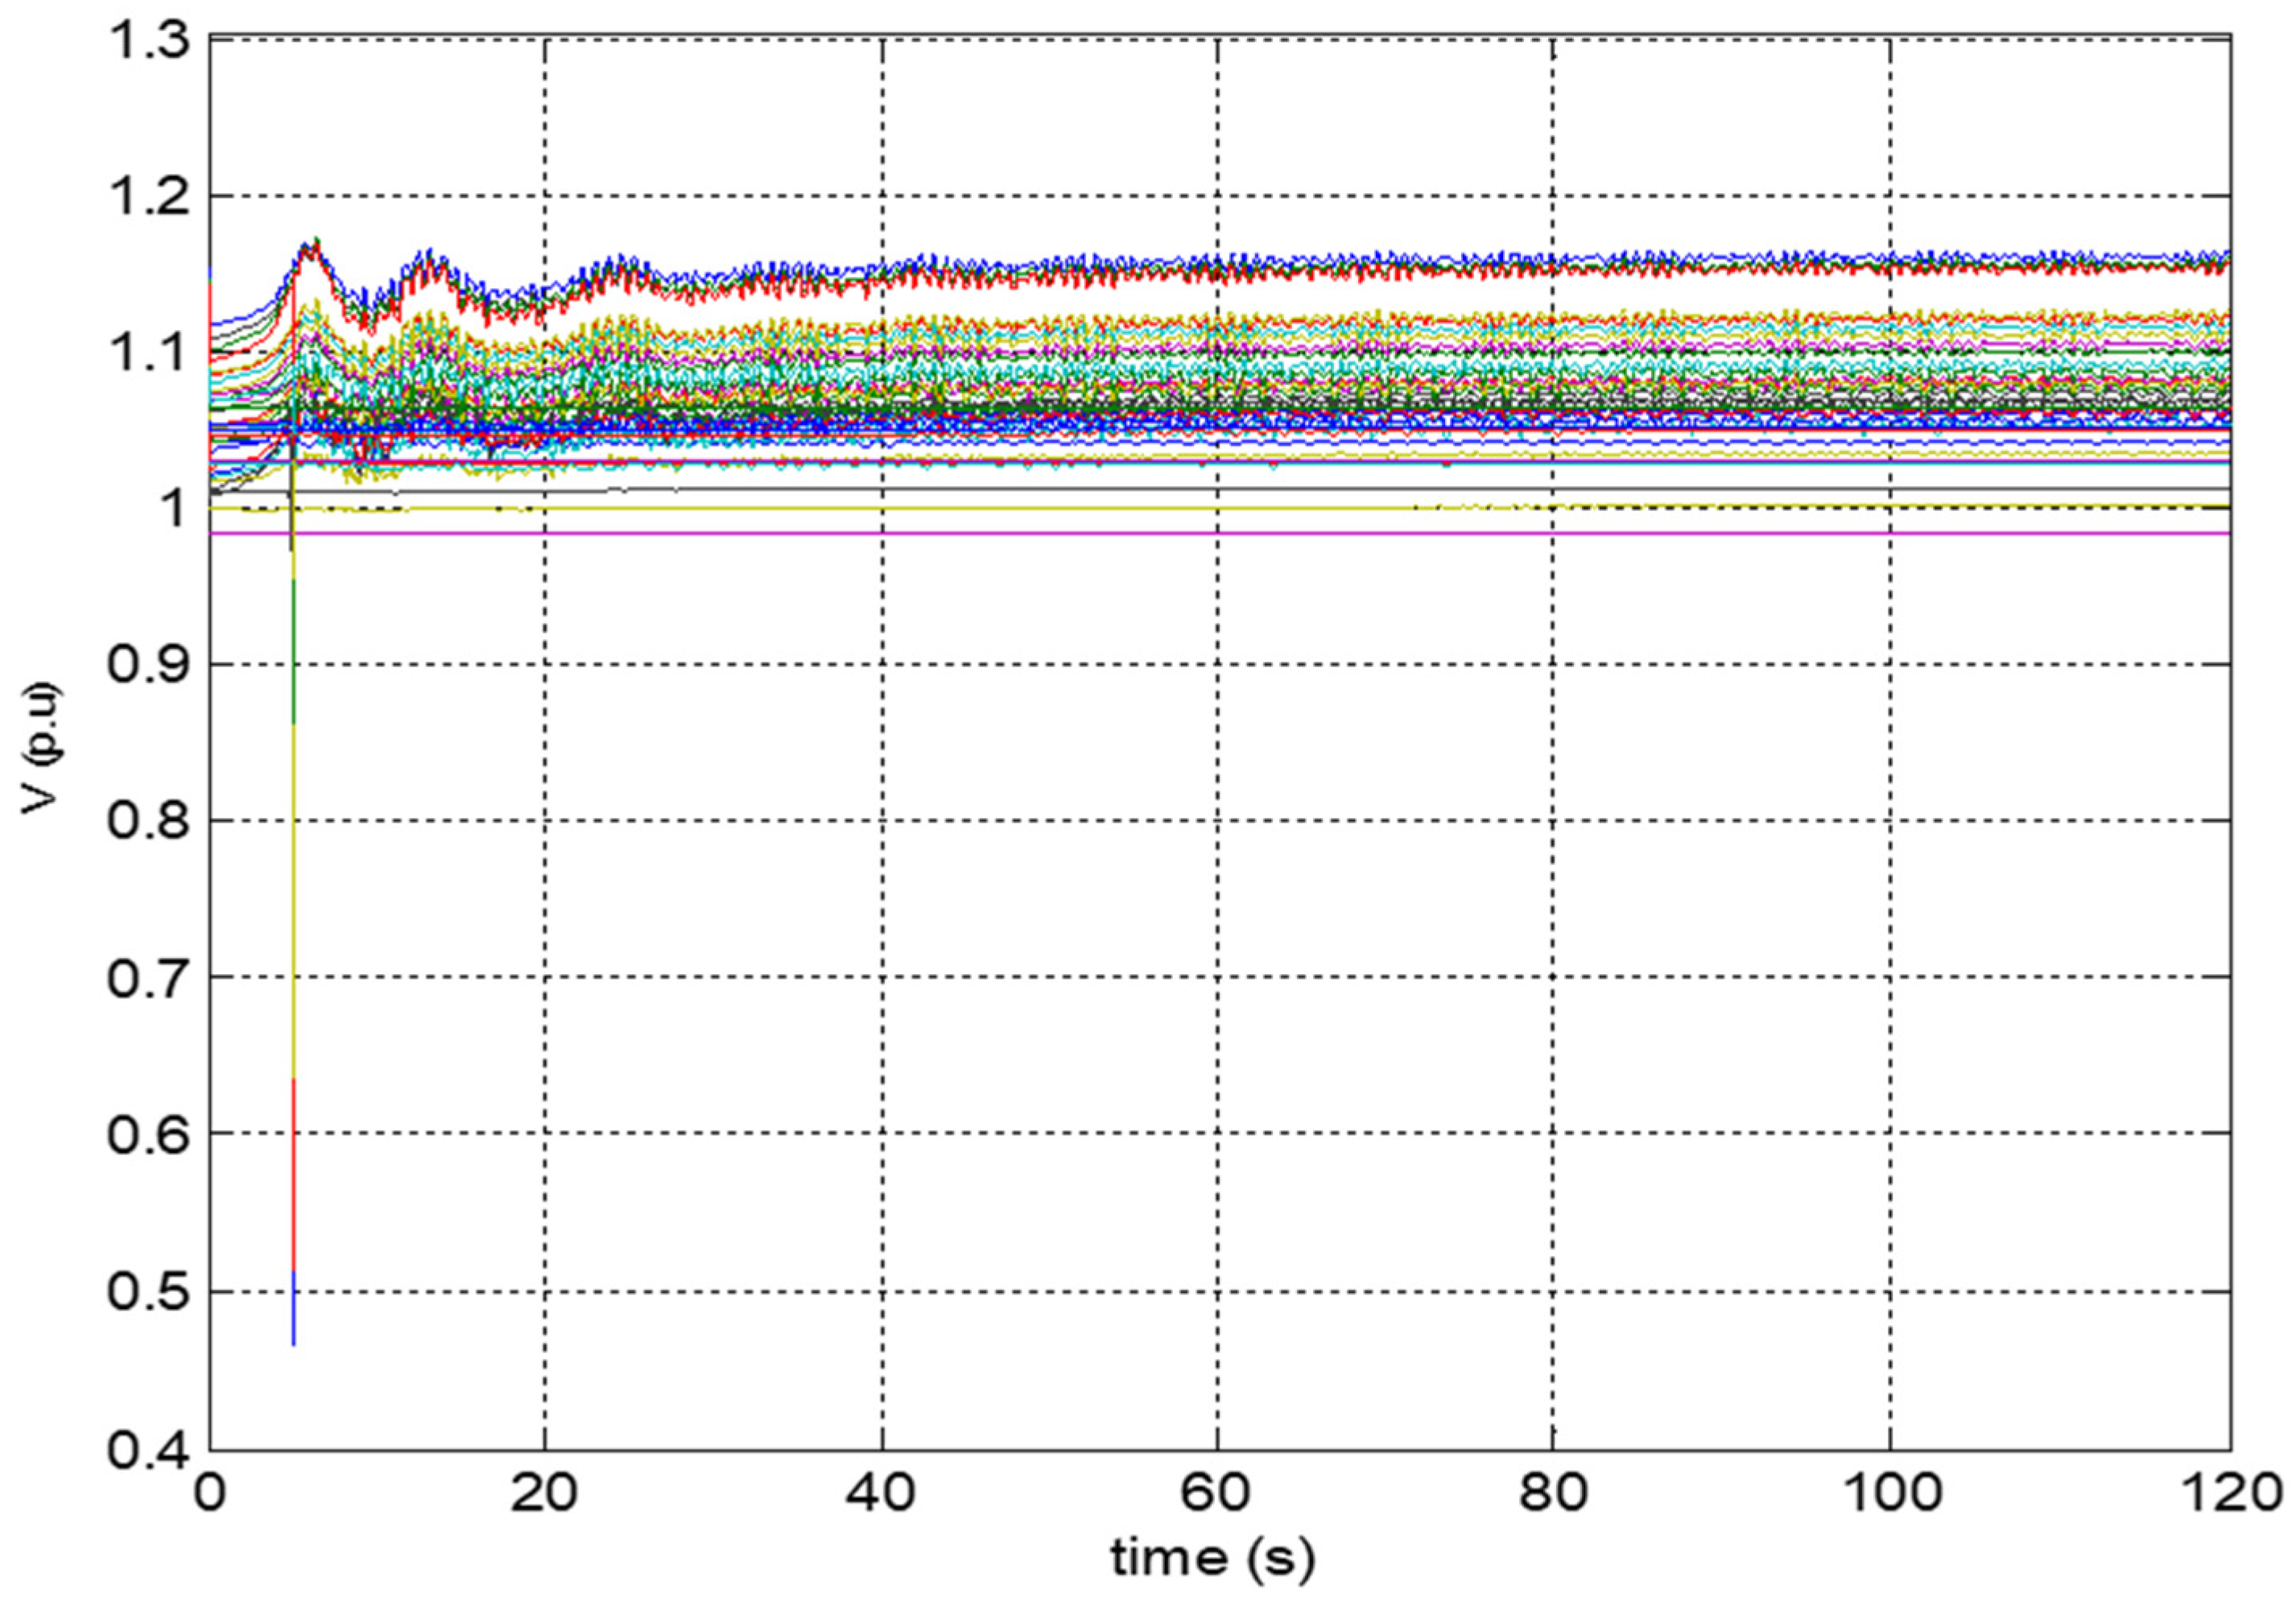
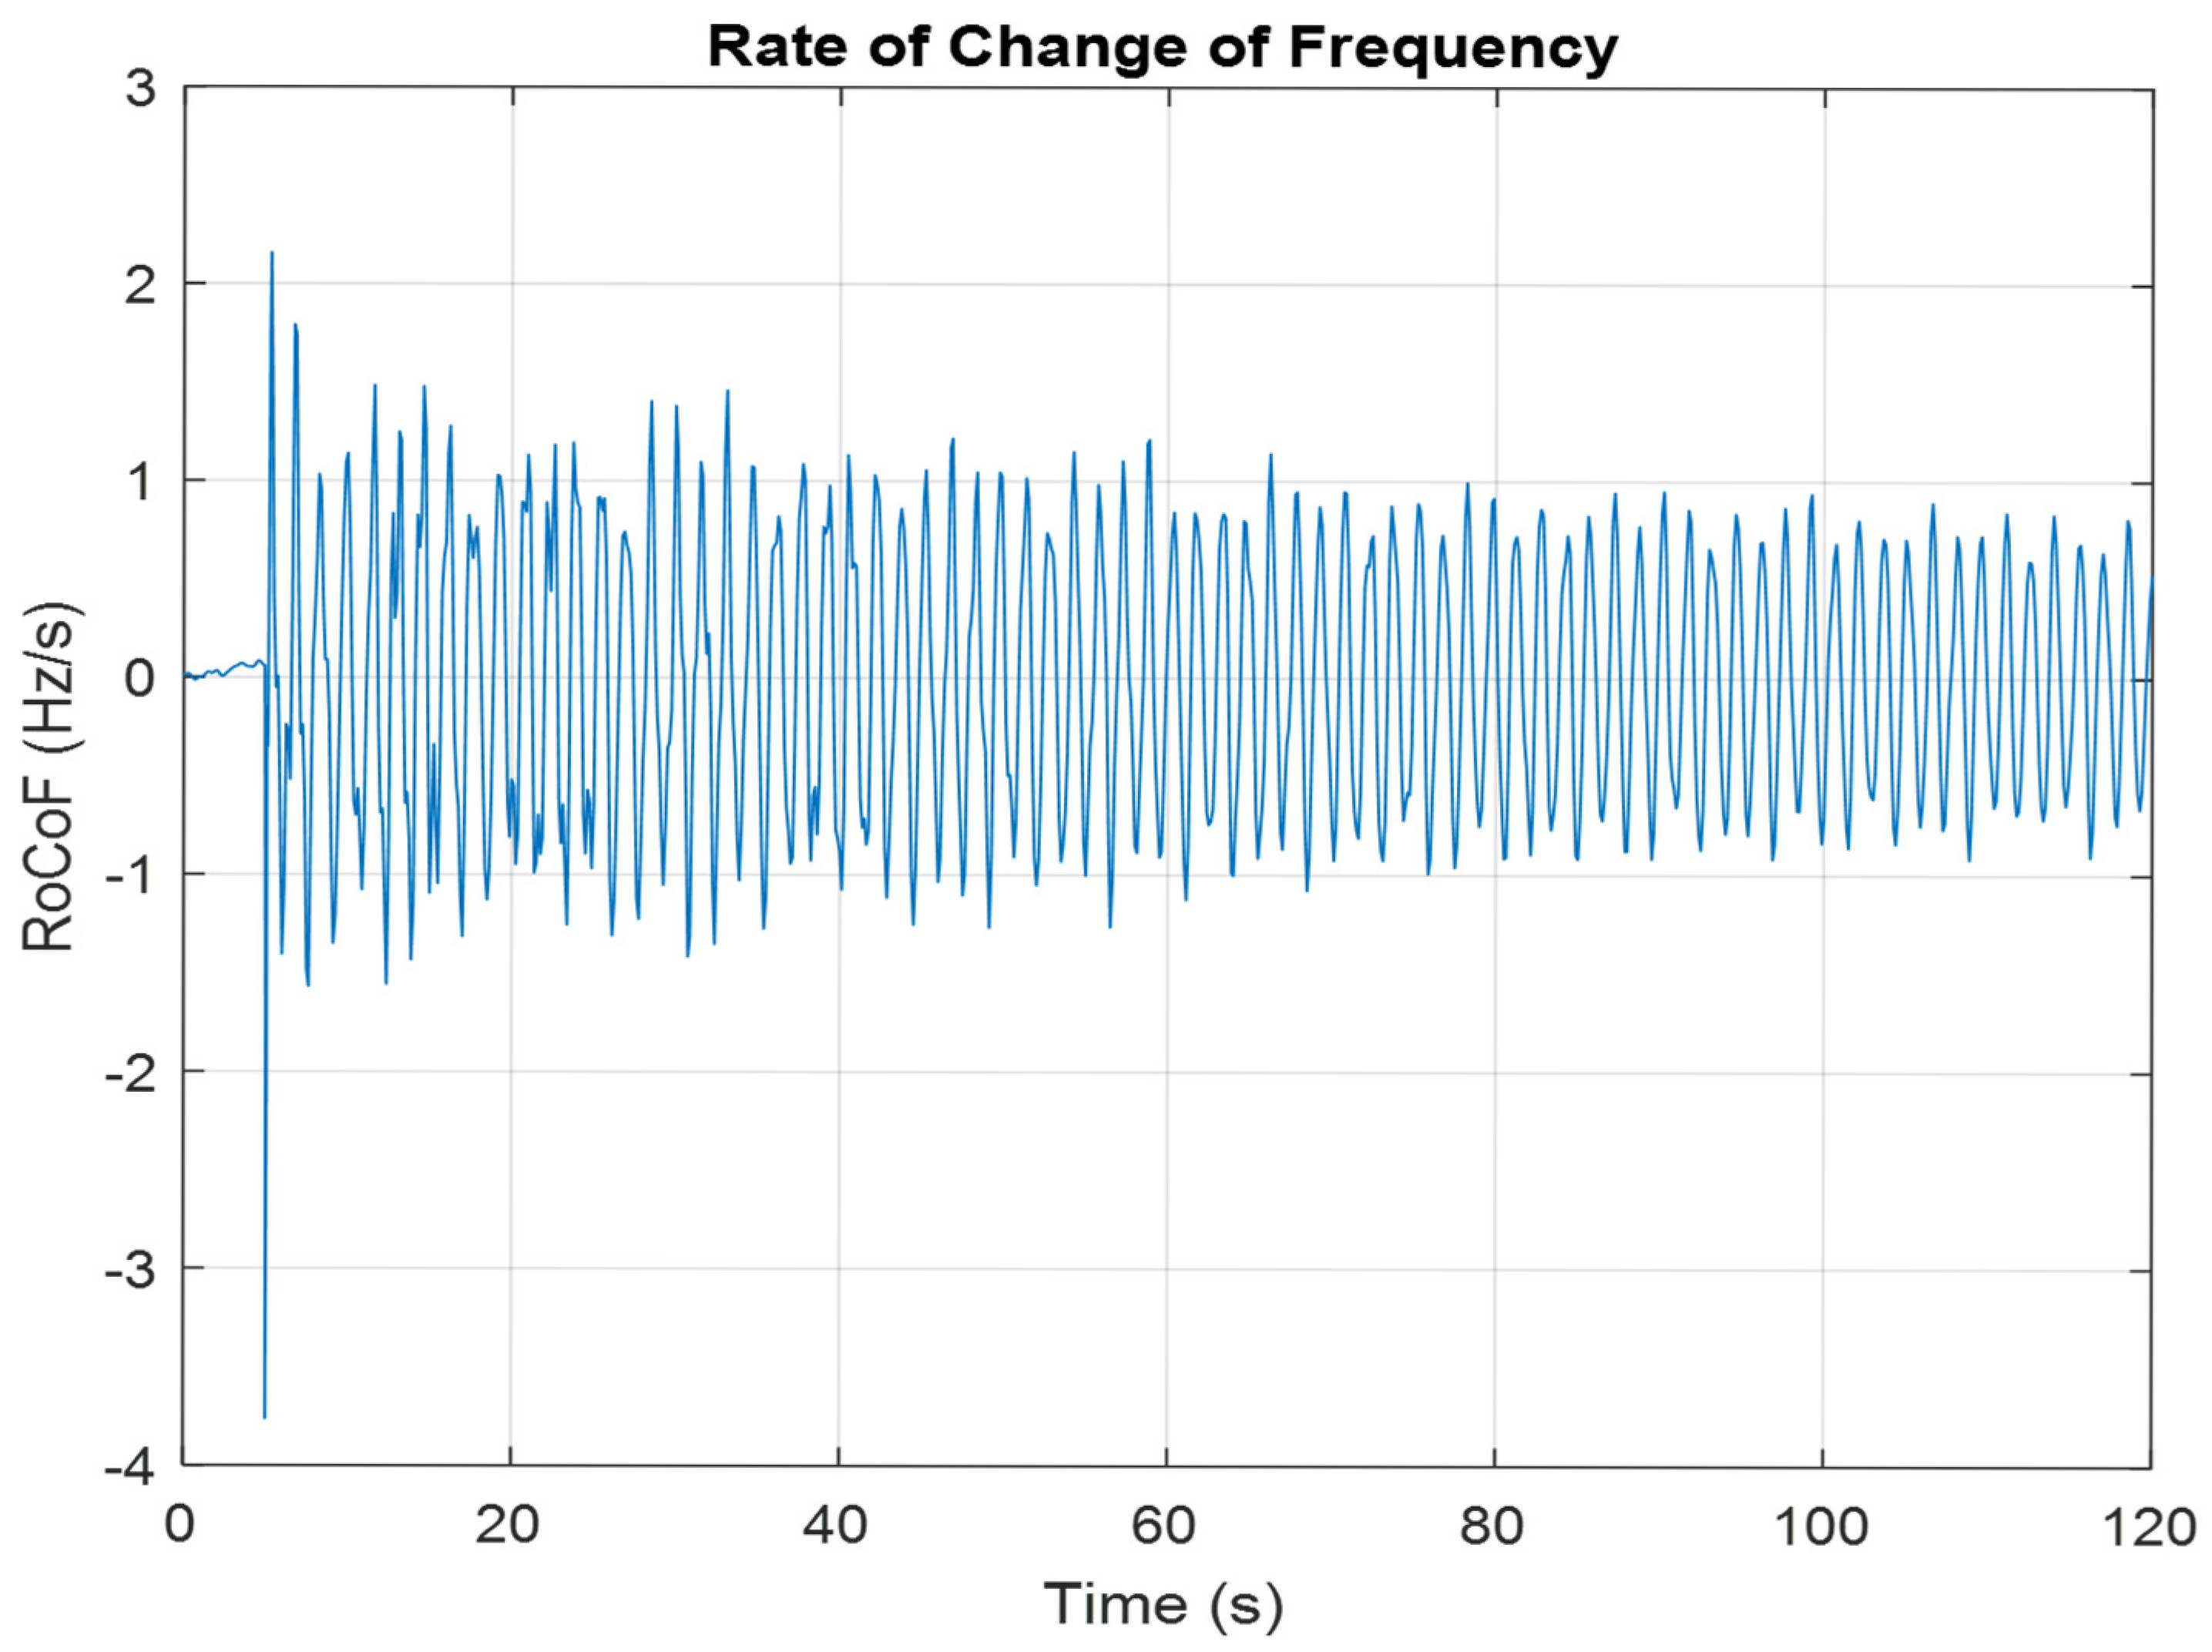
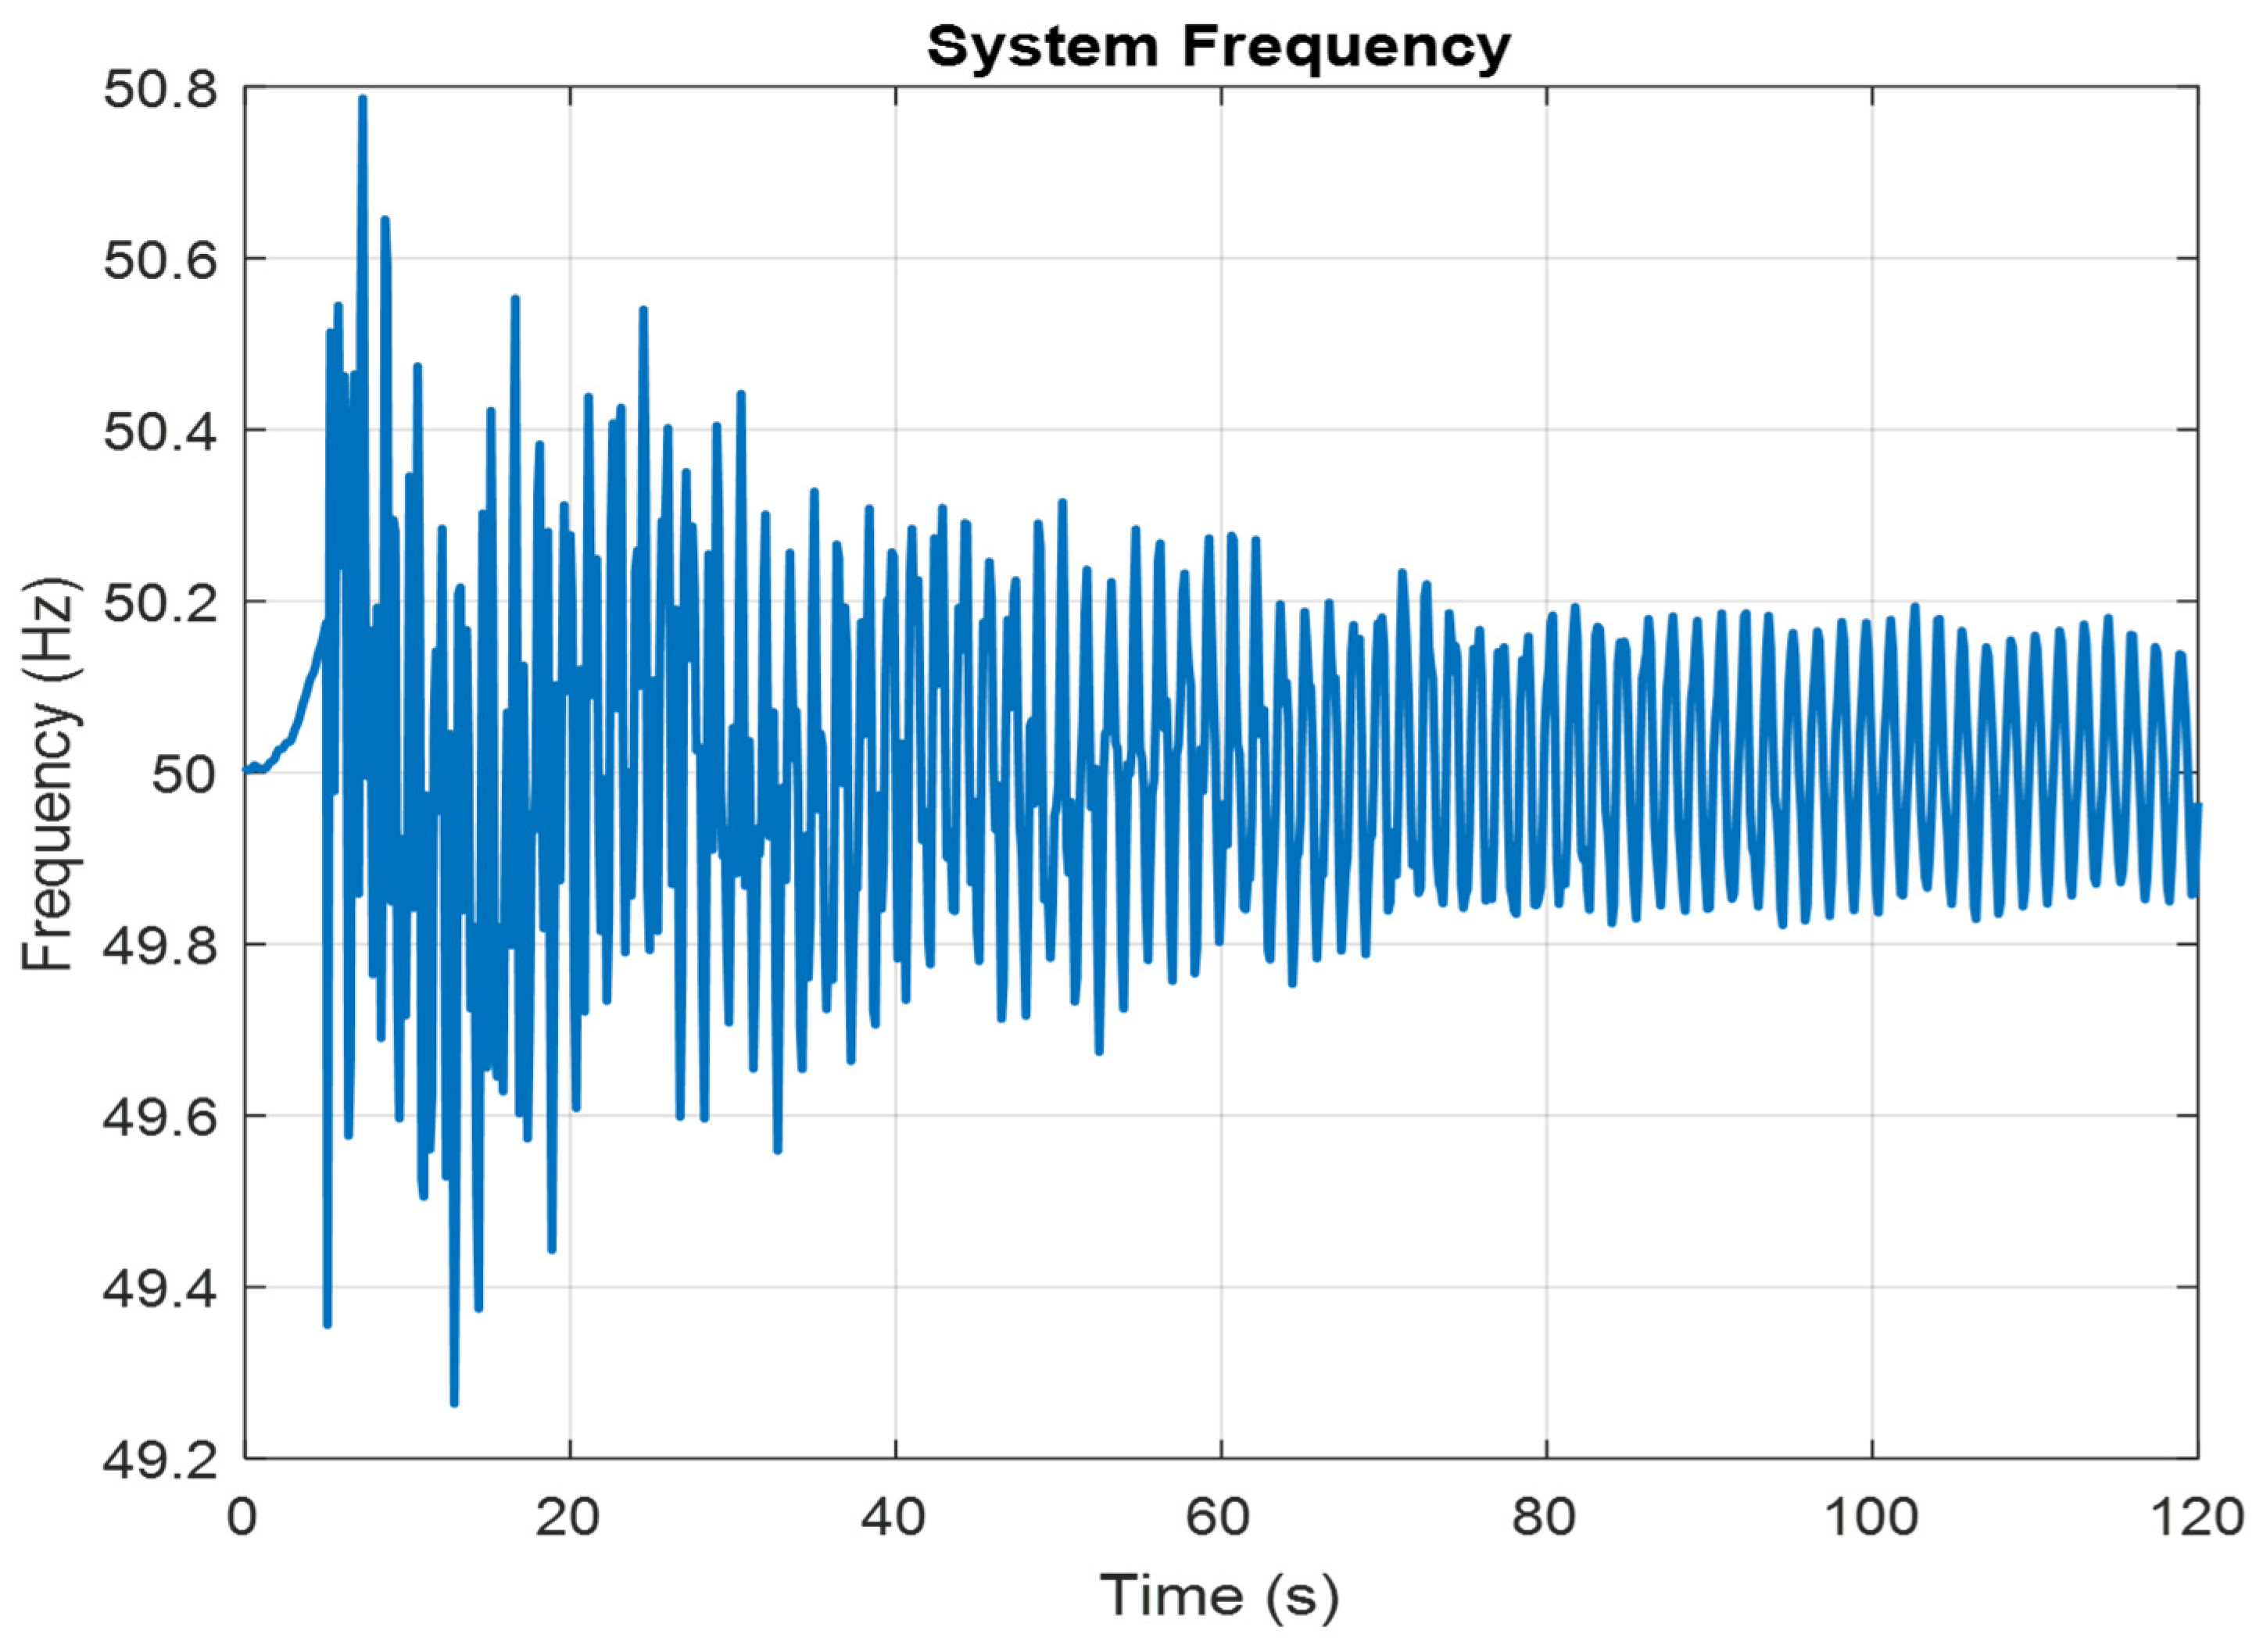
The RES integration was maintained, and a three-phase short-circuit fault was applied at bus 16 of the test system. The results are illustrated in Figure 11, Figure 12 and Figure 13.
The obtained results show that the integration of renewable energy sources (RES), particularly wind and photovoltaic units, significantly affects the transient and frequency stability of the studied power system. Increasing the RES penetration level leads to a reduction in the overall system inertia, which results in higher RoCoF values and modifications in the Critical Clearing Time (CCT).
The simulations indicate that an appropriate integration of RES can improve the voltage profile and increase the CCT through better power distribution within the network. However, a high penetration level of converter-based renewable sources may reduce the system capability to maintain synchronism after severe disturbances due to the limited inertial support provided by power electronic converters.
Several recent studies have proposed different approaches to improve the CCT and reduce the RoCoF, including virtual inertia techniques, energy storage systems, and fault current limiters. These methods enhance the dynamic stability of the power system but generally require advanced control strategies and additional equipment.
Unlike these approaches, the present work mainly focuses on the direct analysis of the impact of RES penetration level and connection location on the CCT and RoCoF indices in an interconnected IEEE test system. The obtained results highlight that the appropriate selection of RES connection buses and penetration levels plays an important role in improving the dynamic performance and overall stability of the electrical power system.

4. Conclusions

This paper has investigated the main criteria and methodologies used by power system operators to assess the integration of renewable energy sources (RES) into electrical networks. These approaches are generally based on performance indicators and stability indices that characterize the dynamic behavior of the system. Particular attention was given to system robustness and inertia, which play a fundamental role in maintaining stable operation under disturbances. In this context, stability indicators such as the Critical Clearing Time (CCT) and the Rate of Change of Frequency (RoCoF) were analyzed to evaluate the impact of RES integration on system dynamics.
The simulation results highlight that wind and photovoltaic generation can contribute to improving transient stability under certain operating conditions. However, at high penetration levels and under intermittent generation patterns, RES integration may also lead to a deterioration of system stability due to the reduction of effective system inertia. Through a systematic analysis of the influence of RES penetration on frequency stability and rotor angle dynamics, this study provides valuable insights into the nonlinear behavior of modern low-inertia power systems. The results indicate that although the integration of renewable energy is essential for a sustainable energy transition, clear limits must be considered to ensure that the penetration level does not compromise the dynamic stability of the power network.
Therefore, by carefully evaluating stability indices such as CCT and RoCoF, system operators can establish reliable criteria for the secure integration of renewable energy sources. The proposed analysis framework provides useful guidance for assessing and managing the safe integration of RES in modern power systems.

Author Contributions

Conceptualization, A.B. and N.E.Y.K.; methodology, A.B.; software, A.B. and N.E.Y.K.; validation, A.B., N.E.Y.K. and A.A.L.; formal analysis, A.B.; investigation, A.B.; resources, N.E.Y.K. and A.A.L.; data curation, A.B.; writing—original draft preparation, A.B.; writing—review and editing, A.B.; visualization, A.B.; supervision, N.E.Y.K. and A.A.L.; project administration, N.E.Y.K. All authors have read and agreed to the published version of the manuscript.

Funding

This research received no external funding.

Institutional Review Board Statement

Not applicable.

Informed Consent Statement

Not applicable.

Data Availability Statement

The original contributions presented in this study are included in the article. Further inquiries can be directed to the corresponding author.

Conflicts of Interest

The authors declare no conflicts of interest.

References

  1. Zain ul Abideen, M.; Ellabban, O.; Al-Fagih, L. A review of the tools and methods for distribution networks’ hosting capacity calculation. Energies 2020, 13, 2758. [Google Scholar] [CrossRef] [Scilit]
  2. Kouba, N.E.Y.; Sadoudi, S. Optimal Energy Management of Hybrid MicroGrid Using Storage System and Fuzzy-GA Method. J. Renew. Energ. 2022, 1, 129–141. [Google Scholar] [CrossRef] [Scilit]
  3. Guo, J.; Wang, X.; Ooi, B.-T. Estimation of inertia for synchronous and non-synchronous generators based on ambient measurements. IEEE Trans. Power Syst. 2021, 37, 3747–3757. [Google Scholar] [CrossRef] [Scilit]
  4. Saleem, M.I.; Saha, S.; Roy, T.K.; Ghosh, S.K. Assessment and management of frequency stability in low inertia renewable energy rich power grids. IET Gener. Transm. Distrib. 2024, 18, 1372–1390. [Google Scholar] [CrossRef] [Scilit]
  5. Zheng, C.; Jones, K.W.; Dong, Y.; Gopalakrishnan, A.; Aquiles-Perez, S.G.; Culpepper, C.T. Optimizing underfrequency load shedding strategies in converter-dominated networks. In IET Conference Proceedings CP875; The Institution of Engineering and Technology: Stevenage, UK, 2024; pp. 257–263. [Google Scholar]
  6. Alqahtani, S.; Shaher, A.; Garada, A.; Cipcigan, L. Impact of the high penetration of renewable energy sources on the frequency stability of the Saudi grid. Electronics 2023, 12, 1470. [Google Scholar] [CrossRef] [Scilit]
  7. Aigul Sauletzhanovna, T.; Majed Althahabi, A.; Khalid, R.; Al Mansor, A.H.O.; Al-Tameemi, A.R.; Hlail, S.H. The Nexus between renewable energy sources and electrical distribution systems. J. Oper. Autom. Power Eng. 2023, 11, 15–20. [Google Scholar]
  8. Gu, H.; Yan, R.; Saha, T. Review of system strength and inertia requirements for the national electricity market of Australia. CSEE J. Power Energy Syst. 2019, 5, 295–305. [Google Scholar] [CrossRef] [Scilit]
  9. Brik, A.; Kouba, N.E.Y.; Ladjici, A.A. Power system transient stability analysis considering short-circuit faults and renewable energy sources. Eng. Proc. 2024, 67, 42. [Google Scholar]
  10. Gu, H.; Yan, R.; Saha, T.K. Minimum synchronous inertia requirement of renewable power systems. IEEE Trans. Power Syst. 2017, 33, 1533–1543. [Google Scholar] [CrossRef] [Scilit]
  11. Areed, E.F.; Alcaide-Godinez, I. Large-scale renewable energy penetration impact on system stability. In 2021 IEEE PES Innovative Smart Grid Technologies-Asia (ISGT Asia); IEEE: New York, NY, USA, 2021; pp. 1–5. [Google Scholar]
  12. Yan, R.; Masood, N.-A.; Saha, T.K.; Bai, F.; Gu, H. The anatomy of the 2016 South Australia blackout: A catastrophic event in a high renewable network. IEEE Trans. Power Syst. 2018, 33, 5374–5388. [Google Scholar] [CrossRef] [Scilit]
  13. Kim, D.; Cho, H.; Park, B.; Lee, B. Evaluating influence of inverter-based resources on system strength considering inverter interaction level. Sustainability 2020, 12, 3469. [Google Scholar] [CrossRef] [Scilit]
  14. El Wejhani, S.; Elleuch, M.; Tnani, S.; Ben Kilani, K.; Ennine, G. Renewable energy integration in power system: Clarification on stability indices. In 2022 IEEE International Conference on Electrical Sciences and Technologies in Maghreb (CISTEM); IEEE: New York, NY, USA, 2022; pp. 1–6. [Google Scholar]
  15. Njoka, G.M.; Mogaka, L.; Wangai, A. Impact of variable renewable energy sources on the power system frequency stability and system inertia. Energy Rep. 2024, 12, 4983–4997. [Google Scholar] [CrossRef] [Scilit]
  16. SPD–Inertia TF. Inertia and Rate of Change of Frequency (Rocof); Technical Report; ENTSO-E: Brussels, Belgium, 2020. [Google Scholar]
  17. Banjar-Nahor, K.M.; Garbuio, L.; Debusschere, V.; Hadjsaid, N.; Pham, T.-T.; Sinisuka, N. Critical Clearing Time Transformation Upon Renewables Integration through Static Converters, A Case in Microgrids. In Proceedings of the 19th International Conference on Industrial Technology (ICIT 2018); IEEE: New York, NY, USA, 2018. [Google Scholar]
  18. Peyghami, S.; Blaabjerg, F.; Palensky, P. Incorporating power electronic converters reliability into modern power system reliability analysis. IEEE J. Emerg. Sel. Top. Power Electron. 2022, 9, 1668–1681. [Google Scholar] [CrossRef] [Scilit]
Figure 1. WSCC-IEEE 39 bus power system model.
Engproc 138 00010 g001
Figure 2. Bus voltage.
Engproc 138 00010 g002
Figure 3. Bus voltage with fault.
Engproc 138 00010 g003
Figure 4. Frequency Deviation.
Engproc 138 00010 g004
Figure 5. Rocof.
Figure 5. Rocof.
Engproc 138 00010 g005
Figure 6. Frequencyduring generator loss.
Engproc 138 00010 g006
Figure 7. Rocof during generator loss.
Engproc 138 00010 g007
Figure 8. Bus voltage with RES integration.
Engproc 138 00010 g008
Figure 9. Frequency Deviation with RES.
Engproc 138 00010 g009
Figure 10. Rocof.
Figure 10. Rocof.
Engproc 138 00010 g010
Figure 11. Bus voltage with RES integration and a 3-phase short-circuit fault.
Engproc 138 00010 g011
Figure 12. System frequencywith RES integration and 3-phase short-circuit fault.
Engproc 138 00010 g012
Figure 13. Rocof.
Figure 13. Rocof.
Engproc 138 00010 g013
Table 1. Generator power.
GeneratorG1G2G3G4G5G6G7G8G9G10
Damping(s)8448.66969.6100052.857.25271.660.6
Disclaimer/Publisher’s Note: The statements, opinions and data contained in all publications are solely those of the individual author(s) and contributor(s) and not of MDPI and/or the editor(s). MDPI and/or the editor(s) disclaim responsibility for any injury to people or property resulting from any ideas, methods, instructions or products referred to in the content.