1. Introduction
Bridges are important transportation infrastructure that support connectivity and economic development. Suspension bridges are commonly used for long-span cross-ings because of their structural efficiency and ability to span wide rivers. How-ever, bridges over rivers are highly vulnerable to floods and scour, which can threaten structural stability and cause bridge failure [
1]. Climate change and increasing ex-treme rainfall events have further intensified bridge vulnerability to hydraulic haz-ards [
2].
Flood water level profile analysis is essential in hydraulic bridge engineering be-cause it evaluates water surface elevations, flow velocity, and backwater effects dur-ing flood events. These parameters are important for determining bridge elevation, freeboard, and foundation depth. Hydraulic modeling tools such as HEC-RAS are widely used to simulate river flow behavior around bridge structures [
3]. Previous studies showed that hydraulic structures significantly affect river flow characteristics and flood water levels [
4], while hydraulic instability may intensify sediment transport and local scour around bridge foundations [
5].
Scour is recognized as one of the leading causes of bridge foundation failure worldwide [
6]. Excessive scour can reduce foundation stability and load-bearing ca-pacity, potentially causing catastrophic bridge collapse [
7]. Scour processes are in-flu-enced by flow conditions, sediment characteristics, pier geometry, and river mor-phology [
8], while sediment deposition may also occur during unsteady floods [
9]. Therefore, risk-based approaches integrating hydraulic modeling and bridge vul-nera-bility assessment have been developed to improve scour management [
10].
Modern bridge assessment approaches emphasize hydraulic uncertainties, ge-otechnical variability, and climate-related hazards [
11]. Fragility and resili-ence-based methods are increasingly used to evaluate bridge vulnerability under flood and scour conditions [
12,
13]. Various empirical and numerical methods have also been devel-oped to estimate scour depth around bridge foundations [
14]. Studies demonstrated that scour significantly affects the structural behavior and stability of bridge piers during floods [
15,
16].
Recent advances in monitoring technologies such as sonar devices, fiber optic sensors, and remote sensing systems have improved bridge resilience and scour mon-itoring capabilities [
17]. In addition, environmentally friendly countermeasures such as vegetation have shown promising results in reducing scour depth [
18]. Expe-ri-mental studies also demonstrated that scour evolution depends on sediment charac-teristics and hydraulic variations [
19], while flood and erosion processes are increas-ingly recognized as interconnected hazards affecting infrastructure vulnera-bility [
20].
Therefore, this study entitled Analysis of Flood Water Level Profiles and Scouring Potential for a 200-Meter Span Suspension Bridge aims to evaluate hydraulic behav-ior and scour susceptibility under extreme flood conditions using hydraulic modeling techniques. The results are expected to support safer bridge foundation design and improve bridge resilience against future flood hazards.
2. Materials and Methods
2.1. Study Area and Data Collection
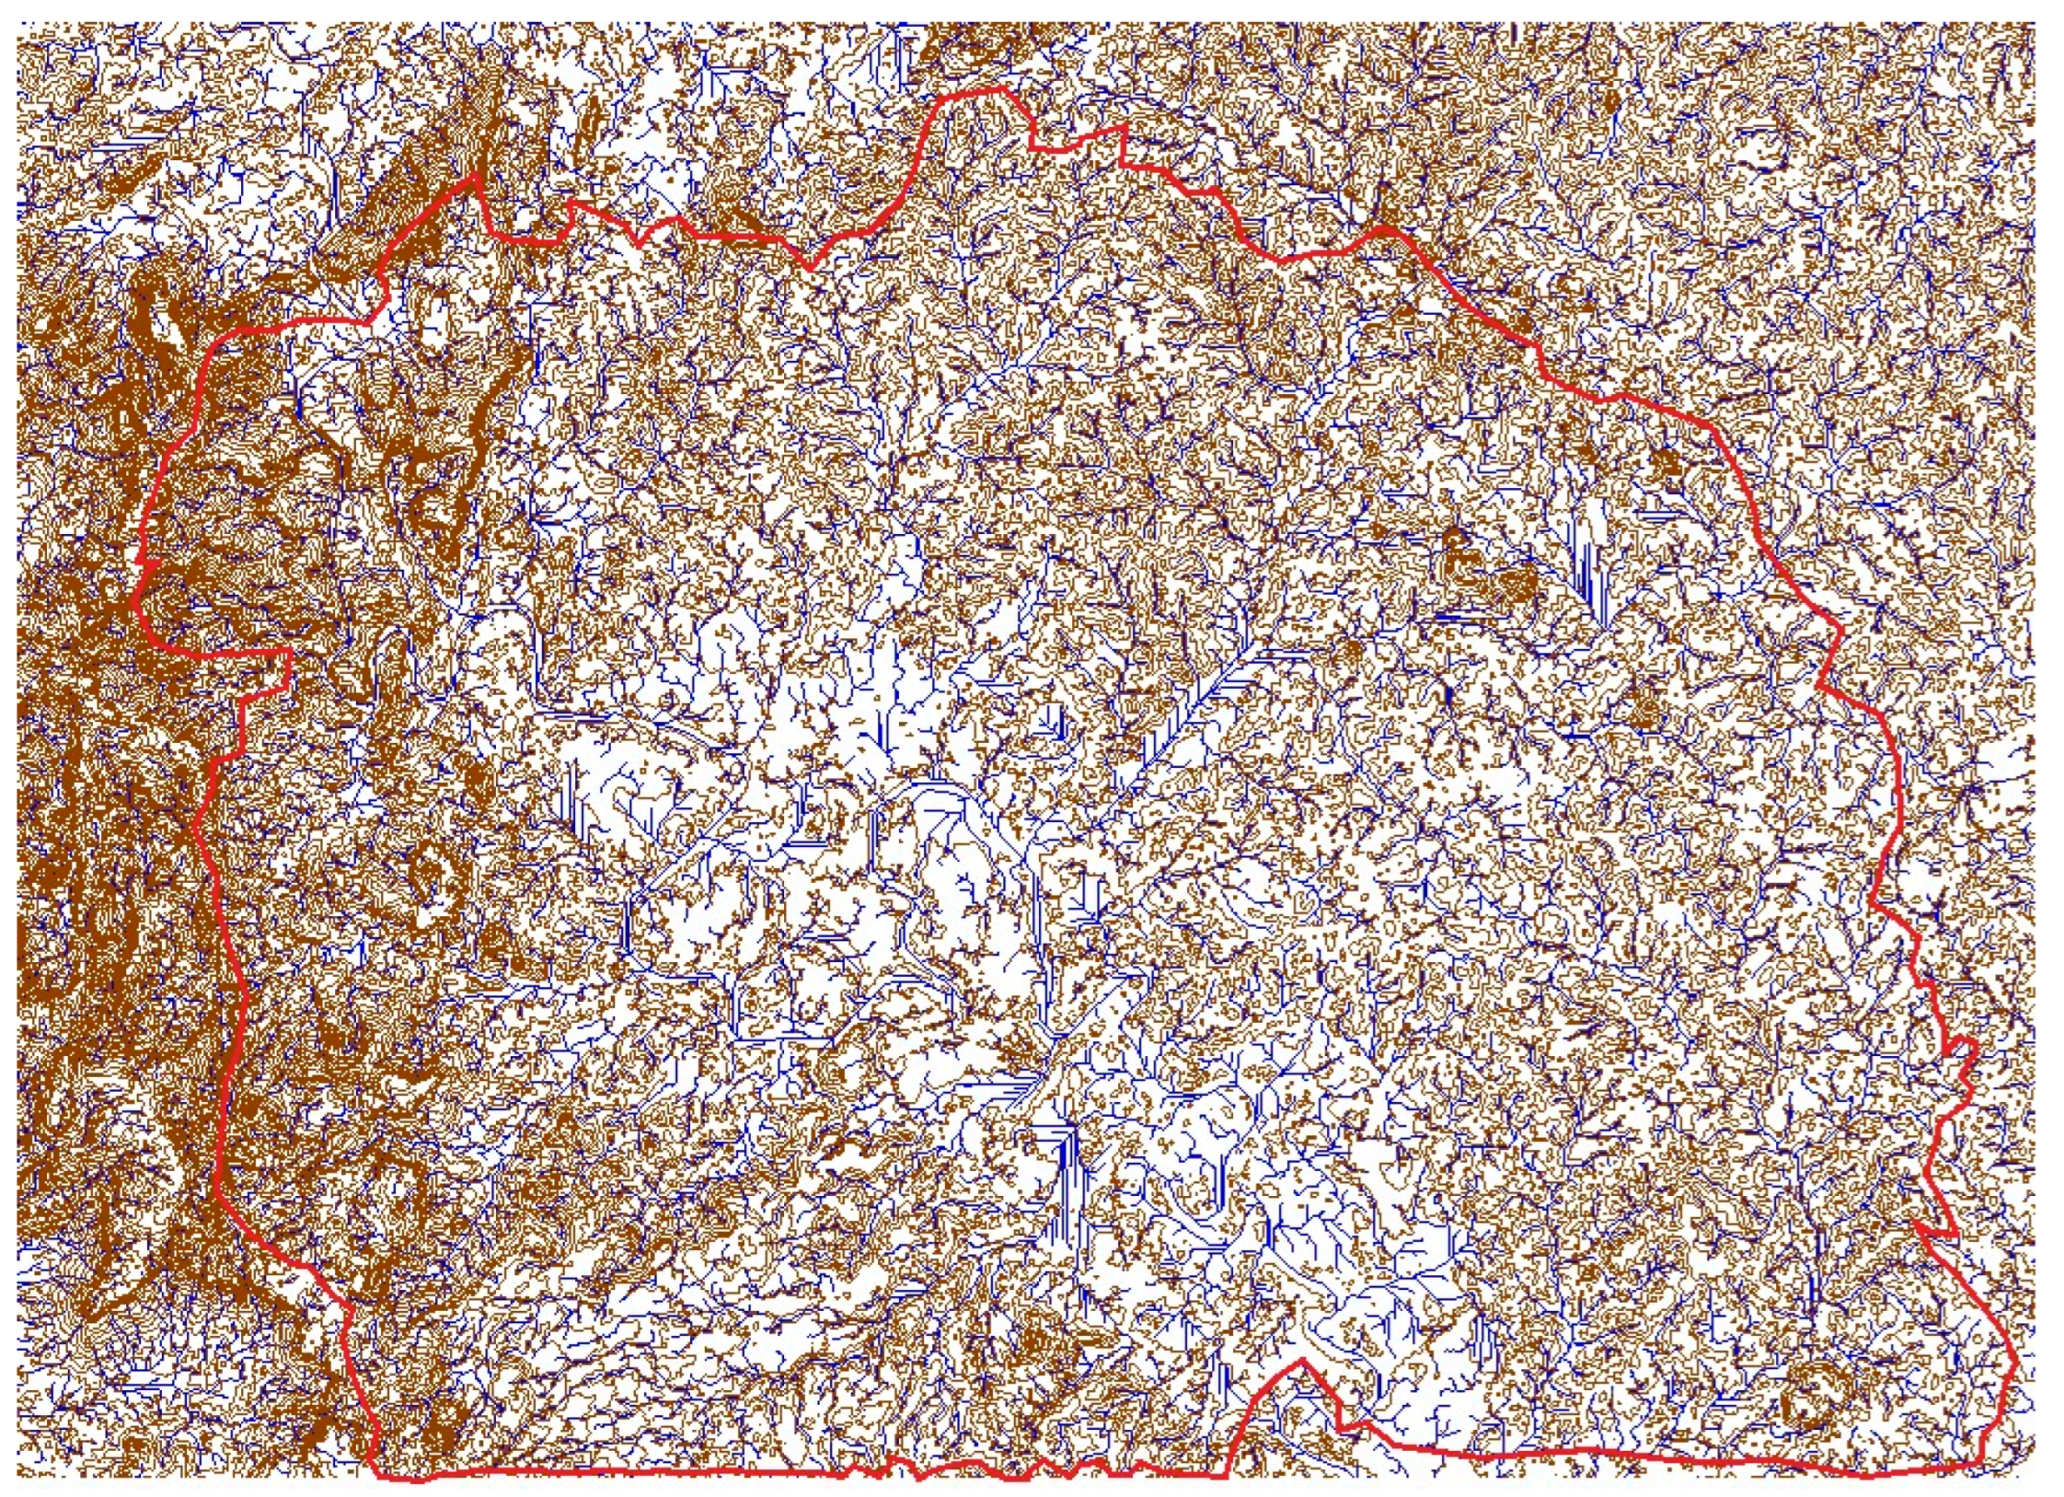
The study was conducted on a specific segment of the Mahakam River, East Ka-limantan. The Mahakam River basin covers an area of approximately 32.291 km
2 with a total river length of 565.79 km. Secondary data consisting of annual maximum daily rainfall records from 2014 to 2025 were obtained to perform hydrological mod-eling. See
Figure 1 map of the Mahakam river,
Table 1 parameters for hydrological and hydraulic analysis and
Table 2 sendiment characteristic.
2.2. Design Rainfall Analysis
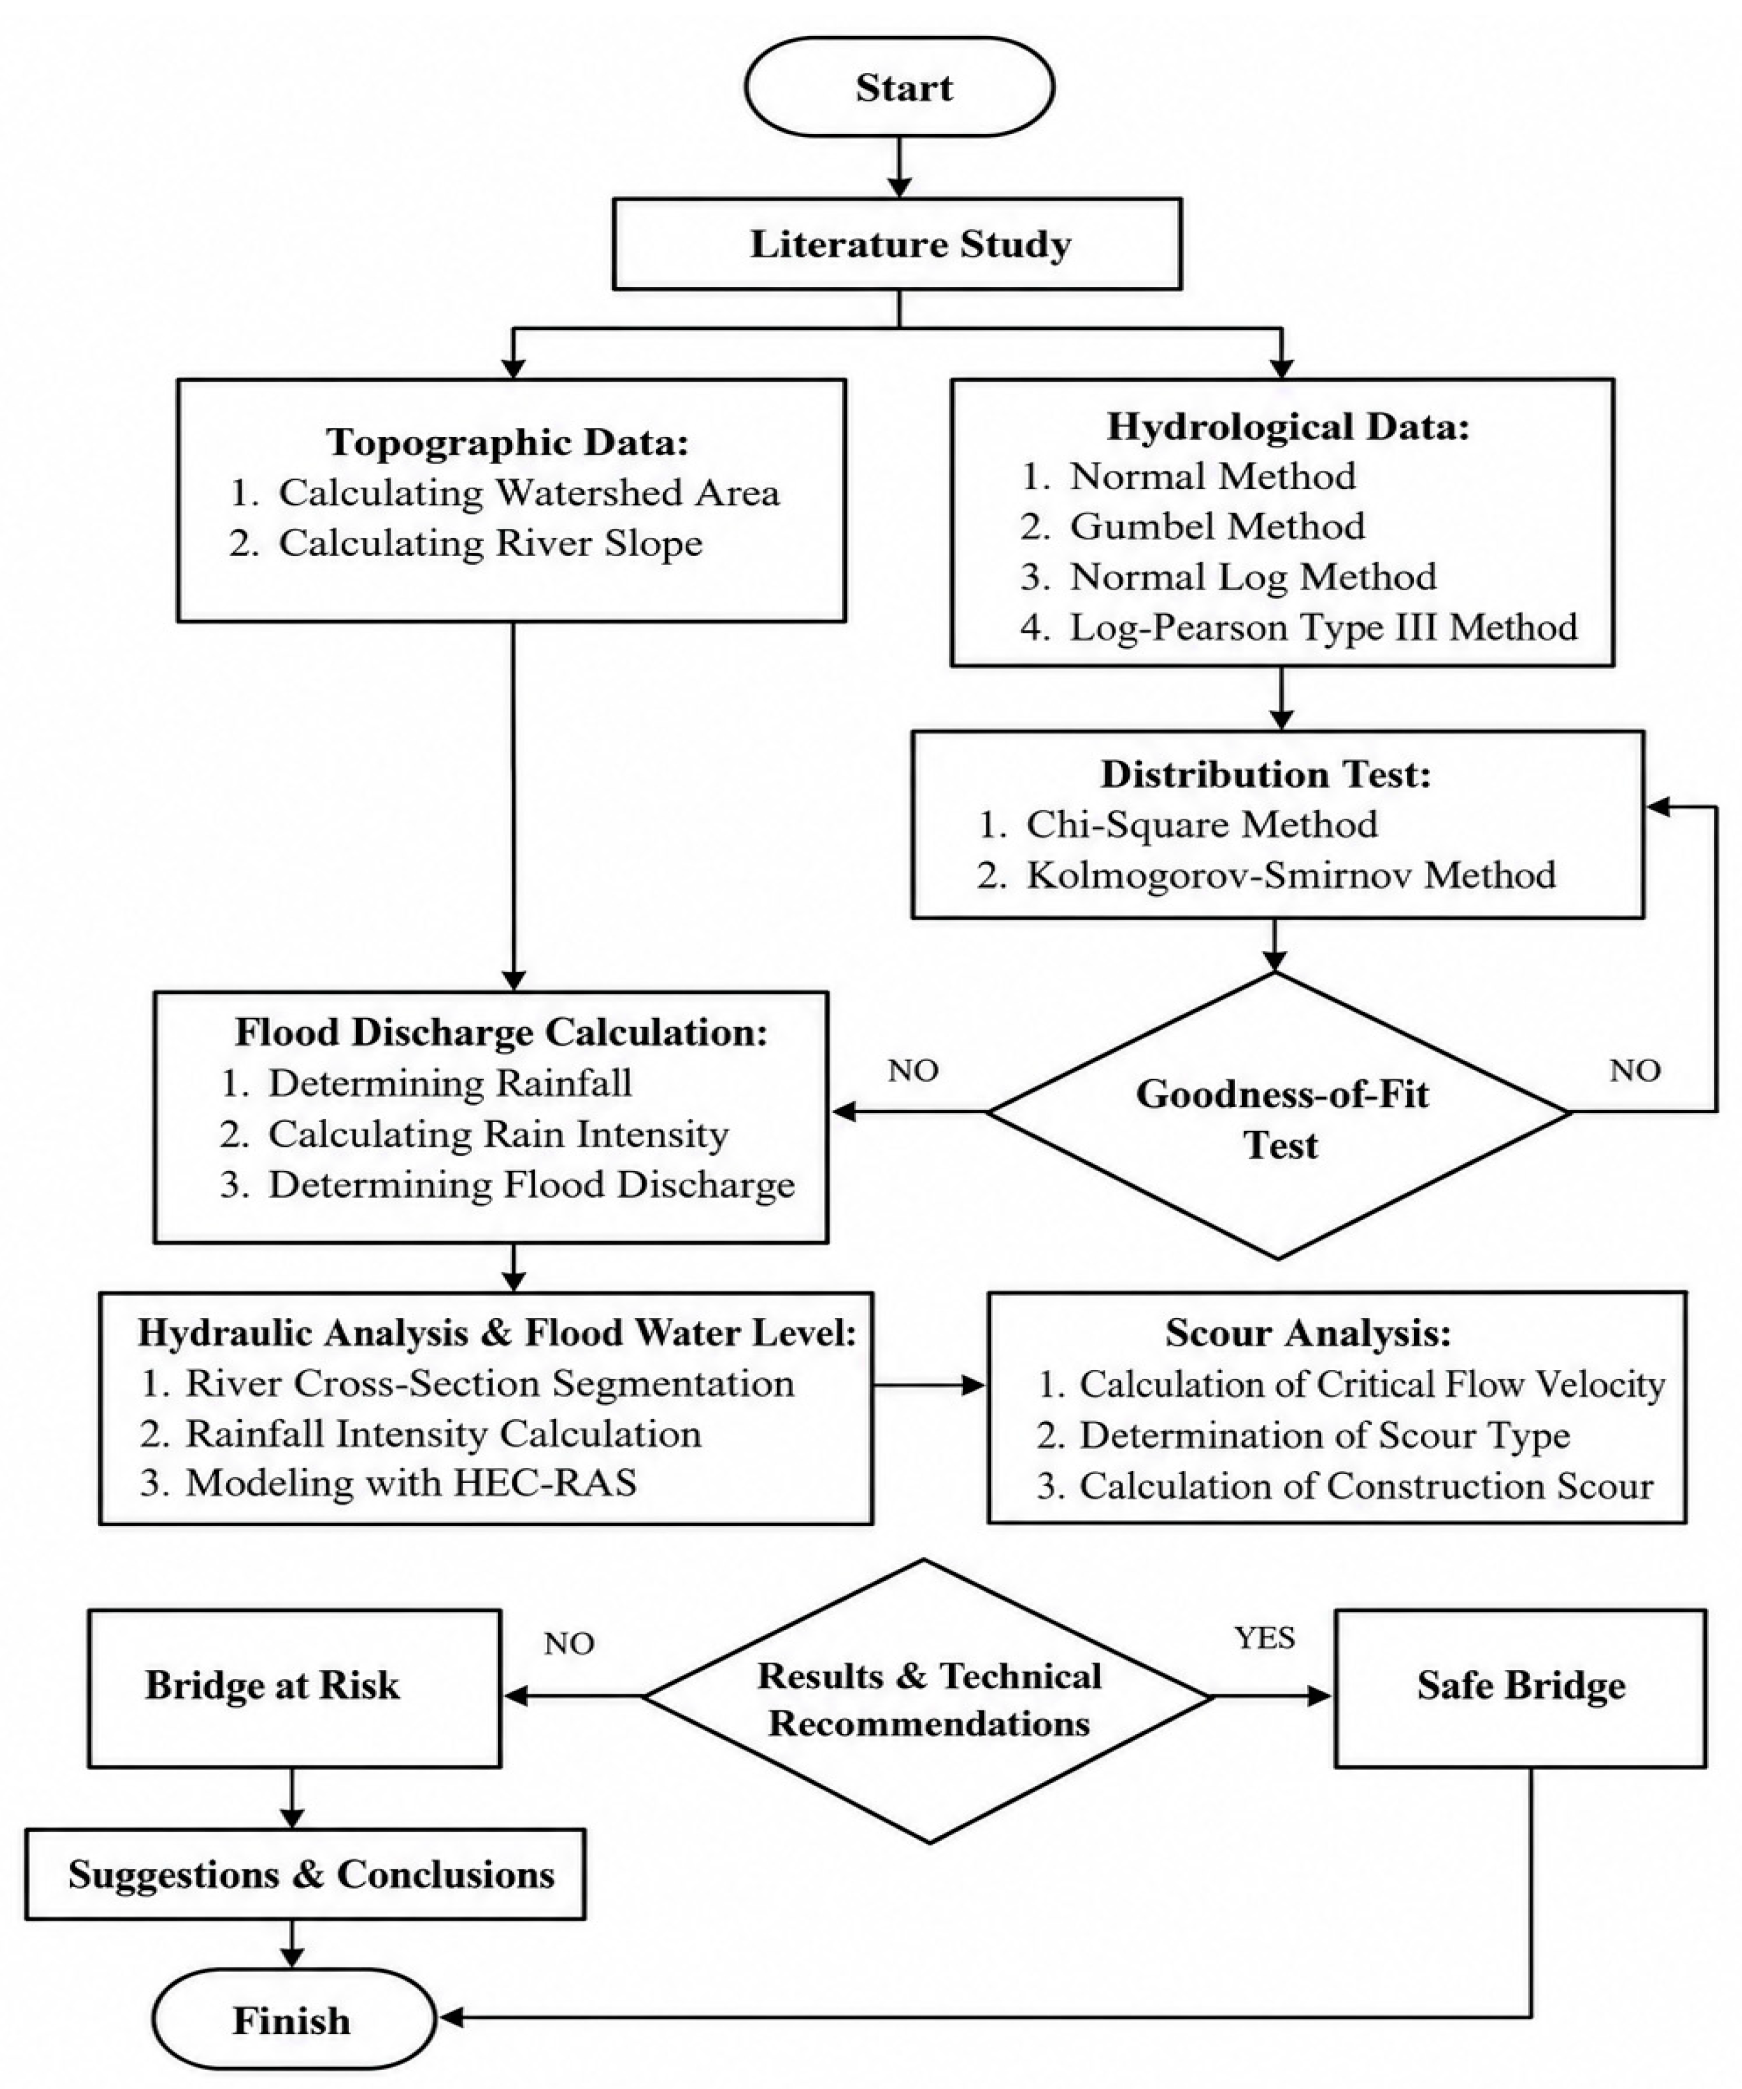
The systematic approach of this study is visualized in the research flowchart shown in
Figure 2. The process begins with the collection of hydrological and sediment data. The methodology is divided into three primary analytical stages:
a. Hydrological Analysis
This stage involves statistical parameter testing using the Log Pearson Type III method to determine the 100-year design rainfall.
b. Hydraulic Analysis
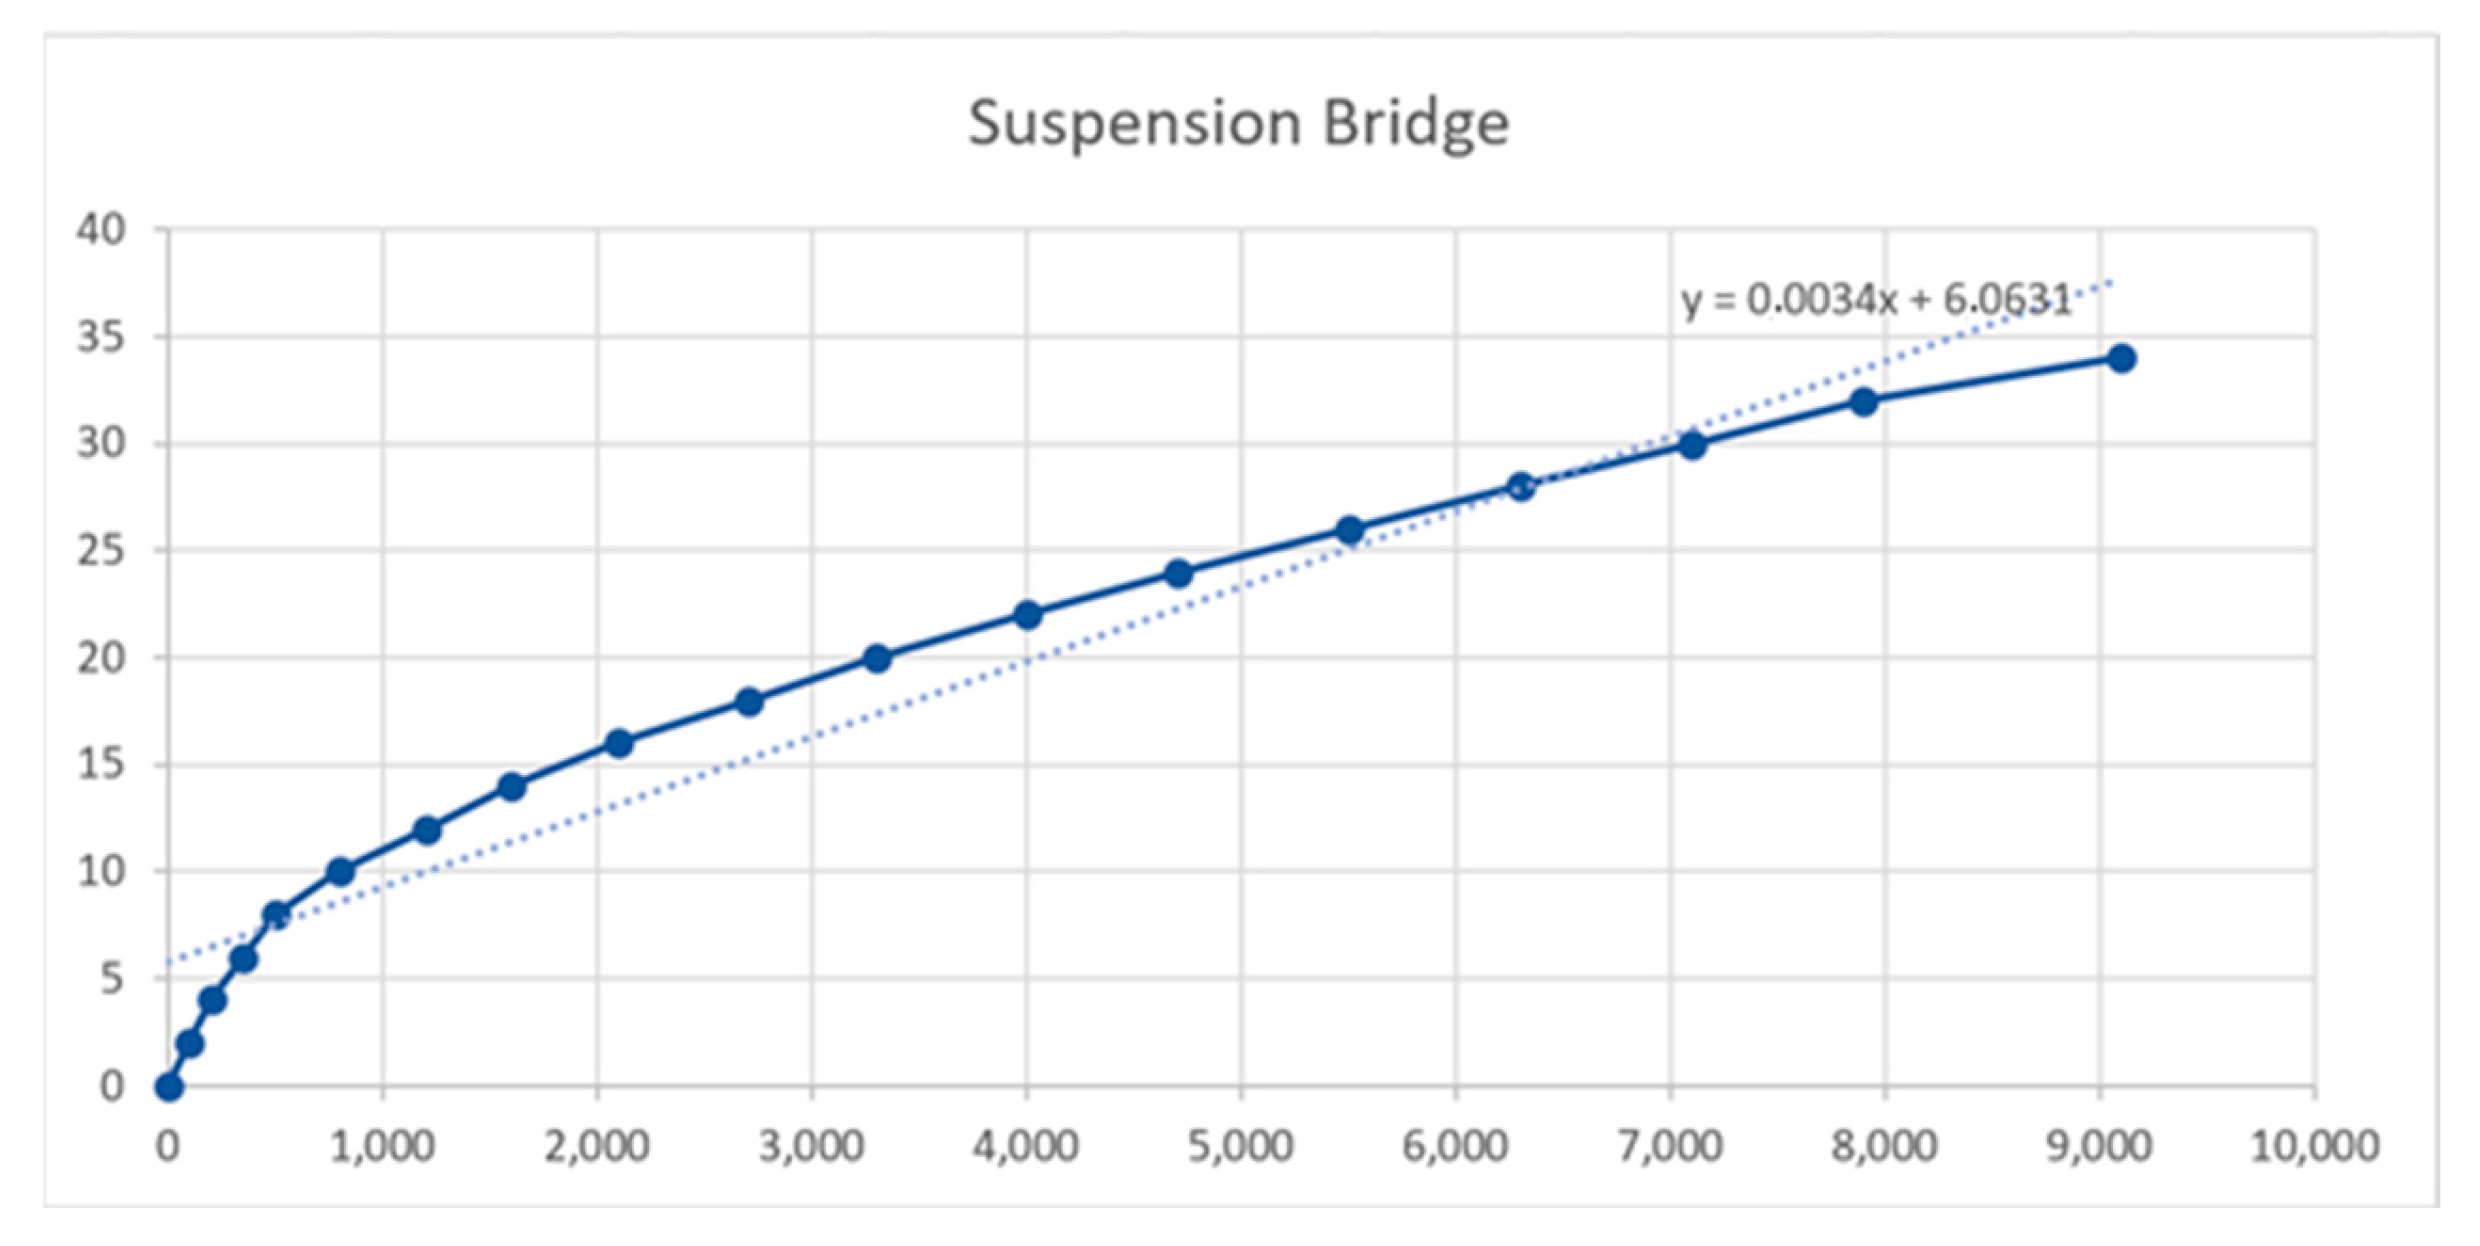
Using the results from the hydrological modeling, the peak discharge is calculated via the Rational Method. A rating curve is then established to identify the flood water level (MAB) at an elevation of 32.578 m.
This sequential flow ensures that the design of the 200-m span suspension bridge accounts for both extreme water levels and the long-term erosion of the riverbanks.
2.3. Analysis Rainfall Calculations
a. The parameters related to data analysis, including the equations used, are summarized in the following
Table 3.
b. Selection of Distribution Type
The selection of the appropriate probability distribution is determined by comparing the statistical parameters of the rainfall data against the specific requirements of each distribution method. The equations and statistical criteria used for this selection are summarized in
Table 4.
Where, Cs represents the coefficient of skewness, which describes the degree of asymmetry in the data distribution relative to its mean value. Ck denotes the coefficient of kurtosis, which indicates the peakedness or flatness of the data distribution compared with a normal distribution. Meanwhile, Cv refers to the coefficient of variation, which measures the relative variability of the dataset by comparing the standard deviation to the mean value. These statistical parameters are commonly used to evaluate data characteristics and determine the suitability of probability distributions in hydrological frequency analysis.
2.4. Goodness-of-Fit Testing
To ensure that the selected probability distribution statistically represents the observed rainfall data, two primary validation tests are conducted:
where
: Calculated Chi-Square parameter.
N: Number of subgroups within a group.
Oi: Observed frequency (actual number of data points in the i).
Ei: Expected frequency (theoretical number of data points in the i).
The design rainfall (R
T) was analyzed using the Log Pearson Type III distribution. To convert the daily rainfall into peak flood discharge, the rainfall intensity was first calculated using the Mononobe equation:
where
I: Rainfall intensity (mm/h).
R: Maximum daily rainfall for a specific return period (mm).
tc: Time of concentration (hours).
The peak flood discharge (Q) for the Mahakam River was then estimated using the Rational Method, which is suitable for the catchment area’s characteristics:
where
2.5. Hydraulic and Water Level Analysis
The hydraulic analysis was conducted to determine the flood water level at the cross-section of the planned bridge location. In addition to establishing a rating curve using Manning’s and continuity equations, a one-dimensional hydraulic modeling was performed using the Hydrologic Engineering.
The simulation was carried out under steady flow conditions. The geometric data inputted into the HEC-RAS version 6.4.1 model consisted of the Mahakam River’s cross-sectional profiles spanning a total reach length of 193.47 m, from Sta 0 + 000 to Sta 0 + 193.47. A Manning’s roughness coefficient (n) of 0.06 was applied to represent the channel’s characteristic.
The 100-year return period peak discharge (Q100) of 7798.4 m
3/s was used as the primary flow data, while the established rating curve was utilized as the downstream reach boundary condition. The resulting water surface profile from this simulation is crucial for evaluating the available freeboard. The maximum flood elevation was compared against the planned bridge’s soffit level at an elevation of +36.00 m to ensure the structure provides an adequate safety margin against hydrodynamic forces and floating debris. See the
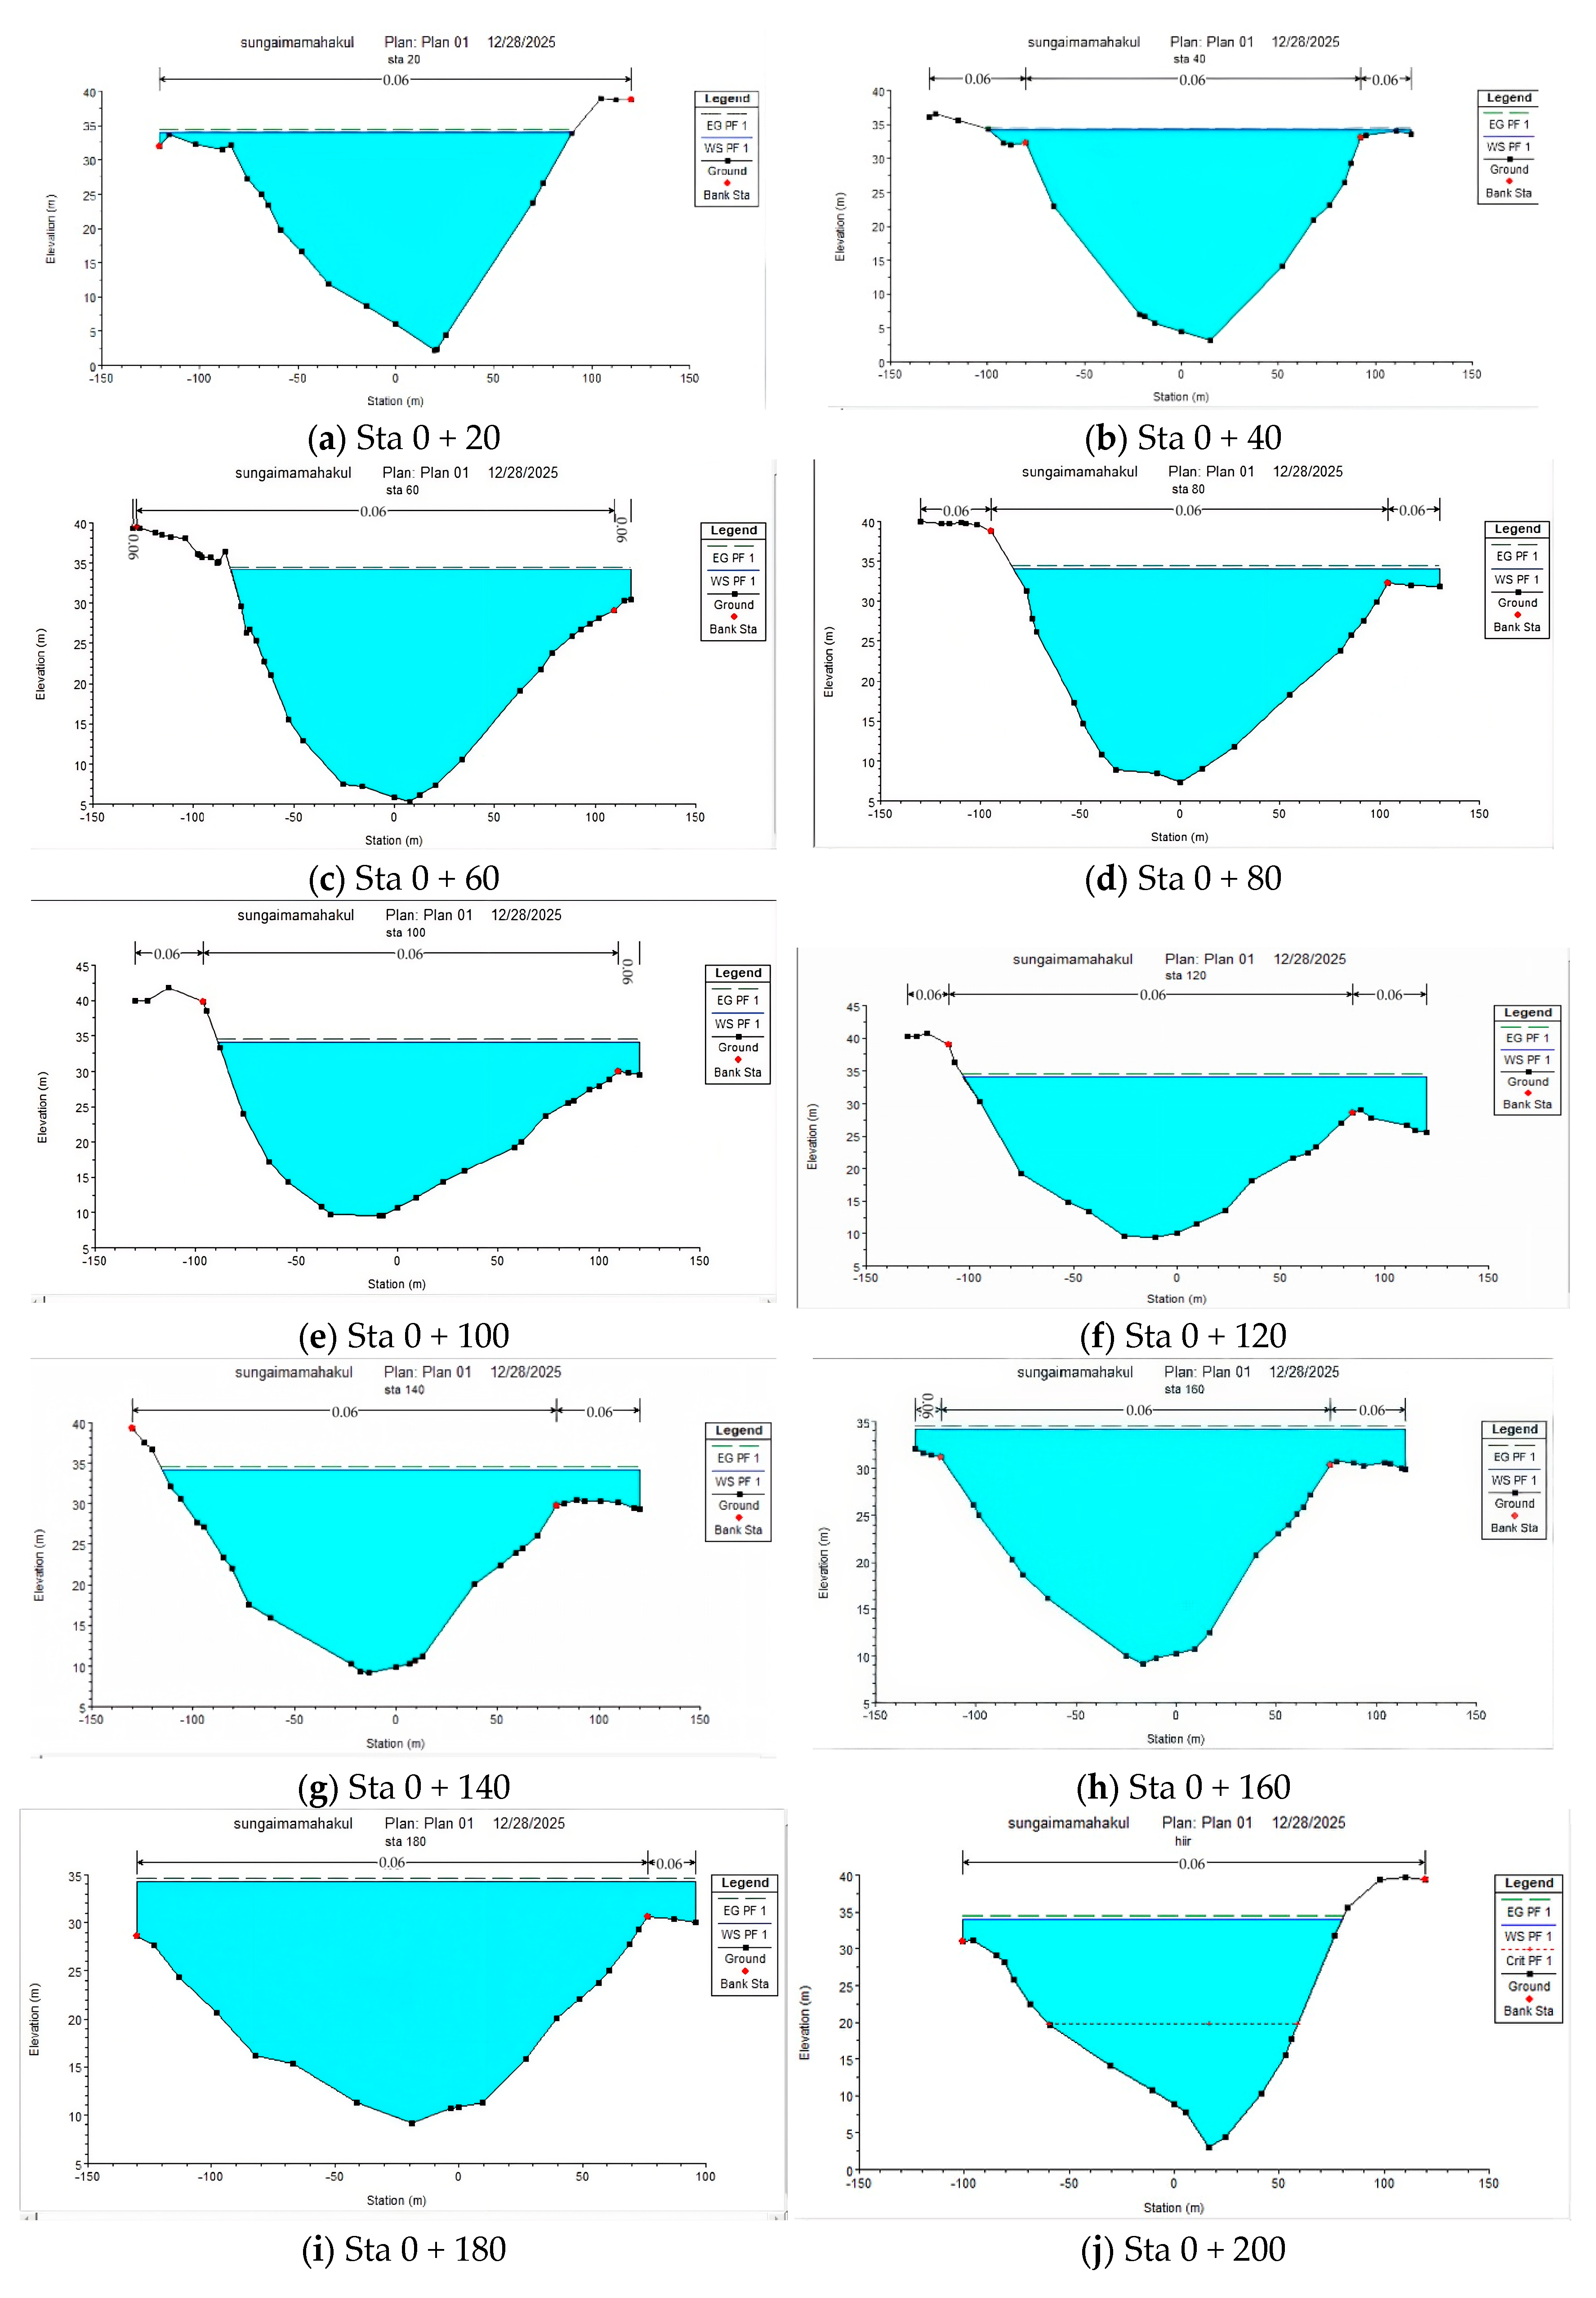
Figure 3 illustration of river cross-section segmentation.
HEC-RAS (Hydrologic Engineering Center River Analysis System) is an application used to analyze flood discharge capacity in rivers and drainage channels. Furthermore, this software is used to model steady and unsteady river flow by integrating features such as a graphical user interface, hydraulic analysis, data management and storage, graphing, and reporting. The results after running the program can be seen in
Figure 4.
2.6. Scouring Analysis and Calculation
The scouring analysis is conducted to evaluate the potential erosion of the riverbed at the Mahakam River cross-section. The analysis focuses on two primary components: construction scouring and stream scouring.
a. Determination of Scouring Type
To identify whether the riverbed experiences live-bed or clear-water scouring, the critical velocity (V
c) is s calculated and compared with the average flow velocity (V). The critical velocity is determined using the Laursen method (1963):
where
Vc: Critical velocity of bed material (m/s).
Ku: Constant coefficient (6.19 for SI units).
y1: Average flow depth at the contracted section (m).
D50: Median particle diameter of bed material (m).
b. Construction Scouring Calculation
Construction scouring occurs when the flow area is reduced by structural components. The depth is calculated using the following equations
where
y2: Average flow depth in the contracted area after scouring (m).
y1: Average flow depth upstream (m).
Q1: Discharge at the upstream and contracted sections (m3/s).
W1: River width at the upstream and contracted sections (m).
K1: Exponent for bed material transport mode.
ys: Average construction scouring depth (m).
a. Shear Velocity
Shear velocity is calculated to determine the mode of bed material transport, which defines the exponent value (K
1) in the Laursen equation. The formula is as follows:
where
: Shear velocity in the main channel (m/s).
g: Acceleration of gravity (9.81m2/s).
S1: Slope of the energy grade line at the approach section.
a. Total Scouring Depth
Total scouring depth represents the cumulative effect of construction-induced erosion and the natural annual stream scouring. In this study, the total scouring is calculated using the following summation.
3. Result
3.1. Design Rainfall and Peak Discharge
Based on frequency analysis using the Log Pearson Type III method, the design rainfall for a 100-year return period (R100) is determined. By applying the Mononobe equation to calculate the intensity and the Rational Method for the discharge, the peak flood discharge (Q100) for the Mahakam River is calculated.
Table 5 summarizes the results of statistical parameter tests and
Table 6 summarizes the results of hydrological analysis for a 100-year return period.
3.2. Water Level Elevation and Structural Integration
The hydraulic analysis was conducted to establish the rating curve and simulate the one-dimensional flow profile using HEC-RAS. Based on the analysis, the maximum flood water level (MAB) for the 100-year return period design discharge of 7798.4 m3/s reached an elevation of 32.578 m. The HEC-RAS steady flow simulation across the 193.47-m river reach further verified this maximum water surface profile.
To visualize the relationship between the hydraulic analysis and the bridge design, an evaluation of the available freeboard was conducted. The 200-m span suspension bridge abutments are strategically positioned on the higher riverbanks, with the planned soffit level (bridge girder elevation) established at +36.00 m.
By comparing the planned bridge elevation (+36.00 m) with the design flood level (+32.578 m), the available vertical clearance or freeboard is calculated to be approximately 3.42 m. This clearance significantly exceeds the standard minimum freeboard requirement of 1.0 to 1.5 m for large rivers. This configuration ensures that the main superstructure remains elevated and safe from direct hydrodynamic forces, wave run-up, and potential floating debris during extreme flood events.
Furthermore, while the superstructure is secure, the base of the riverbanks (toe) is subjected to the calculated natural stream scouring rate of 4.8 cm/year. This necessitates the proposed bank protection measures, such as gabions, to ensure the long-term stability of the abutment foundations.
To visualize the relationship between hydraulic analysis and bridge design, a technical cross-section is presented in
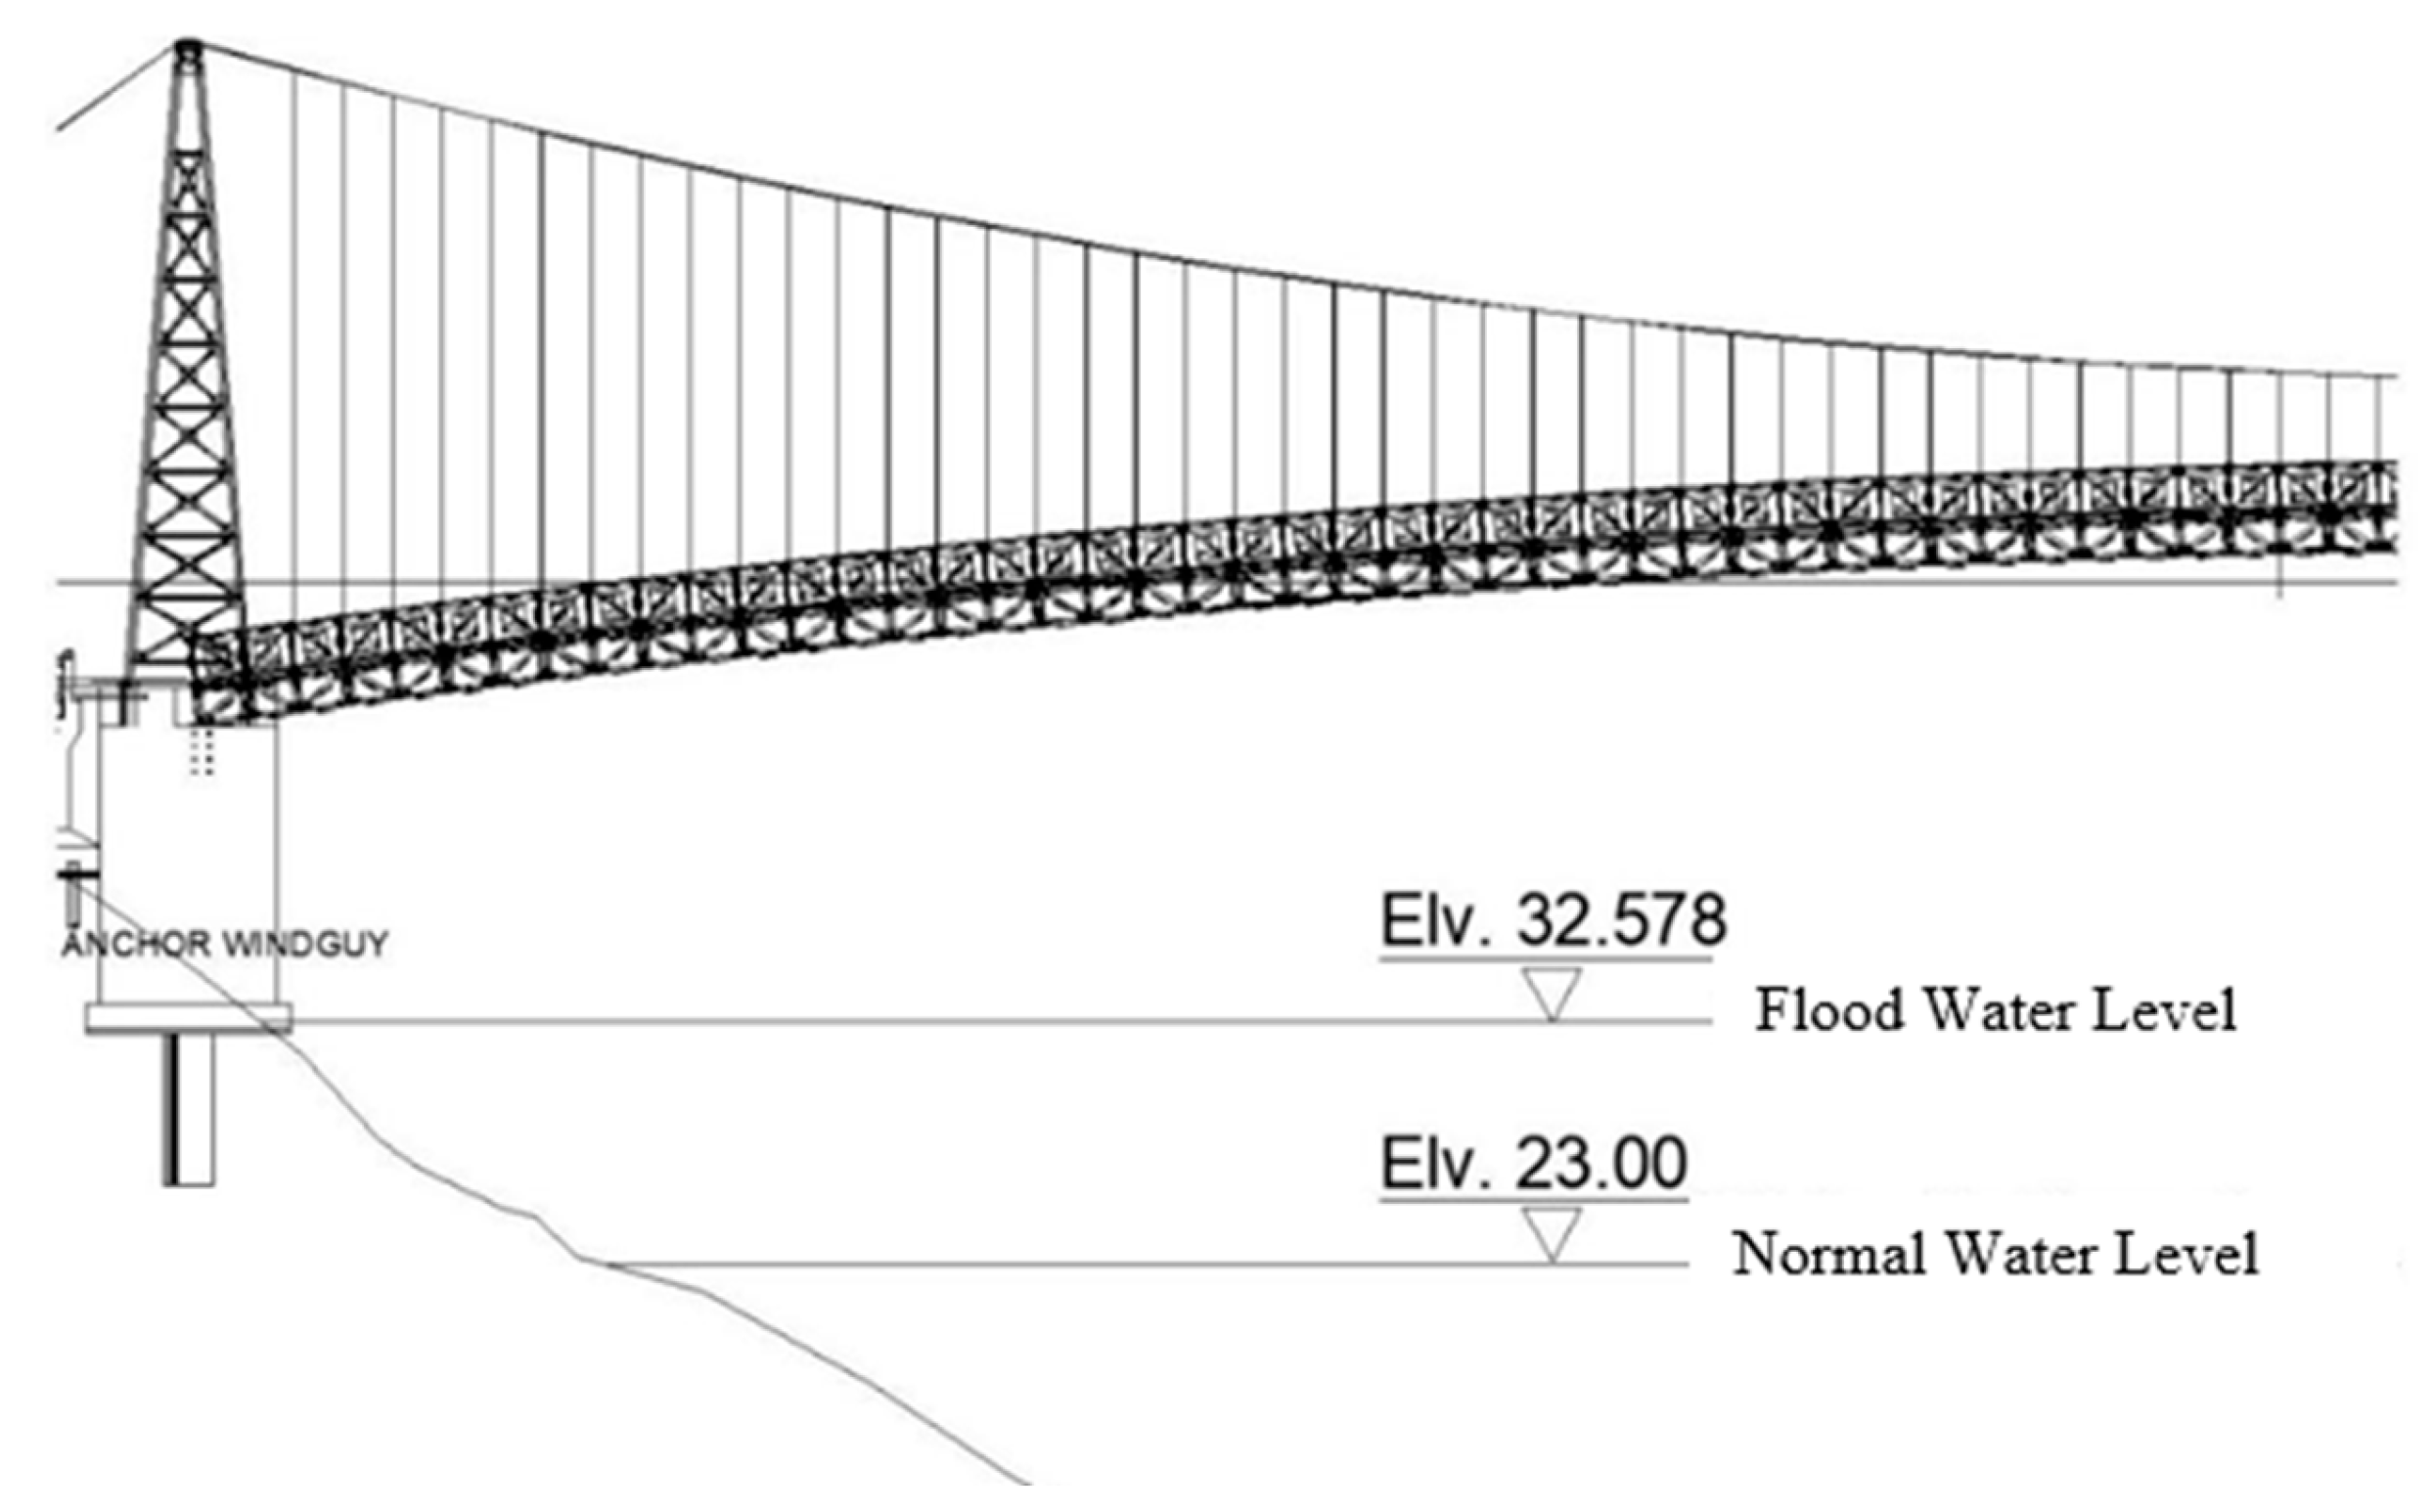
Figure 5. The figure illustrates that the abut-ments of the 200-m-span suspension bridge are strategically positioned on the higher river bank, well above the design flood level of 32,578 m. This configuration ensures that the primary structure maintains vertical clearance (freeboard), protect-ing the bridge from hydrodynamic forces and floating debris during extreme flood events. Furthermore, the visualization explains that while the superstructure remains elevated and safe from direct contact, the riverbank bed (toe) experiences a calculated erosion rate of 4.8 cm/year, necessitating the proposed riverbank protection measures to ensure foundation stability.
Figure 6 shows the profile of the planned 200-m suspension bridge.
3.3. Scouring Analysis Results
The scouring potential at the Mahakam River study site was evaluated by analyzing the interaction between the hydraulic flow properties and the bed material characteristics (D50 = 0.008 mm). The results are categorized into scouring type determination, construction scouring, and annual stream scouring.
a. Bed Material Transport and Scouring Type
Based on the Laursen method, the critical velocity (Vc) was calculated to be 2.012 m/s. Comparing this with the average flow velocity (V) of 2.078 m/s, the condition V > Vc indicates that the riverbed is subject to live-bed contraction scouring. This signifies that the sediment at the riverbed is in motion during the scouring process.
b. Calculation of Scouring Depth
The calculation results for the different scouring components are summarized in
Table 7.
c. Discussion of Scouring Impact
The construction scouring depth is recorded as 0 m under the assumption that no bridge piers or structural obstructions are currently placed within the main river channel. Consequently, the total scouring observed is entirely driven by the natural stream scouring process, which amounts to 4.8 cm/year. Although the annual rate appears minimal, long-term monitoring is recommended to mitigate potential bank instability and riverbed degradation.
4. Discussion
Based on the HEC-RAS cross-sectional outputs from Sta 0 + 000 to Sta 0 + 180, the river channel generally exhibits a deep main channel with relatively steep side slopes and asymmetric bank geometry. The modeled sections indicate that the majority of the flood discharge is concentrated within the central channel zone, producing relatively high flow velocities and increasing the possibility of local bed erosion. In several sections, particularly around Sta 0 + 020 to Sta 0 + 080, the river channel becomes narrower and deeper, which causes stronger flow concentration and higher hydraulic energy. Under these conditions, the riverbed experiences increased shear stress that may trigger live-bed scouring processes.
The hydraulic computations in HEC-RAS are governed using the one-dimensional energy equation:
where Z represents channel bed elevation, Y is flow depth, V is average velocity, α is the velocity coefficient, and h
e is the total energy loss between two cross sections. The equation explains the gradual variation of the water surface elevation observed throughout the modeled reach. The simulation results show that the water surface profile remains relatively stable at approximately elevation +32.5 m despite local geometric changes in the river section.
To strengthen the practical engineering interpretation of the hydraulic and scouring analysis, this study proposes a simplified dimensionless parameter called the Scour Safety Index (SSI):
where Q is the flood discharge, S
e is the energy slope, B is the effective river width, and D
50 is the median sediment diameter. The proposed SSI integrates the influence of hydraulic energy, river geometry, and sediment characteristics into a single practical engineering parameter for preliminary bridge safety assessment. Using the hydraulic characteristics obtained from the Mahakam River simulation:
Q: 7798.4 m3/s
Se: 0.00015
B: 180 m
D50: 0.008 mm
The SSI value was calculated as:
Based on the proposed cleaning safety classification, the SSI values are categorized as shown in
Table 8. Scouring classification.
Based on the proposed scouring classification, the obtained SSI value falls within the moderate scouring categority (0.5 ≤ SSI < 1.0). This classification indicates that the river remain hydraulically stable under the design flood condition, however, localized erosion and gradual riverbank degradation may still occour, particularly near the riverbank toe and sections with concentrated flow velocity.
5. Conclusions
This study concludes that the 100-year return period flood discharge (Q100) for the Mahakam River at the planned bridge site is 7798.4 m3/s. Based on the rating curve analysis, the maximum flood water level elevation is determined to be 32.578 m, which serves as a critical baseline for the 200-m span suspension bridge’s vertical clearance to prevent structural damage from floating debris. Furthermore, the identified natural stream scouring potential of 4.8 cm per year necessitates long-term monitoring and robust foundation planning to ensure structural integrity over the bridge’s design life. Overall, this research provides the essential technical parameters for resilient infrastructure, directly supporting the objectives of SDG 9 and SDG 11 by ensuring safe and reliable transportation connectivity for the local community.
Author Contributions
Validation, conceptualization and methodology, R.N.; software, data curation and analysis formal, I.N.R.; Writing—original draft preparation, writing review and editing, A.Z.A.-Z.R. All authors have read and agreed to the published version of the manuscript.
Funding
This research received no external funding.
Institutional Review Board Statement
Not applicable.
Informed Consent Statement
Not applicable.
Data Availability Statement
The data presented in this study are available on request from the corresponding author.
Conflicts of Interest
The author declares no conflicts of interest.
References
- Xiong, W.; Cai, C.S.; Zhang, R.; Shi, H.; Xu, C. Review of Hydraulic Bridge Failures: Historical Statistic Analysis, Failure Modes, and Prediction Methods. J. Bridg. Eng. 2023, 28. [Google Scholar] [CrossRef] [Scilit]
- Trigg, M.A.; Dehghani, M.S.; Kesete, Y.Y.; Carr, A.B.; Trigg, S.G.; Zekkos, D.; Lopez, D.; Pertierra, M.; van Westen, C.J.; Jetten, V.; et al. Realities of bridge resilience in Small Island Developing States. Mitig. Adapt. Strat. Glob. Chang. 2022, 28, 1–26. [Google Scholar] [CrossRef] [Scilit]
- Chow, V.T. Open-Channel Hydraulics; McGraw Hill: New York, USA, 1959. [Google Scholar]
- Wardhana, M.R. Analisis Kebutuhan Dimensi Groundsill Jembatan Kebon Agung II Sungai Progo (Analysis of Dimensions Requirement for the Groundsill Kebon Agung II Bridge Progo River). Bachelor’s Thesis, Universitas Islam Indonesia, Sleman, Indonesia, 2023. [Google Scholar]
- Brandimarte, L.; Paron, P.; Di Baldassarre, G. Bridge Pier Scour: A Review Of Processes, Measurements And Estimates. Environ. Eng. Manag. J. 2012, 11, 975–989. [Google Scholar] [CrossRef] [Scilit]
- Pizarro, A.; Manfreda, S.; Tubaldi, E. The Science behind Scour at Bridge Foundations: A Review. Water 2020, 12, 374. [Google Scholar] [CrossRef] [Scilit]
- Lu, J.-Y.; Hong, J.-H.; Su, C.-C.; Wang, C.-Y.; Lai, J.-S. Field Measurements and Simulation of Bridge Scour Depth Variations during Floods. J. Hydraul. Eng. 2008, 134, 810–821. [Google Scholar] [CrossRef] [Scilit]
- Link, O.; García, M.; Pizarro, A.; Alcayaga, H.; Palma, S. Local Scour and Sediment Deposition at Bridge Piers during Floods. J. Hydraul. Eng. 2020, 146. [Google Scholar] [CrossRef] [Scilit]
- Bento, A.M.; Gomes, A.; Viseu, T.; Couto, L.; Pêgo, J.P. Risk-based methodology for scour analysis at bridge foundations. Eng. Struct. 2020, 223, 111115. [Google Scholar] [CrossRef] [Scilit]
- Ahamed, T.; Duan, J.G.; Jo, H. Flood-fragility analysis of instream bridges—Consideration of flow hydraulics, geotechnical uncertainties, and variable scour depth. Struct. Infrastruct. Eng. 2020, 17, 1494–1507. [Google Scholar] [CrossRef] [Scilit]
- Abdel-Mooty, M.N.; Sasidharan, M.; Herrera, M.; Parlikad, A.K.; Schooling, J.; El-Dakhakhni, W.; Coulibaly, P. Strategic assessment of bridge susceptibility to scour. Reliab. Eng. Syst. Saf. 2024, 251, 110334. [Google Scholar] [CrossRef] [Scilit]
- Argyroudis, S.A.; Mitoulis, S.A. Vulnerability of bridges to individual and multiple hazards- floods and earthquakes. Reliab. Eng. Syst. Saf. 2021, 210, 107564. [Google Scholar] [CrossRef] [Scilit]
- Mitoulis, S.A.; A Argyroudis, S.; Loli, M.; Imam, B. Restoration models for quantifying flood resilience of bridges. Eng. Struct. 2021, 238, 112180. [Google Scholar] [CrossRef] [Scilit]
- Hosseini, R.; Amini, A. Scour depth estimation methods around pile groups. KSCE J. Civ. Eng. 2015, 19, 2144–2156. [Google Scholar] [CrossRef] [Scilit]
- Hung, C.-C.; Yau, W.-G. Behavior of scoured bridge piers subjected to flood-induced loads. Eng. Struct. 2014, 80, 241–250. [Google Scholar] [CrossRef] [Scilit]
- Hung, C.-C.; Yau, W.-G. Vulnerability evaluation of scoured bridges under floods. Eng. Struct. 2017, 132, 288–299. [Google Scholar] [CrossRef] [Scilit]
- Buka-Vaivade, K.; Nicoletti, V.; Gara, F. Advancing bridge resilience: A review of monitoring technologies for flood-prone infrastructure. Open Res. Eur. 2025, 5, 26. [Google Scholar] [CrossRef] [Scilit] [PubMed]
- Hussain, S.; Murtaza, N.; Khan, Z.U.; Ejaz, N. Enhancing Bridge Pier Resilience Against Scouring During Extreme Flood Condition Using Vegetation As A Countermeasure Experimental Approach. Int. J. Hydrol. Sci. Technol. 2025, 20, 33–57. [Google Scholar] [CrossRef] [Scilit]
- Chang, W.-Y.; Lai, J.-S.; Yen, C.-L. Evolution of Scour Depth at Circular Bridge Piers. J. Hydraul. Eng. 2004, 130, 905–913. [Google Scholar] [CrossRef] [Scilit]
- Pollard, J.A.; Spencer, T.; Brooks, S.M. The Interactive Relationship Between Coastal Erosion and Flood Risk; SAGE Publications: Thousand Oaks, CA, USA, 2019. [Google Scholar]
| Disclaimer/Publisher’s Note: The statements, opinions and data contained in all publications are solely those of the individual author(s) and contributor(s) and not of MDPI and/or the editor(s). MDPI and/or the editor(s) disclaim responsibility for any injury to people or property resulting from any ideas, methods, instructions or products referred to in the content. |