1. Introduction
Machine learning and deep learning techniques have received considerable attention for solving water system management problems [
1], with applications extending to leak detection [
2,
3,
4] and water pipe failure prediction [
5,
6]. Among the most widely used machine learning (ML) algorithms are Support Vector Machines (SVM) [
1,
2,
3,
7,
8], Artificial Neural Networks (ANN) and their variants, such as Multilayer Perceptron (MLP), Decision Trees (DT), Random Forest (RF), K-Nearest Neighbors (KNN), Logistic Regression (LR), and Gradient Boosting. Models such as Deep Neural Networks (DNN) and Convolutional Neural Networks (CNN) have instead been successfully employed for deep learning. These algorithms have proven effective in improving accuracy and recall rates, and reducing false positives, even in contexts with unbalanced datasets [
1,
5,
9].
The application of machine learning and deep learning (DL) is of fundamental importance for WDS management [
5,
9] and water infrastructure performance optimization [
1].
In this work, algorithms such as Naive Bayes, SVM and Efficient Logistic Regression were applied to predict the failure events and identify those DMAs in a WDS which are most vulnerable to mechanical failures.
The analysis was carried out on eight years of failure events recorded on a real WDS supplying 43,000 users.
2. Case Study and Methods
The case study is a WDS municipality located in Southern Italy. The network supplying 43,000 users. The failure data refers to the last 8 years, from the beginning of 2017 to April 2025. The database consists of daily geolocated failure data, which is then aggregated on a monthly basis for analysis with ML models. The analyses were conducted on a municipality divided into DMAs and to train the model, additional information were also extracted from the water utility’s systems: network length, number of inhabitants, upstream and downstream pressures of the PRV valves, pipe material, geodetic elevations, and municipality average temperature. The latter, which shows a strict correlation with the pipe failures, has been, herein at district level, considered by means of trigonometric functions in order to take into account the seasonality of failures.
A sensitivity analysis was performed in pre-processing with the aim to identify which factors have the strongest correlation with the failure trend. To compare networks of significantly different sizes, the specific failure rate
λ’ (Equation (1)) is used:
where
is the number of failures occurring in time interval
(assumed as a month in this study) and
is the total length of pipe district.
This parameter allowed us to compare failures even if the network has different size.
The specific failure rate is the main predictor, but additional predictors that may influence the classification of intervention priorities, such as dimensionless pressures, population density per km of network, average load on the network and seasonal cyclicality have been added.
A percentile threshold, fixed in this case as equal to 40%, was used to classify districts as priority areas for rehabilitation or otherwise. Each month, the distribution of failure rates was calculated and those in the top 40% were classified as priority areas, while those below were classified as non-priority areas. In this way, a target column can be derived where 1 indicates “Priority” and 0 indicates “No Priority.” For validation, a strict time division was applied: the first 69 months were used for training and the last 30 months for testing, preserving the time order to respect causality. All pre-processing and feature engineering activities were adapted exclusively to the training time window, without any loss of information from the future. A key consideration was the cost of misclassification. In practice, failing to identify a high-risk municipality (a false negative) is more problematic than a false alarm. To reflect this, we introduced a misclassification cost matrix, making learning cost-sensitive and explicitly penalizing false negatives.
3. Results
The analyses, with the characteristics above described, were performed using MATLAB (R2023b)’s Classification Learner.
Among all the methods analyzed, Naive Bayes, Coarse Gaussian SVM, and Efficient Logistic Regression (ELR), the best performance was achieved by Naive Bayes as showed by the basic metrics reported in
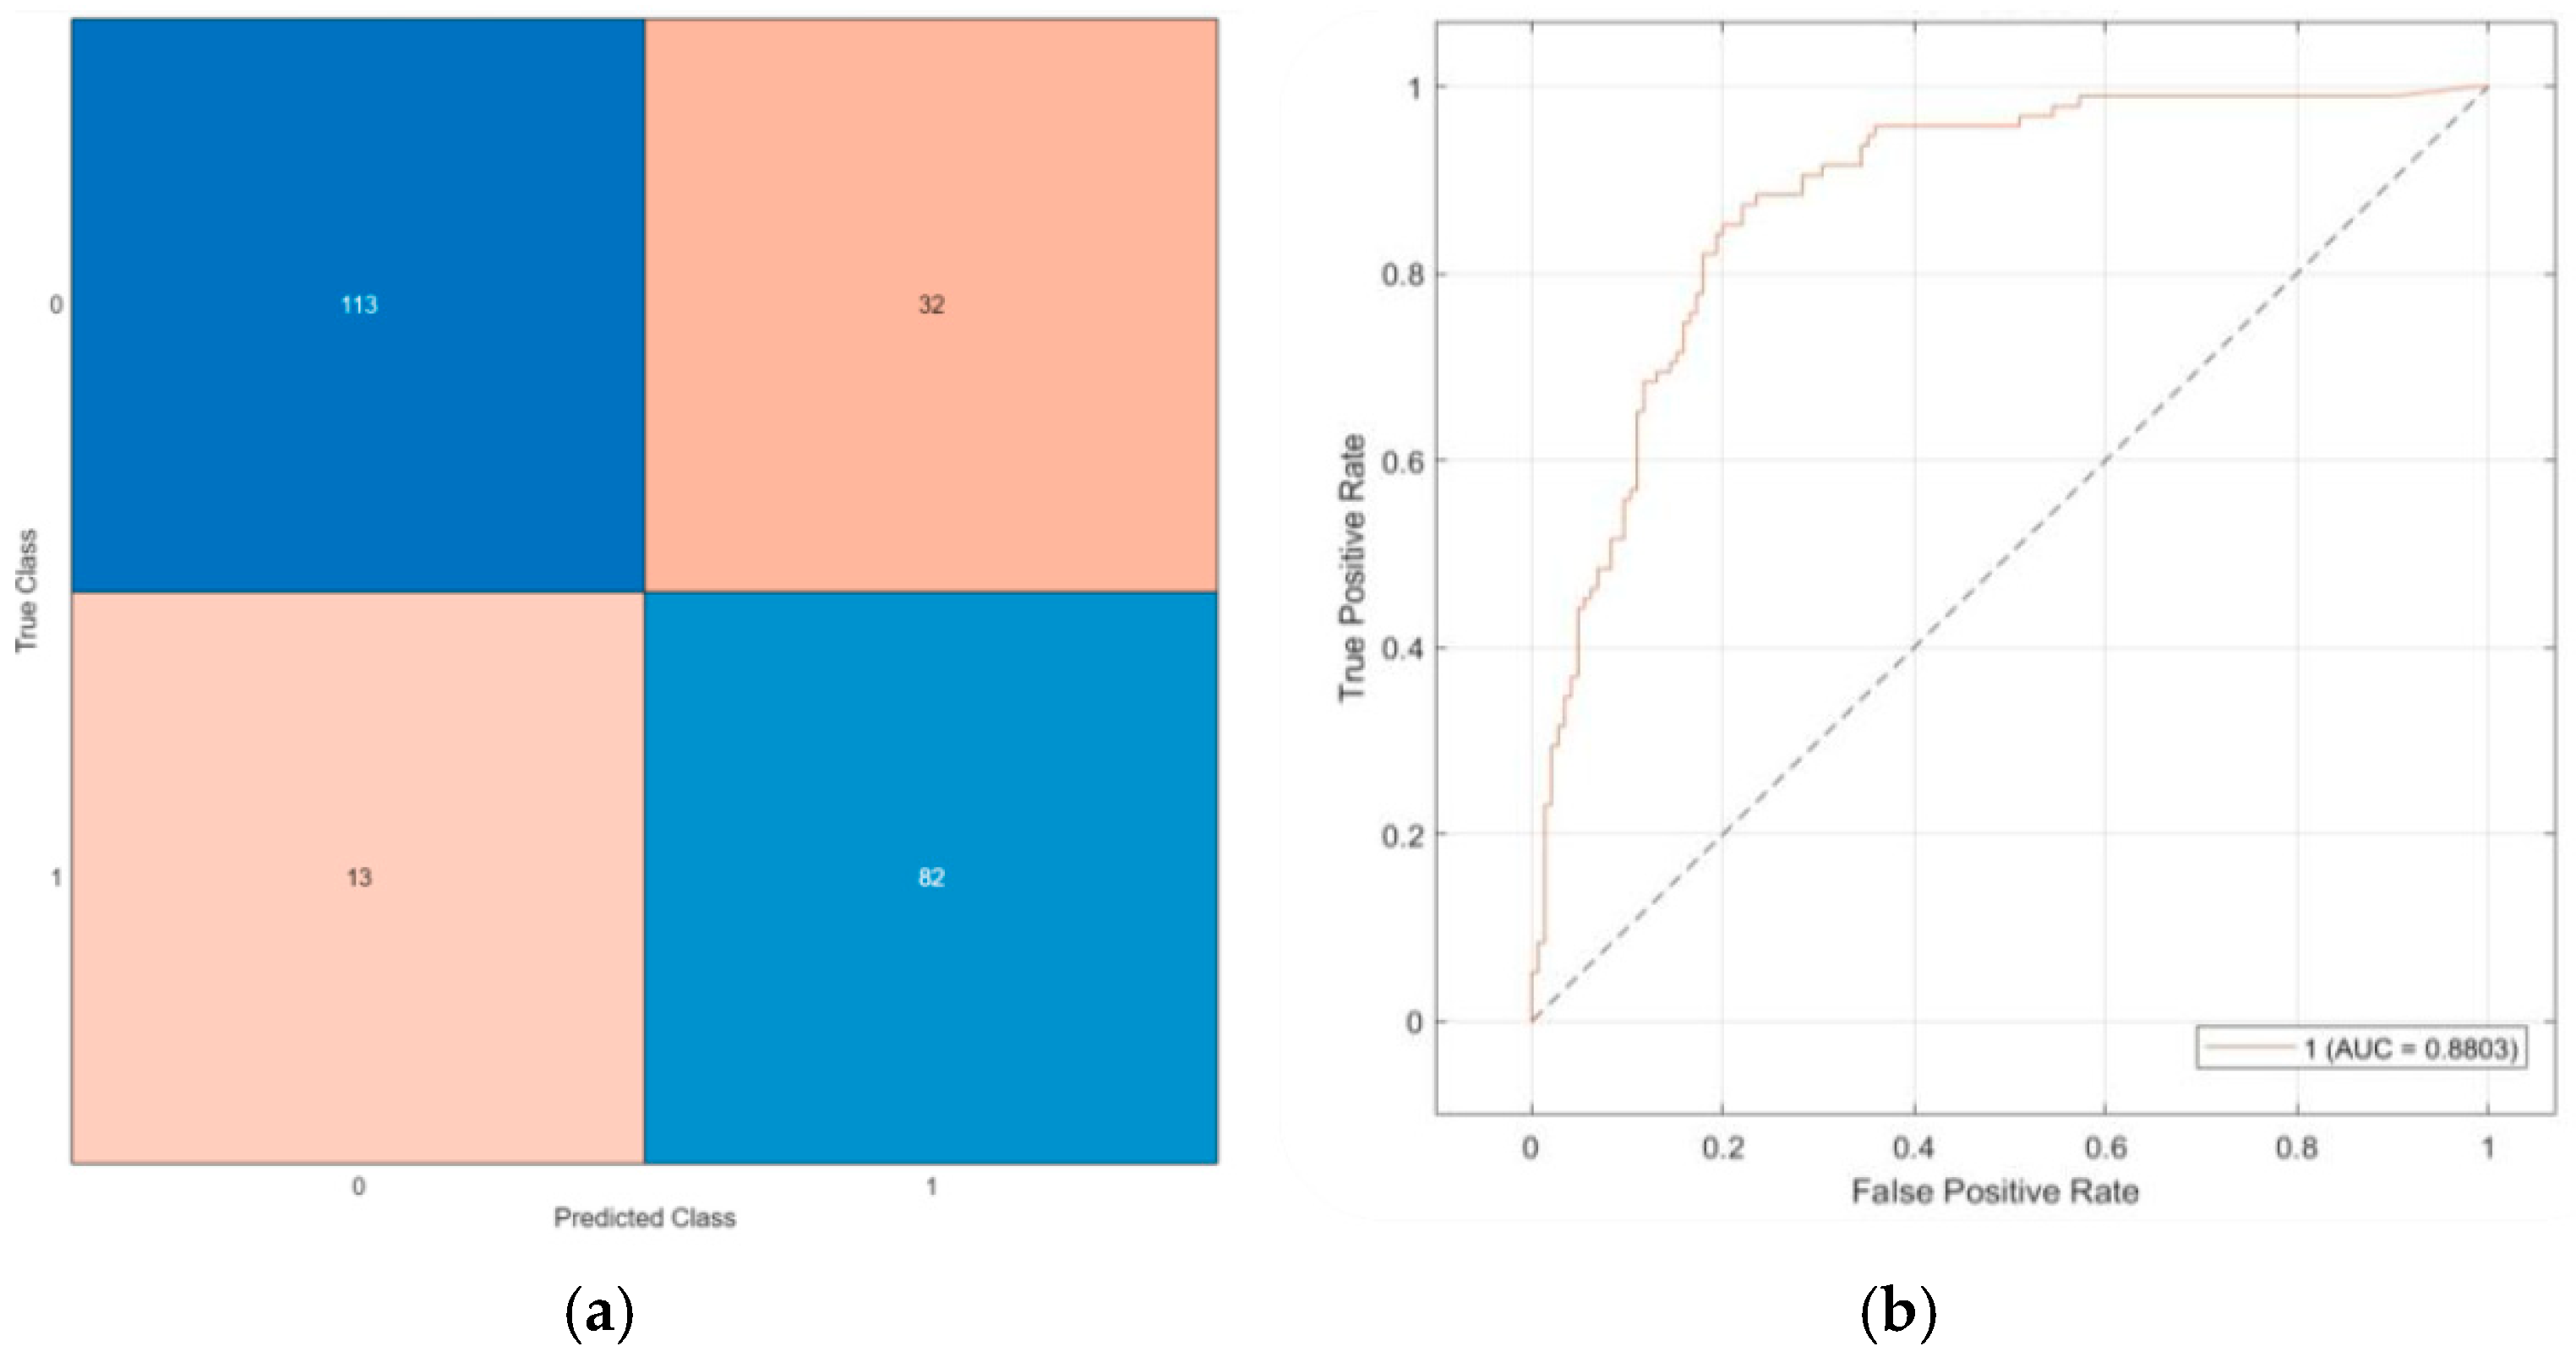
Table 1: test accuracy ≈ 85.2%, recall for the Priority class ≈ 87.5%, and F1 score around 85–86%. This balance is particularly important because it allows Priority cases to be reliably identified.
The confusion matrix (
Figure 1a) confirms that most Priority cases were correctly identified and false negatives are few. This corresponds to a careful cost setting, where failure to identify a Priority case is more critical.
The ROC (Receiver Operating Characteristic) curve (
Figure 1b) for the Priority class shows an AUC (Area Under the Curve) of approximately 0.88, indicating high separability and reinforcing the robustness of the classifier.
4. Discussion
The validated model can be used by the water utility to classify districts in function of the probability of intervention priority.
The model’s robustness has been validated over a 30-month dataset, confirming its reliability under different conditions. However, in order to help the water utility decide which district is requiring a priority rehabilitation, the last two months’ data set period (March–April 2025) has been used. Using the input data and features from March 2025, the model returns a list of districts that have a higher probability to be classified as Priority in the subsequent month. In
Table 2 the analyzed districts and the relative priority ranking were reported. By comparing the results obtained with the real April 2025 data (column 4 of
Table 2), it is evident that the model correctly classified the districts that are subject to the highest number of breaks.
5. Conclusions
The problem of WDS pipe failure management at the district level has been herein studied by means of the application of machine learning algorithms. The Naive Bayes model, trained on 69 months of data and validated on 30 months while maintaining temporal causality, achieved accuracy ≈ 85%, recall ≈ 87.5%, and AUC ≈ 0.88, demonstrating a high performance in classifying priority areas. The use of the specific failure rate, normalized for network length, together with engineered features, such as dimensionless pressures, population density, and trigonometric functions for seasonality trend, improved classes separability.
The cost-sensitive approach, based on a false negative penalty matrix, ensured accurate identification of critical districts, minimizing operational risk. These results confirm the potential of machine learning to support predictive maintenance strategies and optimize resources in the redevelopment of water networks.
Author Contributions
Conceptualization, C.C. and C.T.; methodology, C.C. and C.T.; software, C.C.; validation, C.C., C.T., R.G. and A.L.; formal analysis, R.G.; investigation, C.C.; and C.T.; resources, C.C., C.T., R.G. and A.L.; data curation, C.C., C.T., R.G. and A.L.; writing—original draft preparation, C.C. and C.T.; writing—review and editing, C.C., C.T., R.G. and A.L.; visualization, C.C., C.T., R.G. and A.L.; supervision, C.C., C.T., R.G. and A.L.; project administration, A.L.; funding acquisition, A.L. All authors have read and agreed to the published version of the manuscript.
Funding
This study was partially developed in the framework of the National Research Project 2022JN9YNJ—SMART REhabilitation of NEtworks with high Water losses (SMART RENEW)—CUP H53D23001300006. Cristian Cappello was fully funded in the framework of the PhD program in “Metodi, modelli e tecnologie per l’ingegneria” at the University of Cassino and Southern Lazio.
Institutional Review Board Statement
Not applicable.
Informed Consent Statement
Not applicable.
Data Availability Statement
The data are available upon request.
Conflicts of Interest
The authors declare no conflict of interest.
References
- Ravichandran, T.; Gavahi, K.; Ponnambalam, K.; Burtea, V.; Mousavi, S.J. Ensemble-Based Machine Learning Approach for Improved Leak Detection in Water Mains. J. Hydroinform. 2021, 23, 307–323. [Google Scholar] [CrossRef] [Scilit]
- Shen, Y.; Cheng, W. A Tree-Based Machine Learning Method for Pipeline Leakage Detection. Water 2022, 14, 2833. [Google Scholar] [CrossRef] [Scilit]
- Kammoun, M.; Kammoun, A.; Abid, M. Experiments Based Comparative Evaluations of Machine Learning Techniques for Leak Detection in Water Distribution Systems. Water Supply 2022, 22, 628–642. [Google Scholar] [CrossRef] [Scilit]
- Mashhadi, N.; Shahrour, I.; Attoue, N.; El Khattabi, J.; Aljer, A. Use of Machine Learning for Leak Detection and Localization in Water Distribution Systems. Smart Cities 2021, 4, 1293–1315. [Google Scholar] [CrossRef] [Scilit]
- Taiwo, R.; Zayed, T.; Bakhtawar, B.; Adey, B.T. Explainable Deep Learning Models for Predicting Water Pipe Failures. J. Environ. Manag. 2025, 379, 124738. [Google Scholar] [CrossRef] [Scilit] [PubMed]
- Kozelj, D.; Fernández, D.A. Predicting Water Distribution Pipe Failures Using Machine Learning and Cross-Infrastructure Data. Acta Hydrotech. 2025, 38, 53–64. [Google Scholar] [CrossRef] [Scilit]
- Liu, Y.; Ma, X.; Li, Y.; Tie, Y.; Zhang, Y.; Gao, J. Water Pipeline Leakage Detection Based on Machine Learning and Wireless Sensor Networks. Sensors 2019, 19, 5086. [Google Scholar] [CrossRef] [Scilit] [PubMed]
- Alves Coelho, J.; Glória, A.; Sebastião, P. Precise Water Leak Detection Using Machine Learning and Real-Time Sensor Data. IoT 2020, 1, 474–493. [Google Scholar] [CrossRef] [Scilit]
- Sousa, D.P.; Du, R.; Da Silva, J.M.B., Jr.; Cavalcante, C.C.; Fischione, C. Leakage Detection in Water Distribution Networks Using Machine-Learning Strategies. Water Supply 2023, 23, 1115–1126. [Google Scholar] [CrossRef] [Scilit]
| Disclaimer/Publisher’s Note: The statements, opinions and data contained in all publications are solely those of the individual author(s) and contributor(s) and not of MDPI and/or the editor(s). MDPI and/or the editor(s) disclaim responsibility for any injury to people or property resulting from any ideas, methods, instructions or products referred to in the content. |