1. Introduction
Cooling towers play a critical role in industrial temperature regulation systems. They dissipate heat through the process of evaporative cooling, effectively discharging waste heat generated by production equipment. In a typical system, circulating cooling water enters the cooling tower, where fans lower the return water temperature to maintain the outlet temperature within an optimal range. If the outlet temperature is too high, the cooling efficiency of the process decreases; conversely, excessively low temperatures can lead to unnecessary fan operation and increased energy consumption. Therefore, achieving a balance between temperature control accuracy and energy efficiency is a key motivation for improving cooling tower operation strategies.
Traditional cooling tower operations largely rely on operators’ experience to manually control fan switching, with limited availability of accurate decision support mechanisms. This often results in delayed or excessive adjustments. If the return water temperature could be predicted in advance, fan control actions could be proactively optimized to stabilize the outlet temperature within its optimal range. Consequently, such predictive and adaptive control would help minimize unnecessary energy consumption and enhance overall process efficiency.
With the rapid advancement of AI technologies, Long Short-Term Memory (LSTM) and Reinforcement Learning (RL) have been widely applied in industrial control. However, effectively conveying AI decision results to operators for real-time decision-making remains a significant challenge. Therefore, this study integrates AI-based decision-making with web interface design to develop a decision support system that assists operators in fan control.
In this study, we integrate existing LSTM temperature prediction and RL decision mechanisms to develop a web-based decision support system for cooling tower control. The system is implemented using Python (version 3.8.10) with the Django framework (version 4.2.3), PostgreSQL (version 8.12), and Nginx (version 1.26.2). The system provides real-time data visualization and fan operation recommendations through an interactive web interface. To integrate AI-based prediction and decision-making results into a web platform, we designed a user-centered decision support interface that displays system status, temperature trends, and operational suggestions in real time. We employed visualization techniques that help operators understand decision rationales and validated the system’s effectiveness through practical case studies. The system demonstrates the feasibility of applying AI technologies to industrial process control and provides a practical reference for implementing smart manufacturing.
2. Background Works
LSTM networks are effective tools for time-series prediction and have been widely applied in temperature forecasting. Qiu et al. [
1] utilized LSTM models to predict river water temperature and validated their accuracy in temporal sequence analysis. Zhang et al. [
2] demonstrated that LSTM can effectively analyze Industrial IoT (IIoT) equipment data and deliver reliable prediction results.
Reinforcement learning (RL) learns optimal control strategies through interaction with the environment and has been successfully applied to industrial control problems. He et al. [
3] proposed a predictive control optimization method for chiller systems based on deep reinforcement learning, while Nuria Nievas et al. [
4] discussed the advantages and challenges of applying RL to autonomous process control in Industry 4.0 environments.
Decision support systems play an essential role in manufacturing industries by assisting operators in making complex operational decisions. Marques et al. [
5] designed a decision support system for Industry 4.0 environments; Poch et al. [
6] explored the design and implementation of environmental decision support systems; and Michael [
7] analyzed decision support tools for district cooling systems.
In cooling tower control, Schulze et al. [
8] proposed a cooling tower management approach based on cyber–physical systems that optimizes operational efficiency through real-time monitoring and data analysis.
Visualization interfaces influence the performance of decision support systems. Speier [
9] investigated the effect of query interface design on decision-making performance and pointed out that appropriate visualization design can enhance users’ information comprehension speed and accuracy, thereby improving decision quality. In this study, we integrated LSTM-based temperature prediction, RL-based decision evaluation, and web interface design to establish a comprehensive decision support system. The system’s effectiveness is verified through practical case studies in real manufacturing environments.
3. System Design and Implementation
3.1. Research Methodology
We conducted a case study approach to develop an AI-integrated decision support web system for a manufacturing cooling tower. This research methodology comprises the following three aspects:
3.1.1. AI Technology Integration
The proposed system integrates an existing LSTM time-series prediction model and an RL decision-making model. The LSTM model was trained using historical operational data from 2019 to 2024 to predict the return water temperature for the next 15 min. The RL model evaluates three fan operation actions—turn on, turn off, and maintain—based on the predicted results, the current system state, and environmental variations. It then provides an optimal fan control strategy through a reward-based learning mechanism.
3.1.2. Web System Development
A web-based decision support system was developed using the Django framework to visualize AI predictions and decision results. The system includes functional modules such as a real-time monitoring dashboard, fan operation indicator lights, temperature trend charts, and historical data query functions. These modules provide operators with decision references and actionable operational recommendations.
3.1.3. System Verification
The developed system was deployed and tested in an actual manufacturing environment to validate the effectiveness of AI-assisted decision-making and its impact on temperature control performance. Comprehensive on-site testing and operator feedback were utilized to refine the system’s user interface and enhance its functional design and usability.
3.2. System Architecture
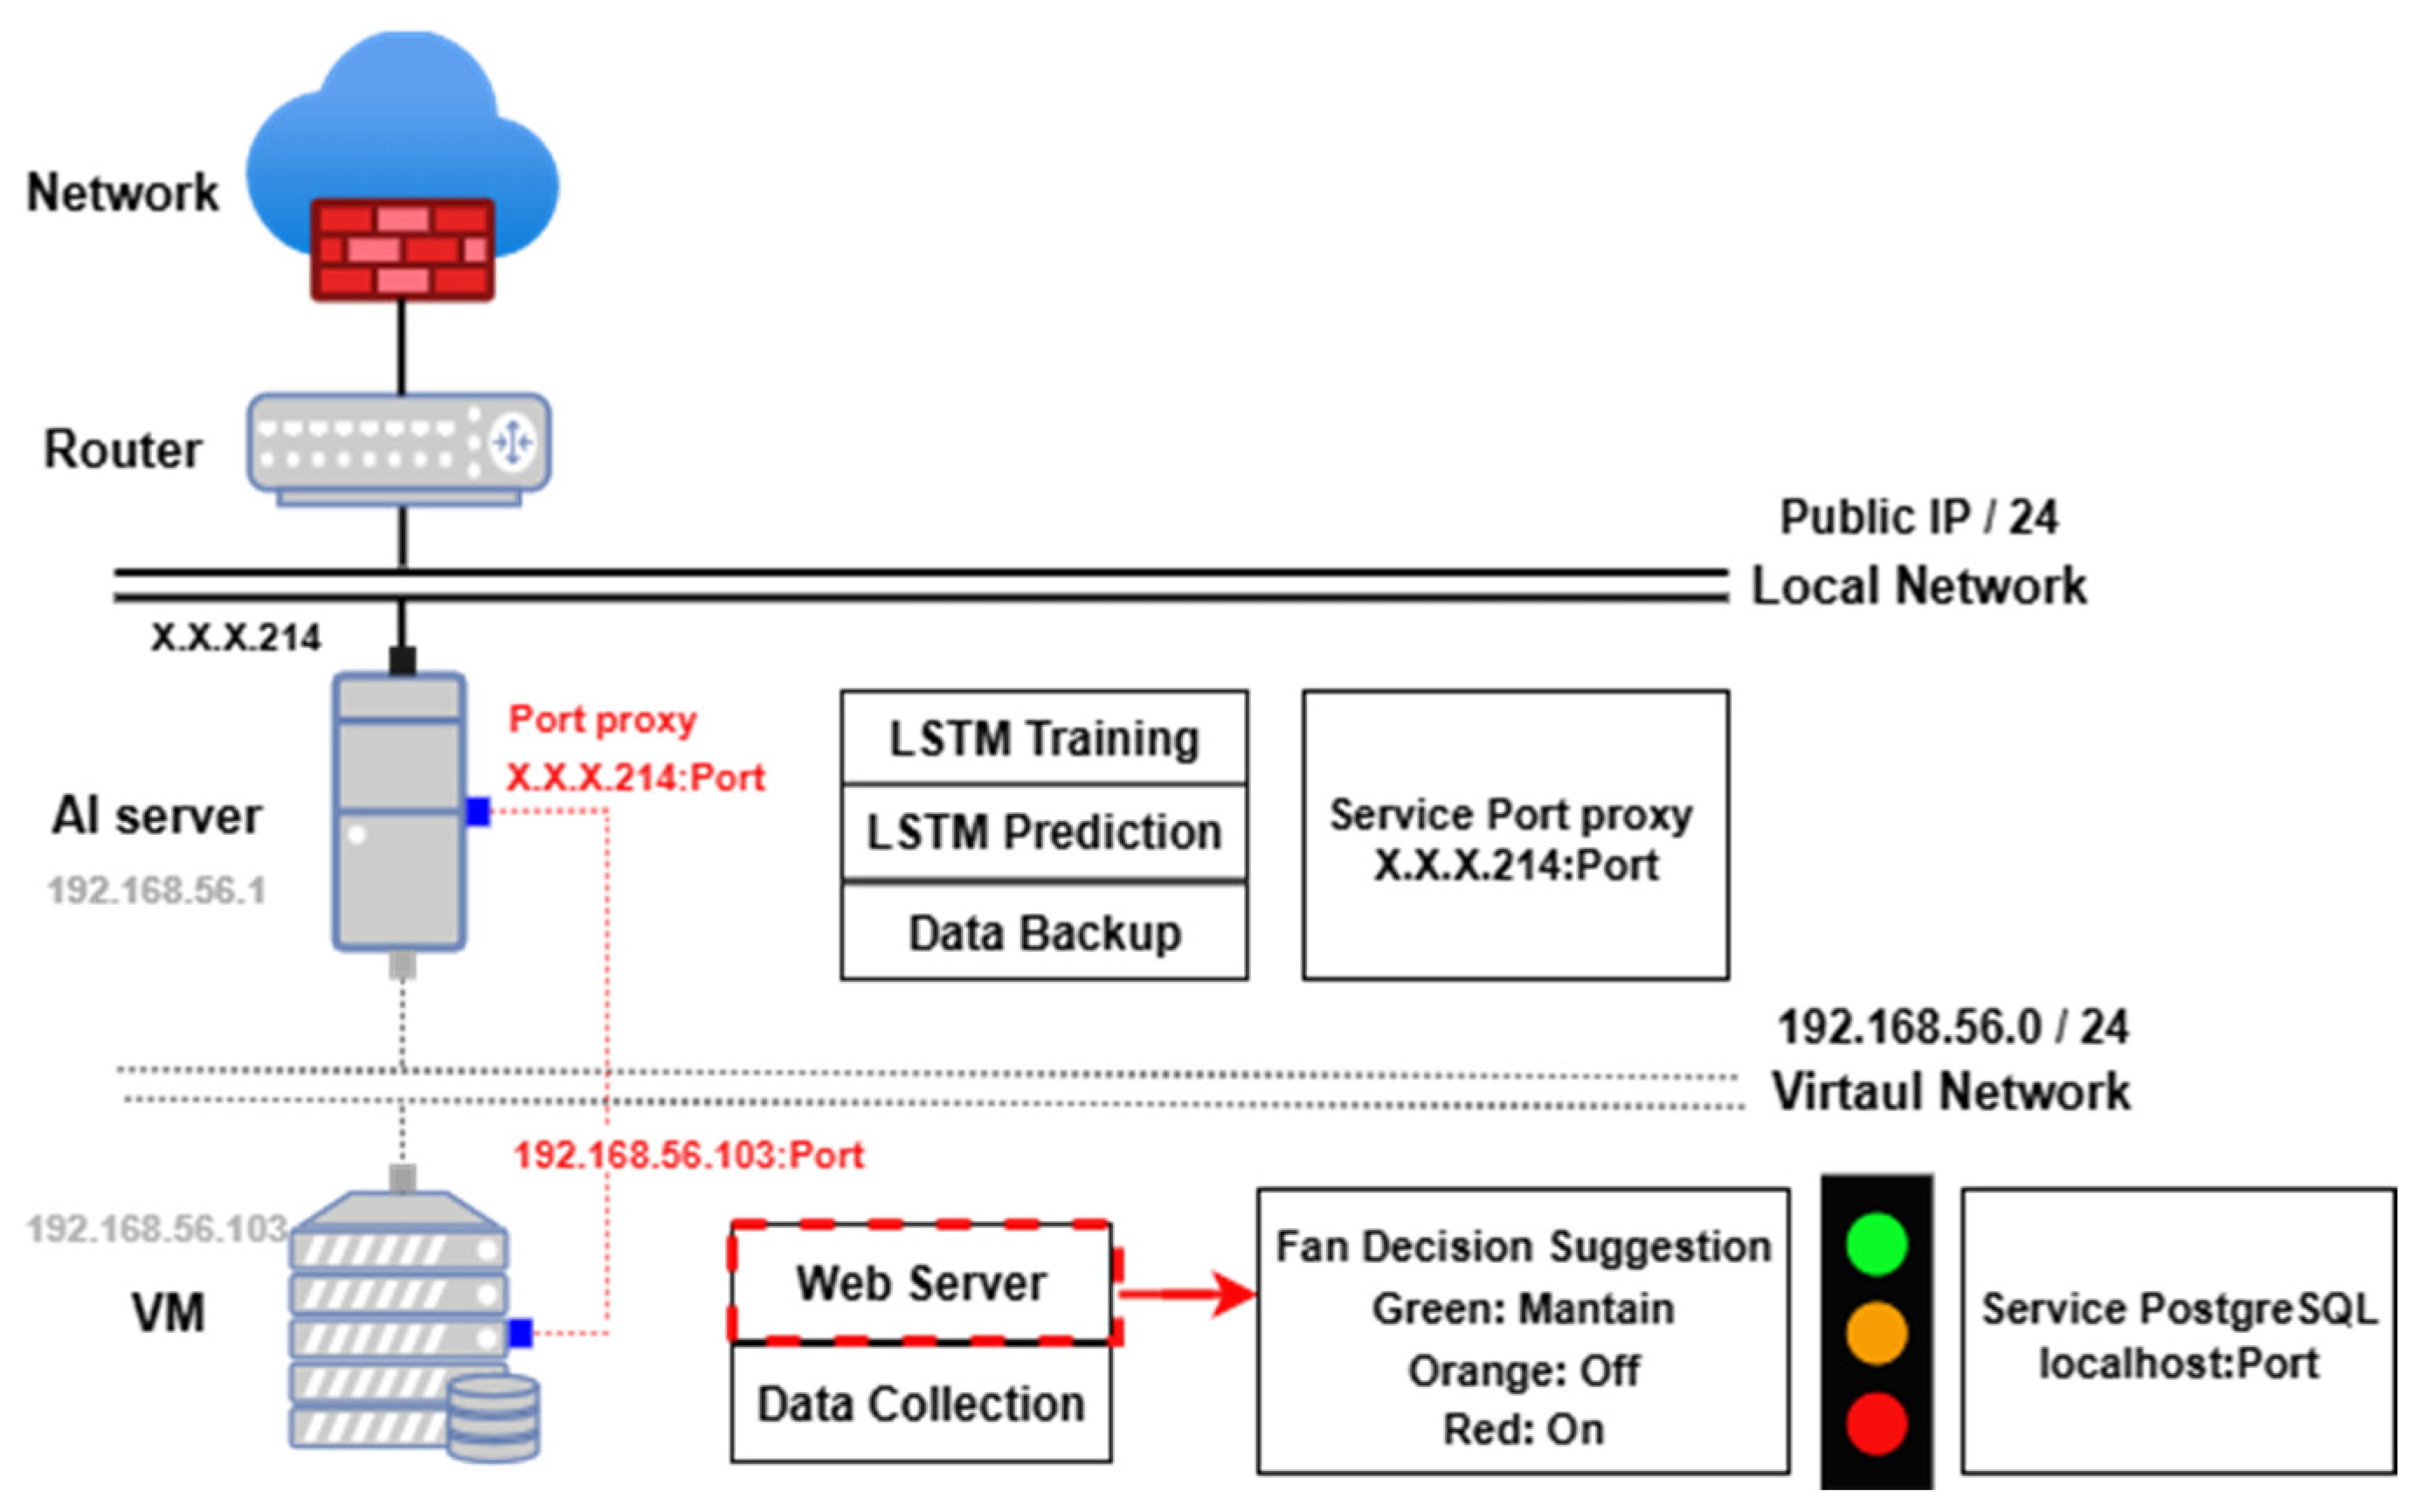
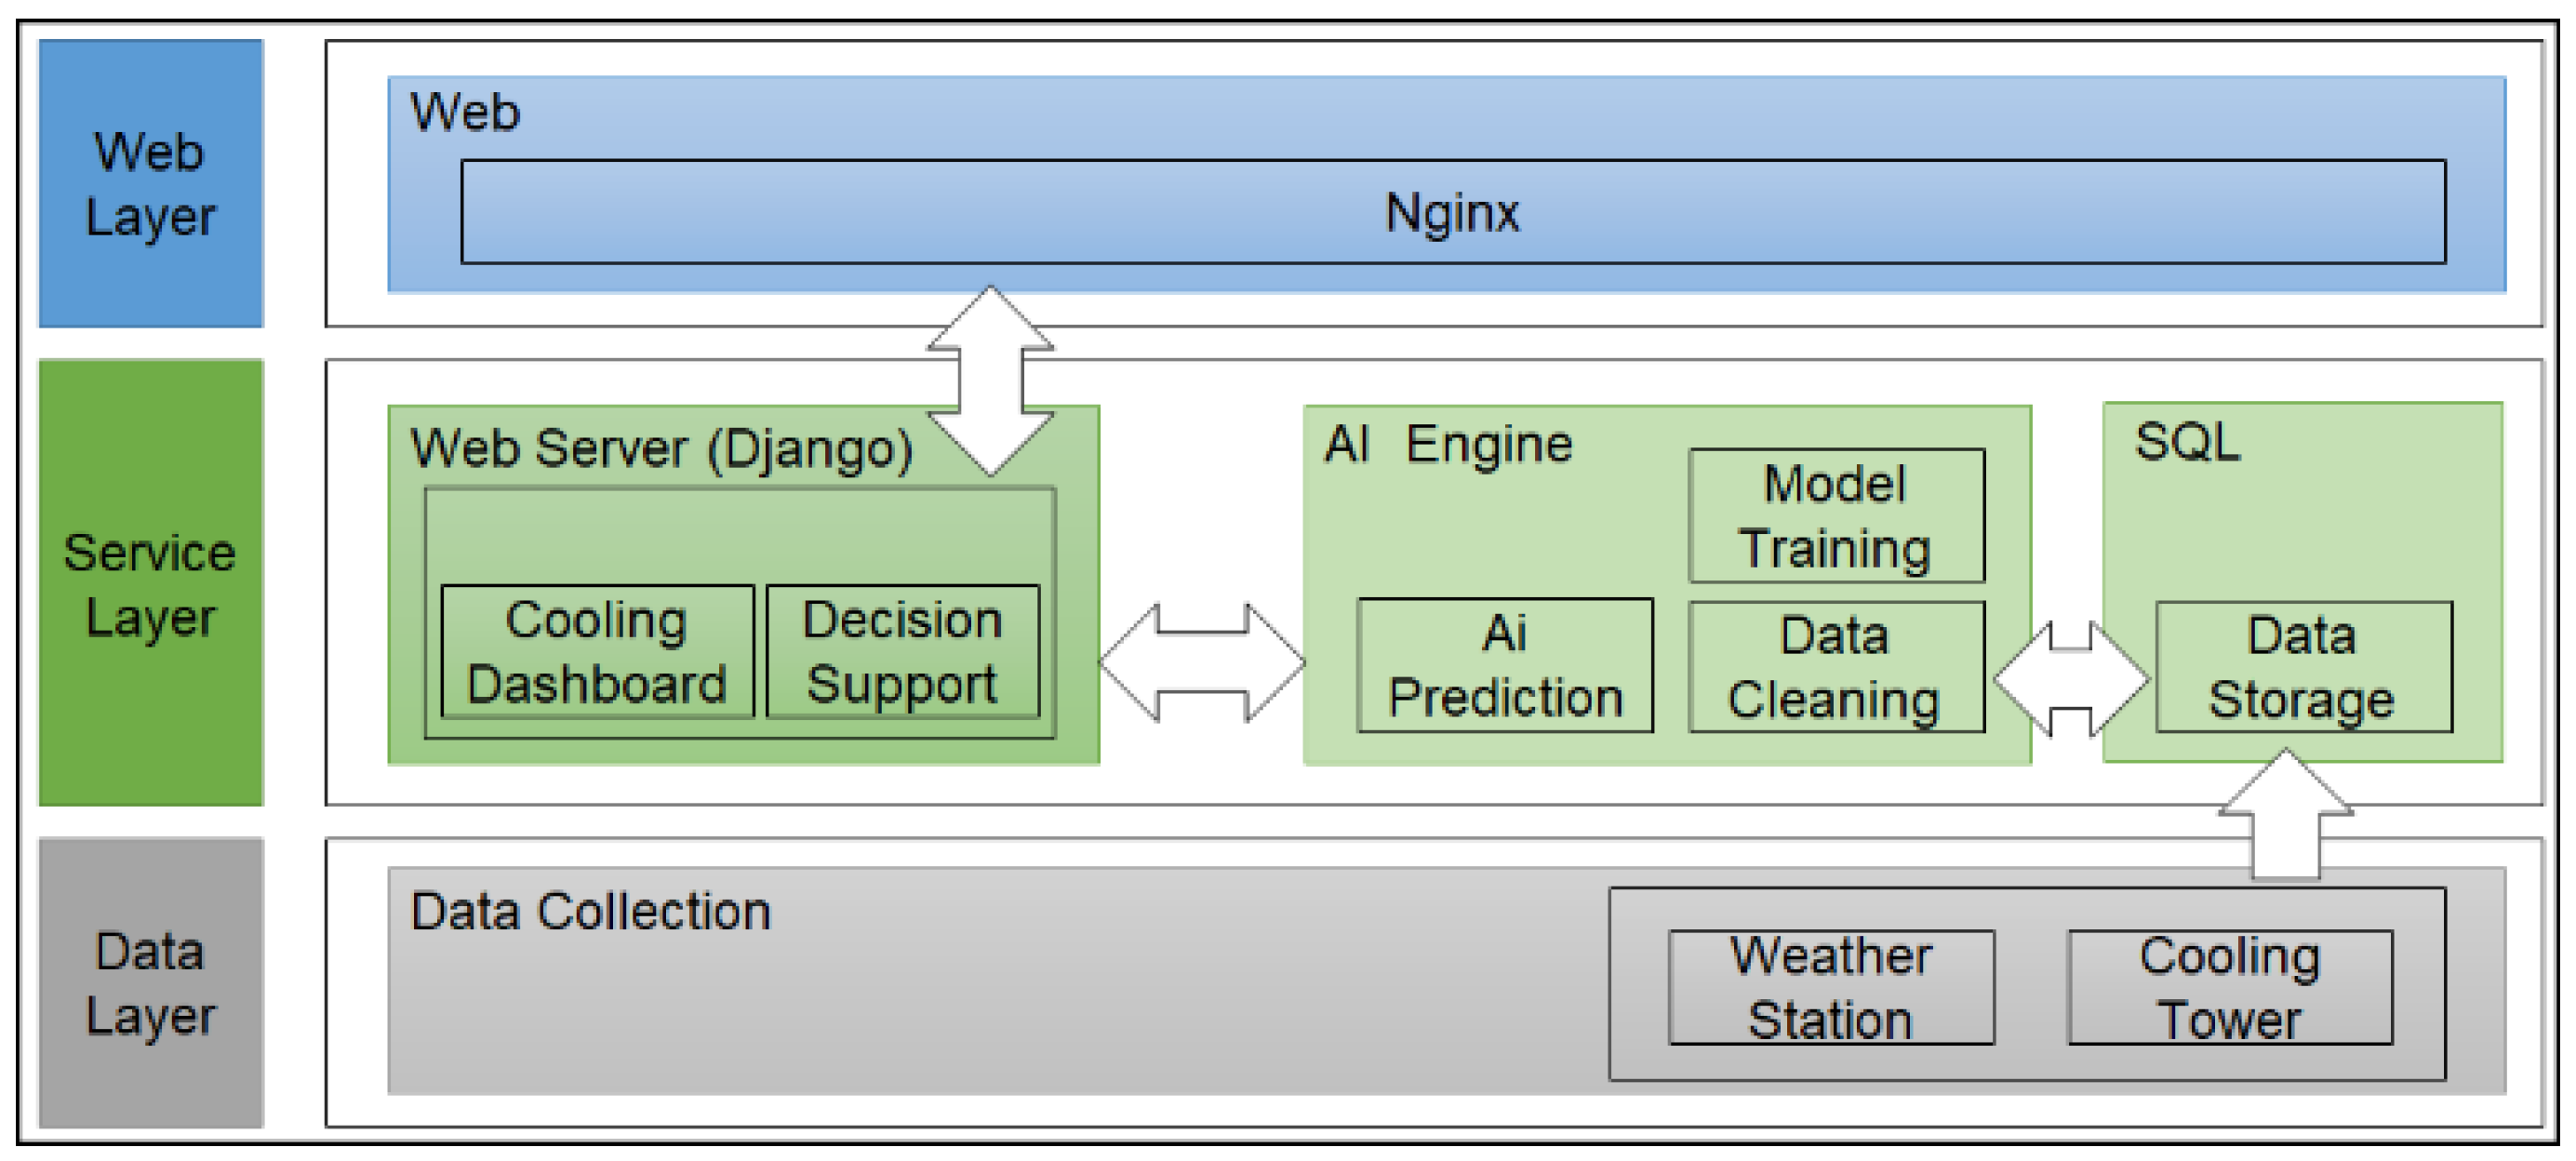
The system integrates AI computation, web services, and data collection functionalities to provide real-time monitoring and decision support. The hardware and software architectures of the system are illustrated in
Figure 1 and
Figure 2.
3.2.1. Hardware Deployment
The AI server is responsible for model training, prediction computation, and data collection. A virtual machine hosts the Django web application, a PostgreSQL database, and an Nginx reverse proxy. The web server handles the Django application and presents fan operation recommendations using indicator lights (green: maintain, orange: turn off, and red: turn on). The system components are interconnected via the local area network and virtual networks.
3.2.2. Software Layered Architecture
As shown in
Figure 2, the software architecture adopts a three-layer design.
Web layer: Nginx handles HTTP and HTTPS requests, forwarding dynamic requests to the Django backend, providing browser access to system services.
Service layer: This layer consists of the web server, the AI engine, and the SQL database (PostgreSQL). The web server supplies the dashboard, historical data queries, and decision interfaces. The AI engine is responsible for data prediction and model training. The SQL database stores all system data and provides backend programs with the necessary data for processing.
Data layer: Data integration is performed via web APIs, which collect real-time monitoring data from meteorological stations and the cooling tower, serving as the data source required for system operation.
3.3. Decision Logic Design
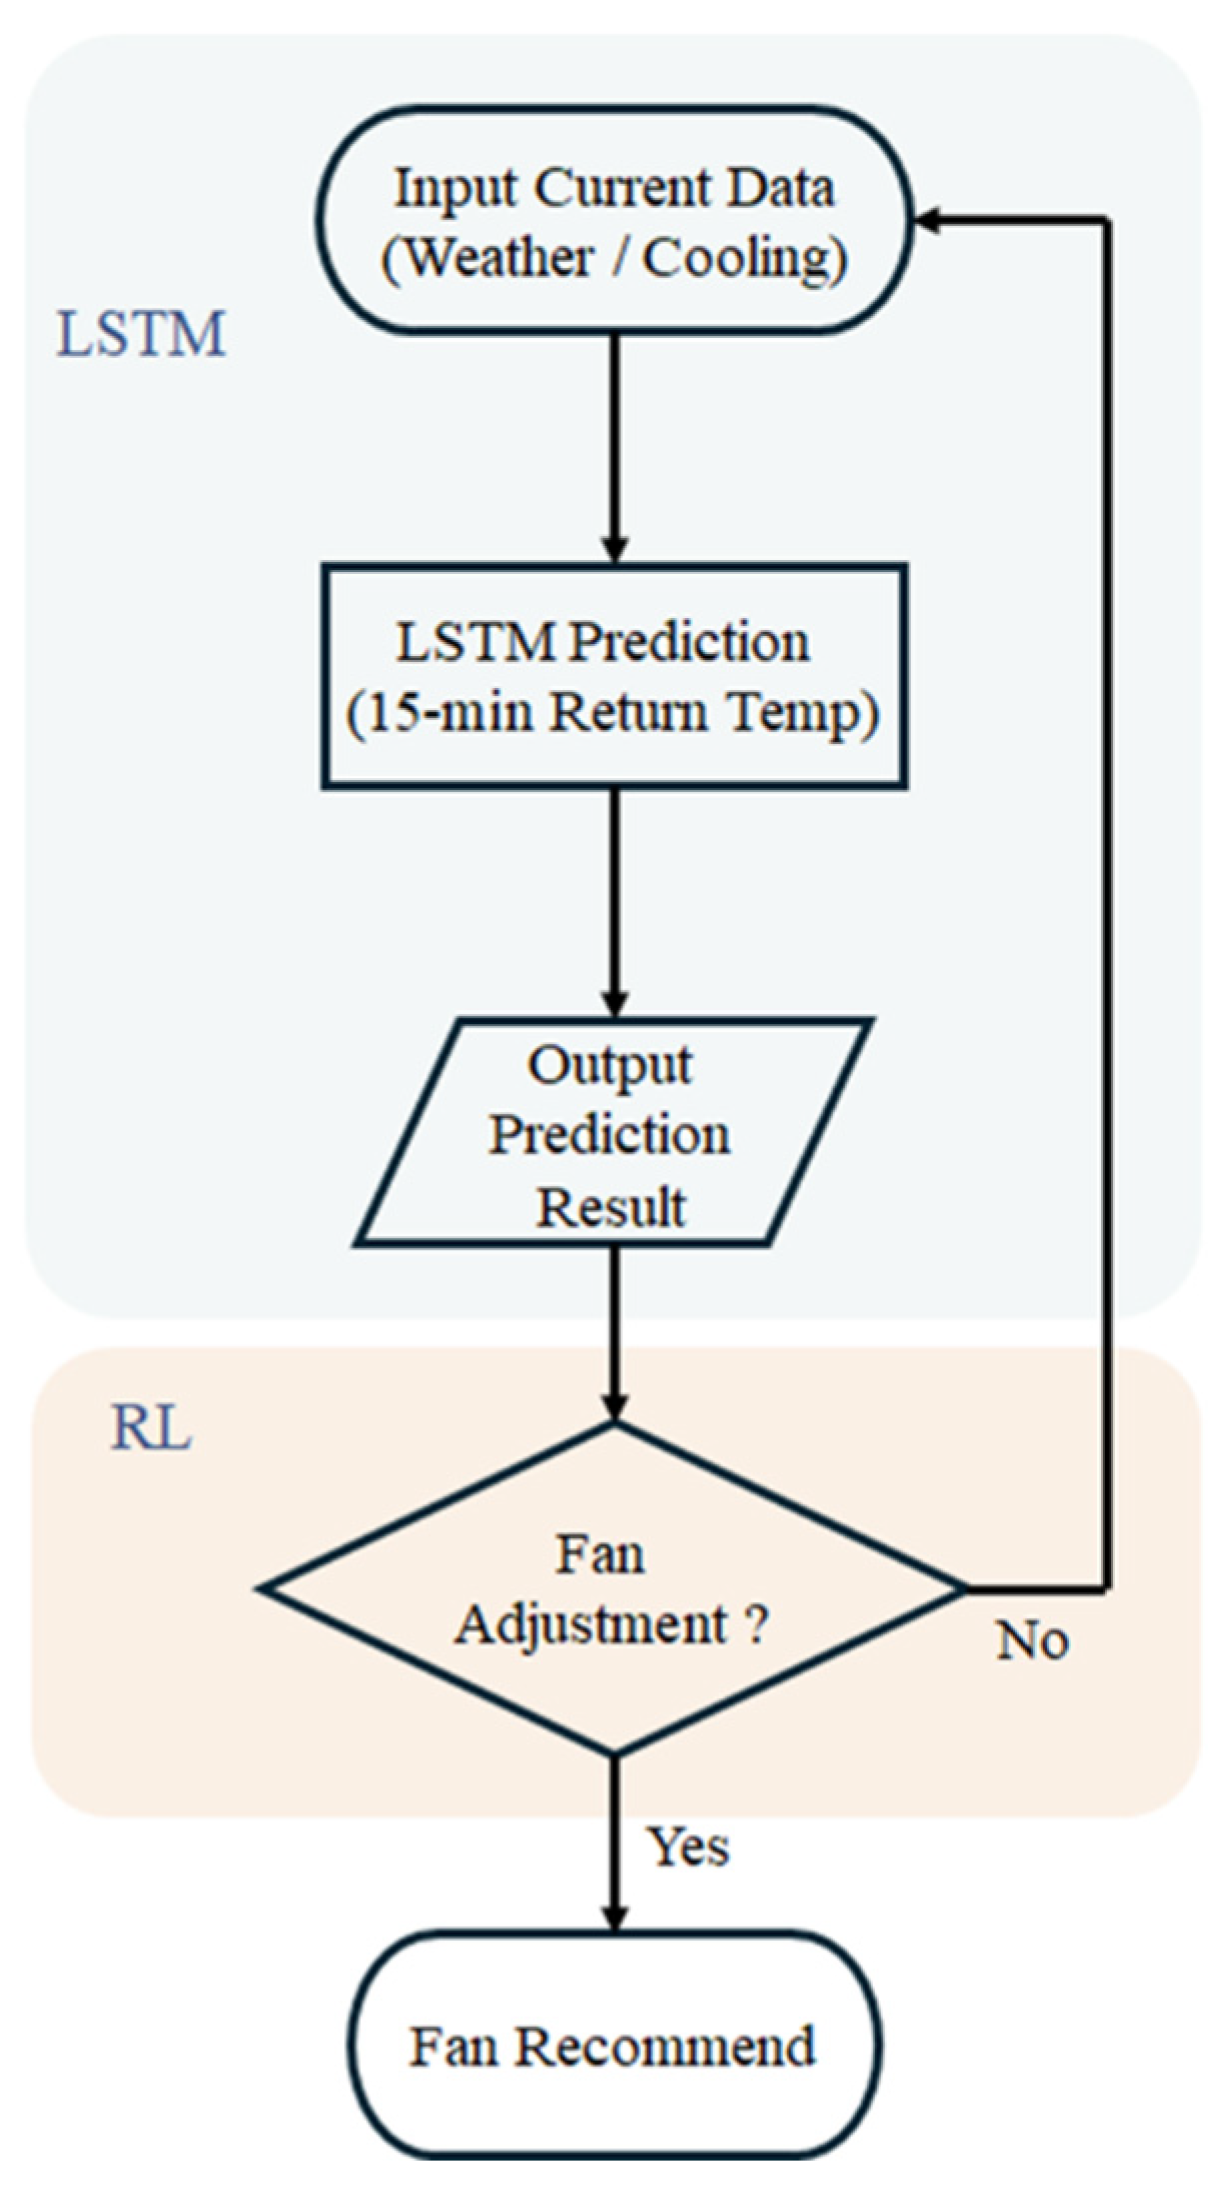
The system developed integrates an LSTM-based temperature prediction model and an RL-based decision evaluation mechanism to establish a complete fan control recommendation process. The overall system architecture and decision-making flow are illustrated in
Figure 3.
The system collects environmental data from weather stations and operational data from the water tower, which are input into the LSTM model to predict the return water temperature for the next 15 min. The predicted results, together with the current system state, including the current temperature and the number of operating fans, are subsequently fed into the RL model. Through a reward-based evaluation, the RL model estimates the expected outcomes of three fan operation actions, namely turn on, turn off, and maintain; selects the optimal control recommendation; and presents it to operators via a web interface. This decision cycle is executed every 15 min to ensure continuous monitoring of temperature variations and provide timely operational guidance.
3.3.1. Data Collection
The system collects water tower and environmental data as model inputs. Water tower data are obtained from the plant’s distributed control system (DCS), which records relevant parameters every minute, including return water temperature, outlet water temperature, water volume, and the operational status of twelve fans. Environmental data are sourced from a local meteorological station, including ambient temperature and atmospheric pressure.
3.3.2. Feature Processing
Raw data are processed through feature engineering. The system utilizes 24 feature variables for training the LSTM model, as listed in
Table 1. These features include environmental parameters, raw water tower data, temperature difference indicators, and efficiency indicators. Environmental and tower parameters describe the current state of the system, while temperature difference features reflect the cooling efficiency of the tower. Efficiency features quantify the temperature reduction achieved by a single fan.
3.3.3. LSTM Temperature Prediction
An LSTM model is employed for deep learning-based time-series prediction of the return water temperature 15 min ahead. This prediction serves as the state input for subsequent RL decision evaluation. The model utilizes a two-layer LSTM architecture, taking the past 15 min of system states—including the 24 features listed in
Table 1—as inputs and outputting the predicted return water temperature 15 min later.
3.3.4. RL Decision Mechanism
The RL model combines the LSTM-predicted temperature with the current system state to evaluate the impact of fan operations on temperature control. Three fan operation actions—turn on, maintain, and turn off—are defined within the system. Through a reward-based learning mechanism, the RL model learns the optimal control strategy to keep the outlet water temperature within the target range of 30–31 °C.
The reward mechanism is designed based on an ideal outlet water temperature of 30.5 °C. When the predicted temperature approaches 30.5 °C, the system assigns a higher reward score, whereas larger deviations yield lower scores. This enables the model to learn control policies that maintain temperature stability. The RL model evaluates the effects of the three fan operations by considering the current temperature state, LSTM prediction results, and fan cooling efficiency and selects the operation that maintains the temperature within the target range. The decision evaluation process is executed every 15 min, generating operation suggestions that are displayed through the web interface.
3.4. Decision Support Interface
The system provides real-time decision support through a web-based interface to assist operators in fan control management. The interface design focuses on user experience, integrating AI-generated decision suggestions, real-time data monitoring, historical data analysis, and cooling tower management functions to create a comprehensive decision support environment.
3.4.1. Web System Architecture
The web system adopts a modular design that includes functional modules such as the system dashboard, cooling tower management, record query, AI model management, event management, and user management. The system dashboard serves as the core of decision support by providing real-time monitoring and operational recommendations. The cooling tower management module offers interfaces for tower monitoring and operational control. The record query module facilitates historical data analysis. The AI model management module provides model management and hardware performance monitoring. The event management module tracks system operation logs. The user management module supports access control and authorization management.
3.4.2. System Dashboard
The dashboard serves as the central decision support tool, providing real-time data monitoring and operational recommendations. The interface displays key parameters, including outlet water temperature, return water temperature, ambient temperature, and fan operating status. Temperature trend charts visualize both predicted and actual temperature variations. The dashboard automatically refreshes every minute to ensure data timeliness and real-time situational awareness.
When the AI model determines that fan operation needs to be adjusted, the dashboard issues real-time recommendations through pop-up alerts and blinking indicator lights. A flashing red light indicates a recommendation to turn on the fans, while a flashing orange light suggests turning off the fans. These visual cues allow operators to intuitively understand the system’s decisions and take appropriate action.
4. Results and Discussion
We conducted system verification in an actual manufacturing plant environment to evaluate the performance of the proposed AI-integrated decision support system. Representative cases were selected for analysis to observe how the system performs under real operational conditions.
During the testing period, the system operated continuously and collected cooling tower temperature data, fan operation states, and AI-generated recommendations. The experiment recorded fan operation suggestions, actual operator actions, and corresponding temperature variations to validate the effectiveness of both the decision logic and the interface presentation. The evaluation was conducted across three major aspects.
AI decision logic performance: Verification of the LSTM temperature prediction and RL decision evaluation mechanisms, analyzing the accuracy and effectiveness of the fan operation recommendations generated under different temperature conditions.
Temperature control performance: Evaluation of temperature regulation after executing fan operations based on system recommendations, analyzing whether the outlet water temperature could be effectively maintained within the target range of 30–31 °C.
Web interface effectiveness: Verification of the decision support interface’s presentation and operator interaction performance, analyzing whether the interface design effectively conveys decision information and assists in operational judgment.
Since the decision interface presents real-time operational data, we used historical data queries and statistical analysis of fan operation effectiveness as the basis for performance evaluation.
4.1. Testing Method
The system performs AI-based decision evaluations every 15 min to provide fan operation recommendations based on the current system state. When the outlet water temperature exceeds the target range of 30–31 °C, the recommendation indicates either fan activation or deactivation. If the temperature remains within the target range, the recommendation is to maintain the current operation. When fan status changes occur, the recommendation is marked as Ignore for the following 30 min, as shown in
Table 2.
Table 2 presents the operational data of the decision support system during its deployment in a manufacturing plant. T(out) represents the outlet water temperature, T
in represents the return water temperature, and T
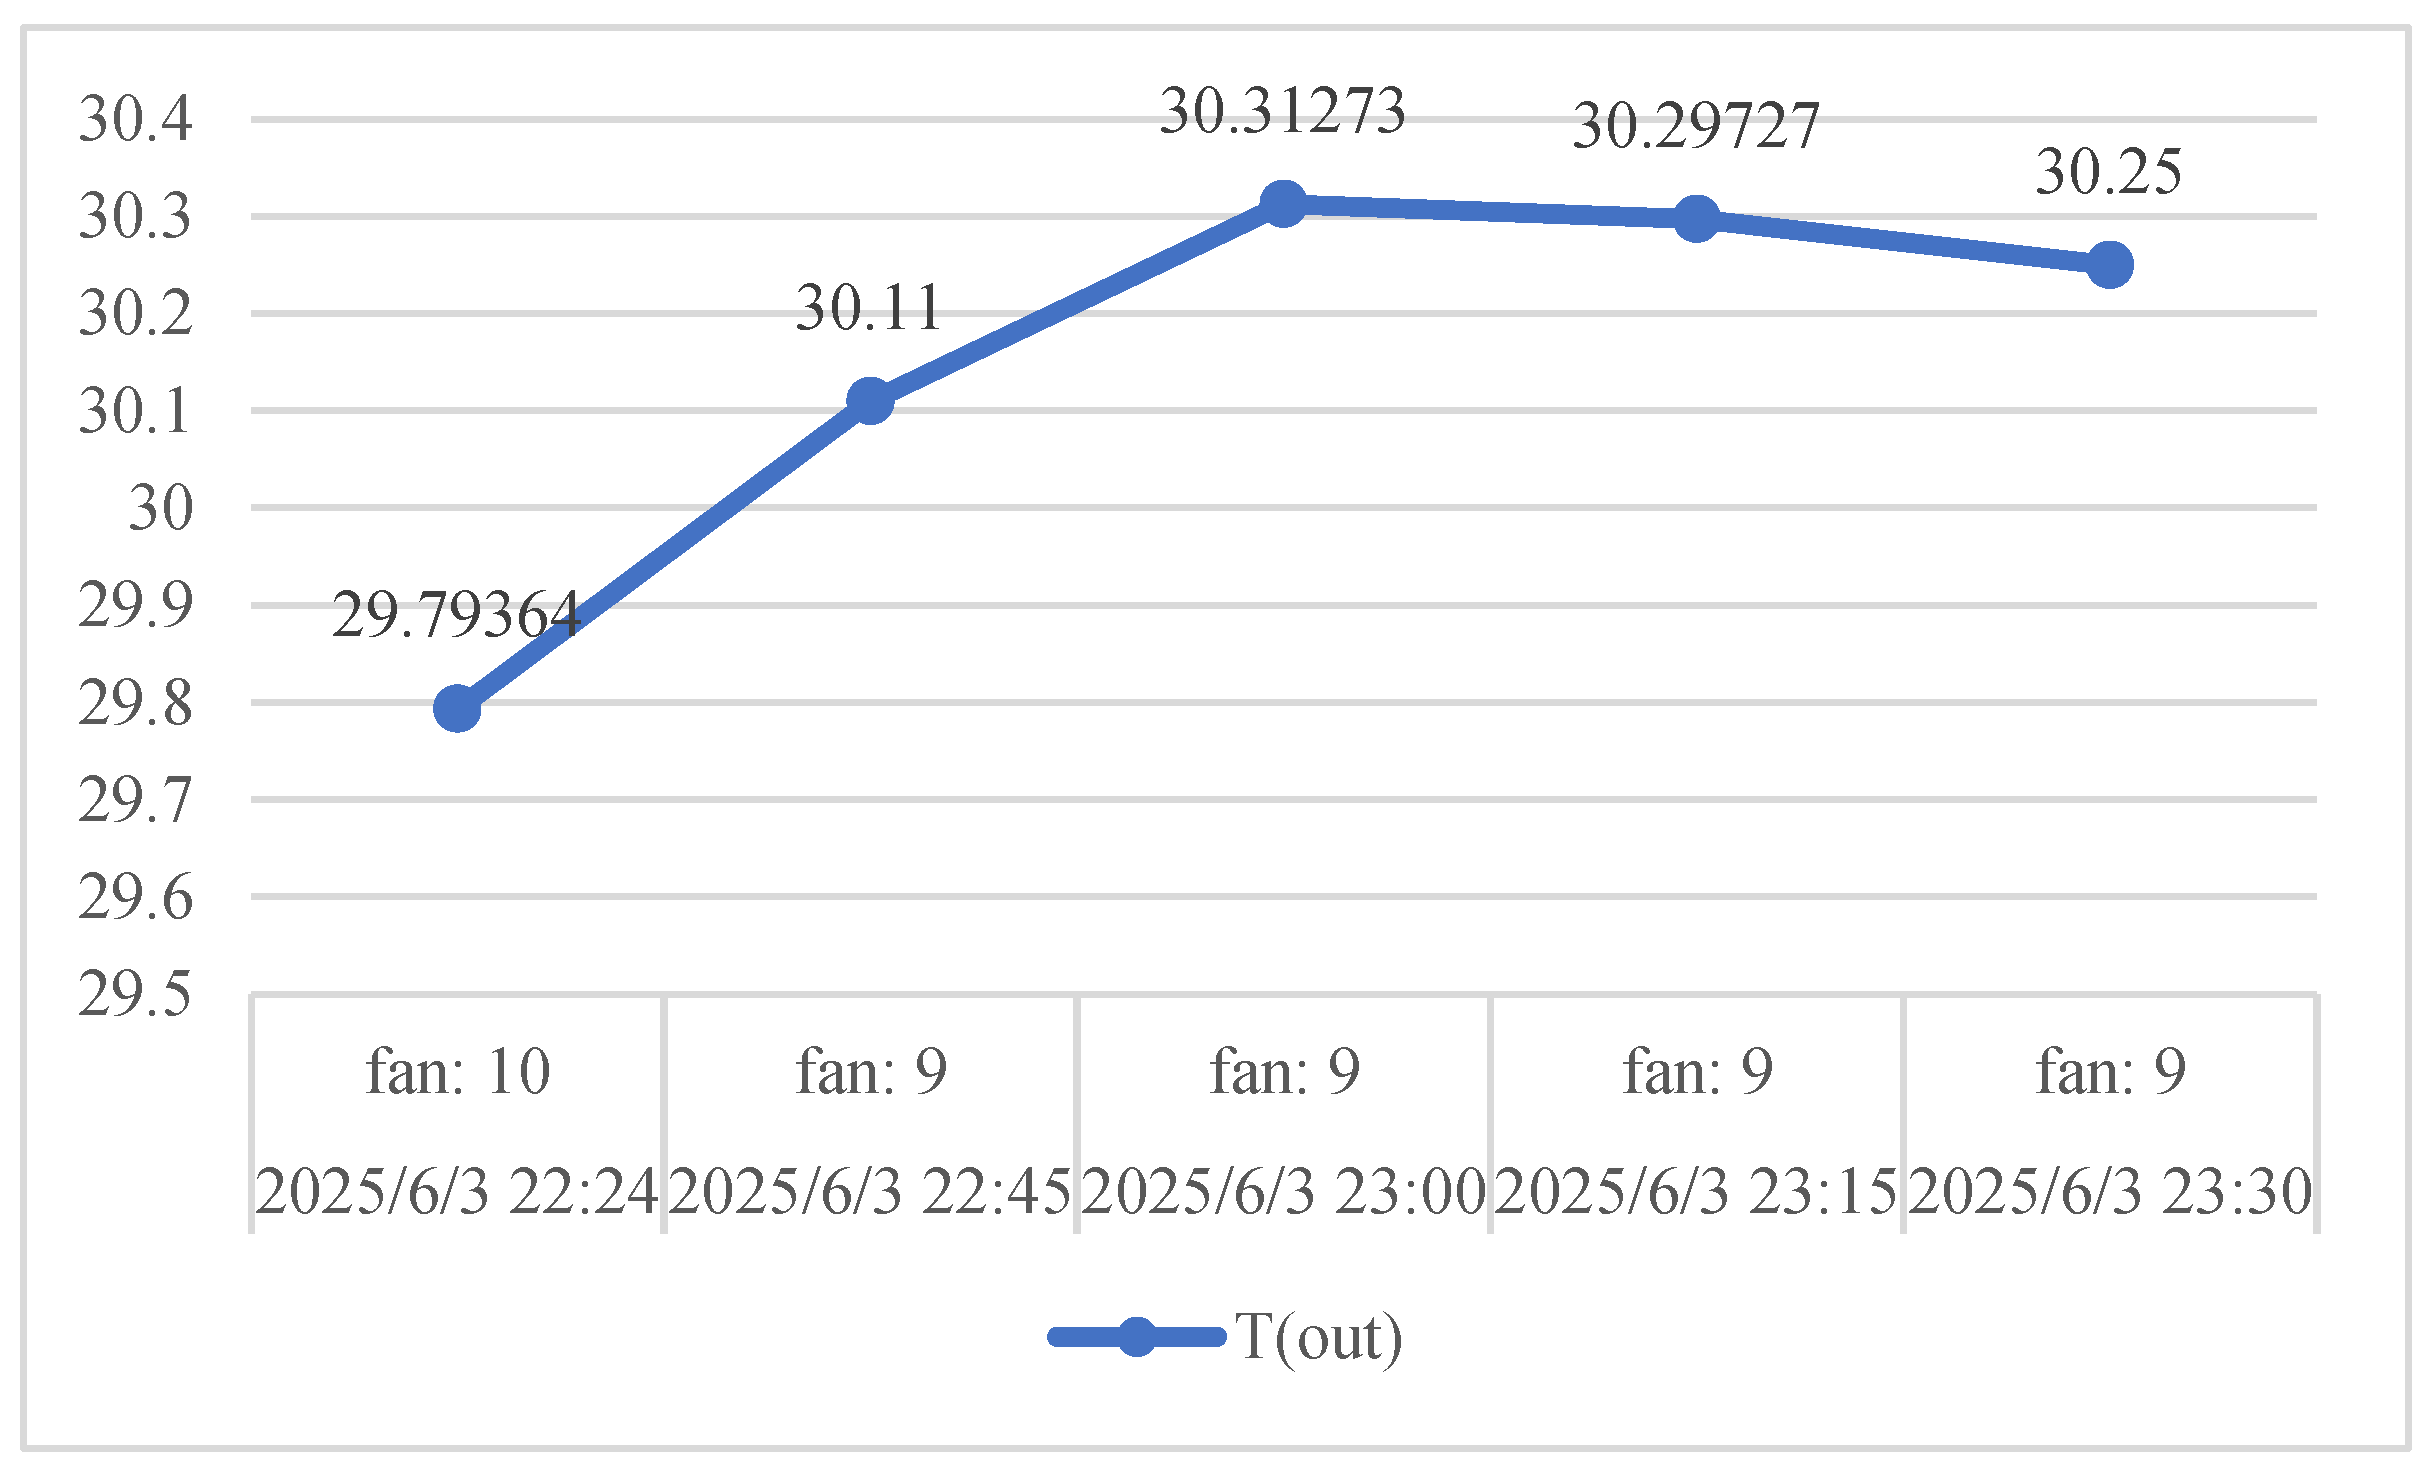
air denotes the ambient temperature. As illustrated in
Figure 4, at 22:24 on June 3, the outlet temperature was approximately 29.8 °C. After turning off one fan, the outlet temperature increased to 30.3 °C after four consecutive 15-min intervals, and the recommendation changed to “Maintain”. From the recorded data, it can be observed that after operators followed the decision support recommendations, the outlet temperature stabilized within approximately 15 min, with subsequent fluctuations limited to about 0.2–0.3 °C over the following 45 min.
4.2. Decision Support Performance Analysis
We analyzed case analyses, including the scenarios of fan activation, fan deactivation, and maintaining the current operation, to verify the effectiveness of the system’s decision support logic.
4.2.1. Case 1
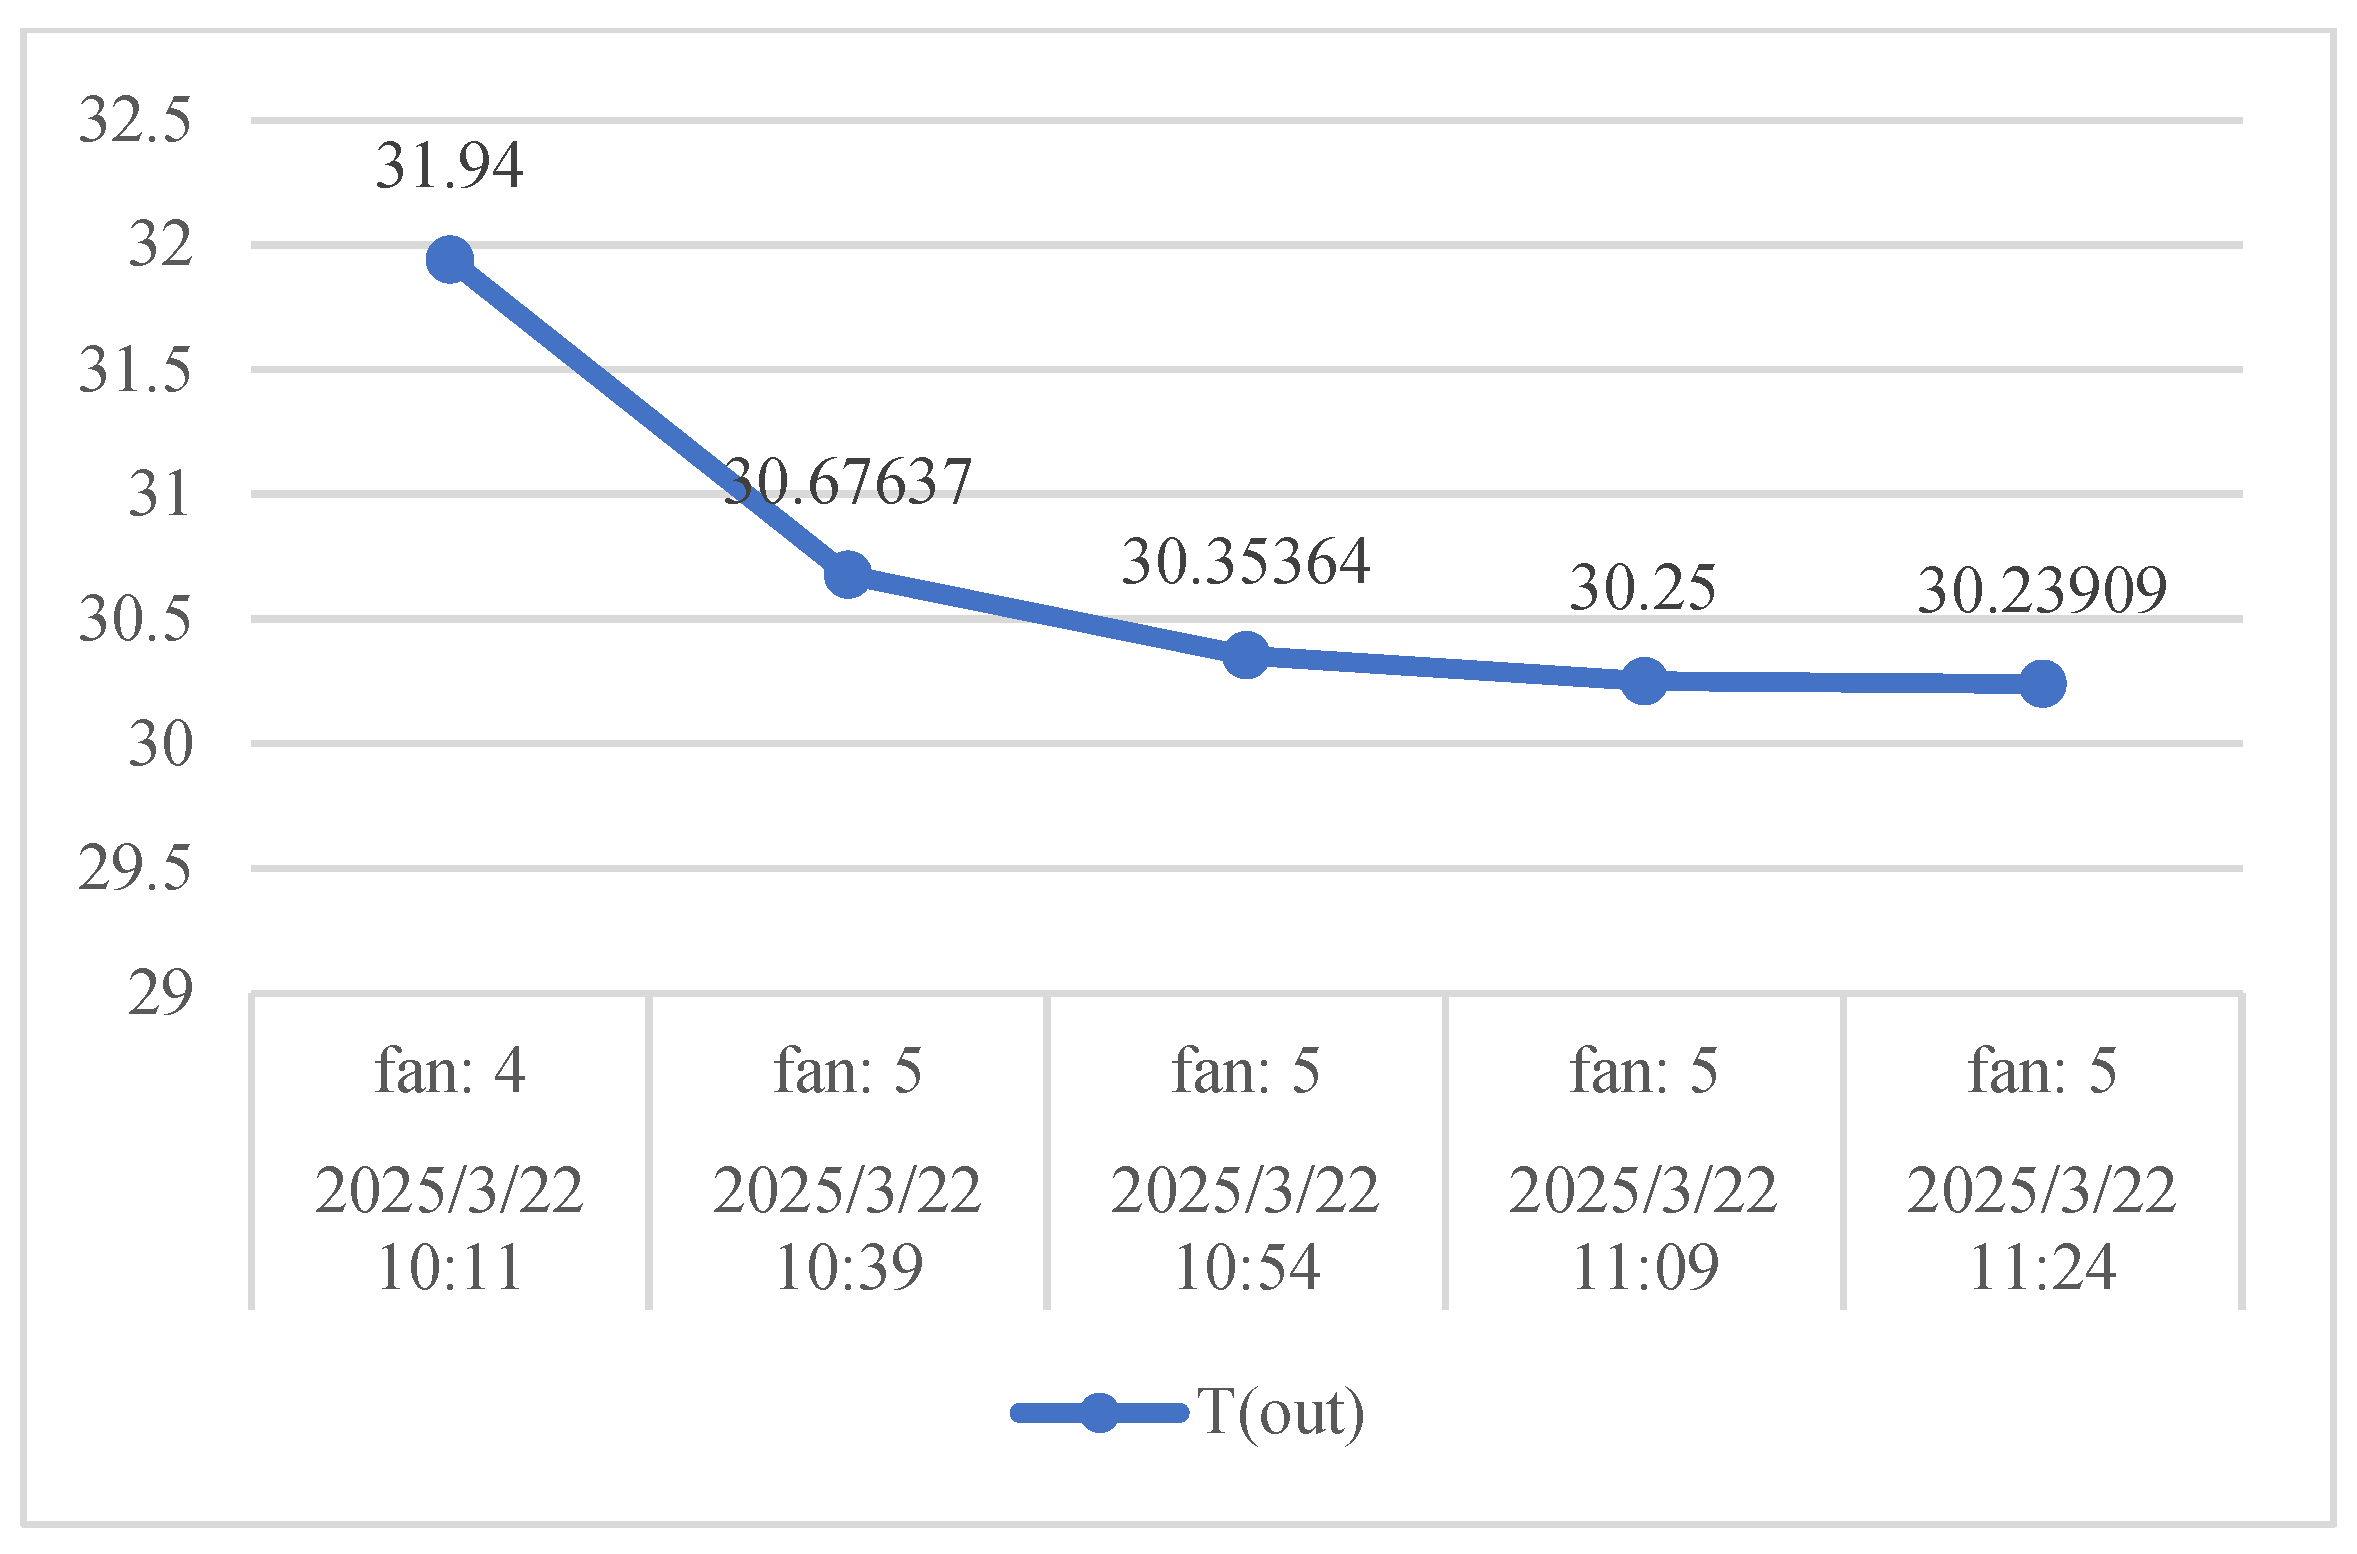
As shown in
Figure 5, after one cooling fan was activated, the outlet water temperature gradually decreased and reached a stable condition after approximately 30 min, with a total temperature reduction of about 1.7 °C. This indicates that when the operator followed the system’s recommendation to activate a fan, the temperature variation under the same total number of operating fans remained consistent, and the outlet temperature was successfully maintained within the target range of 30–31 °C.
4.2.2. Case 2
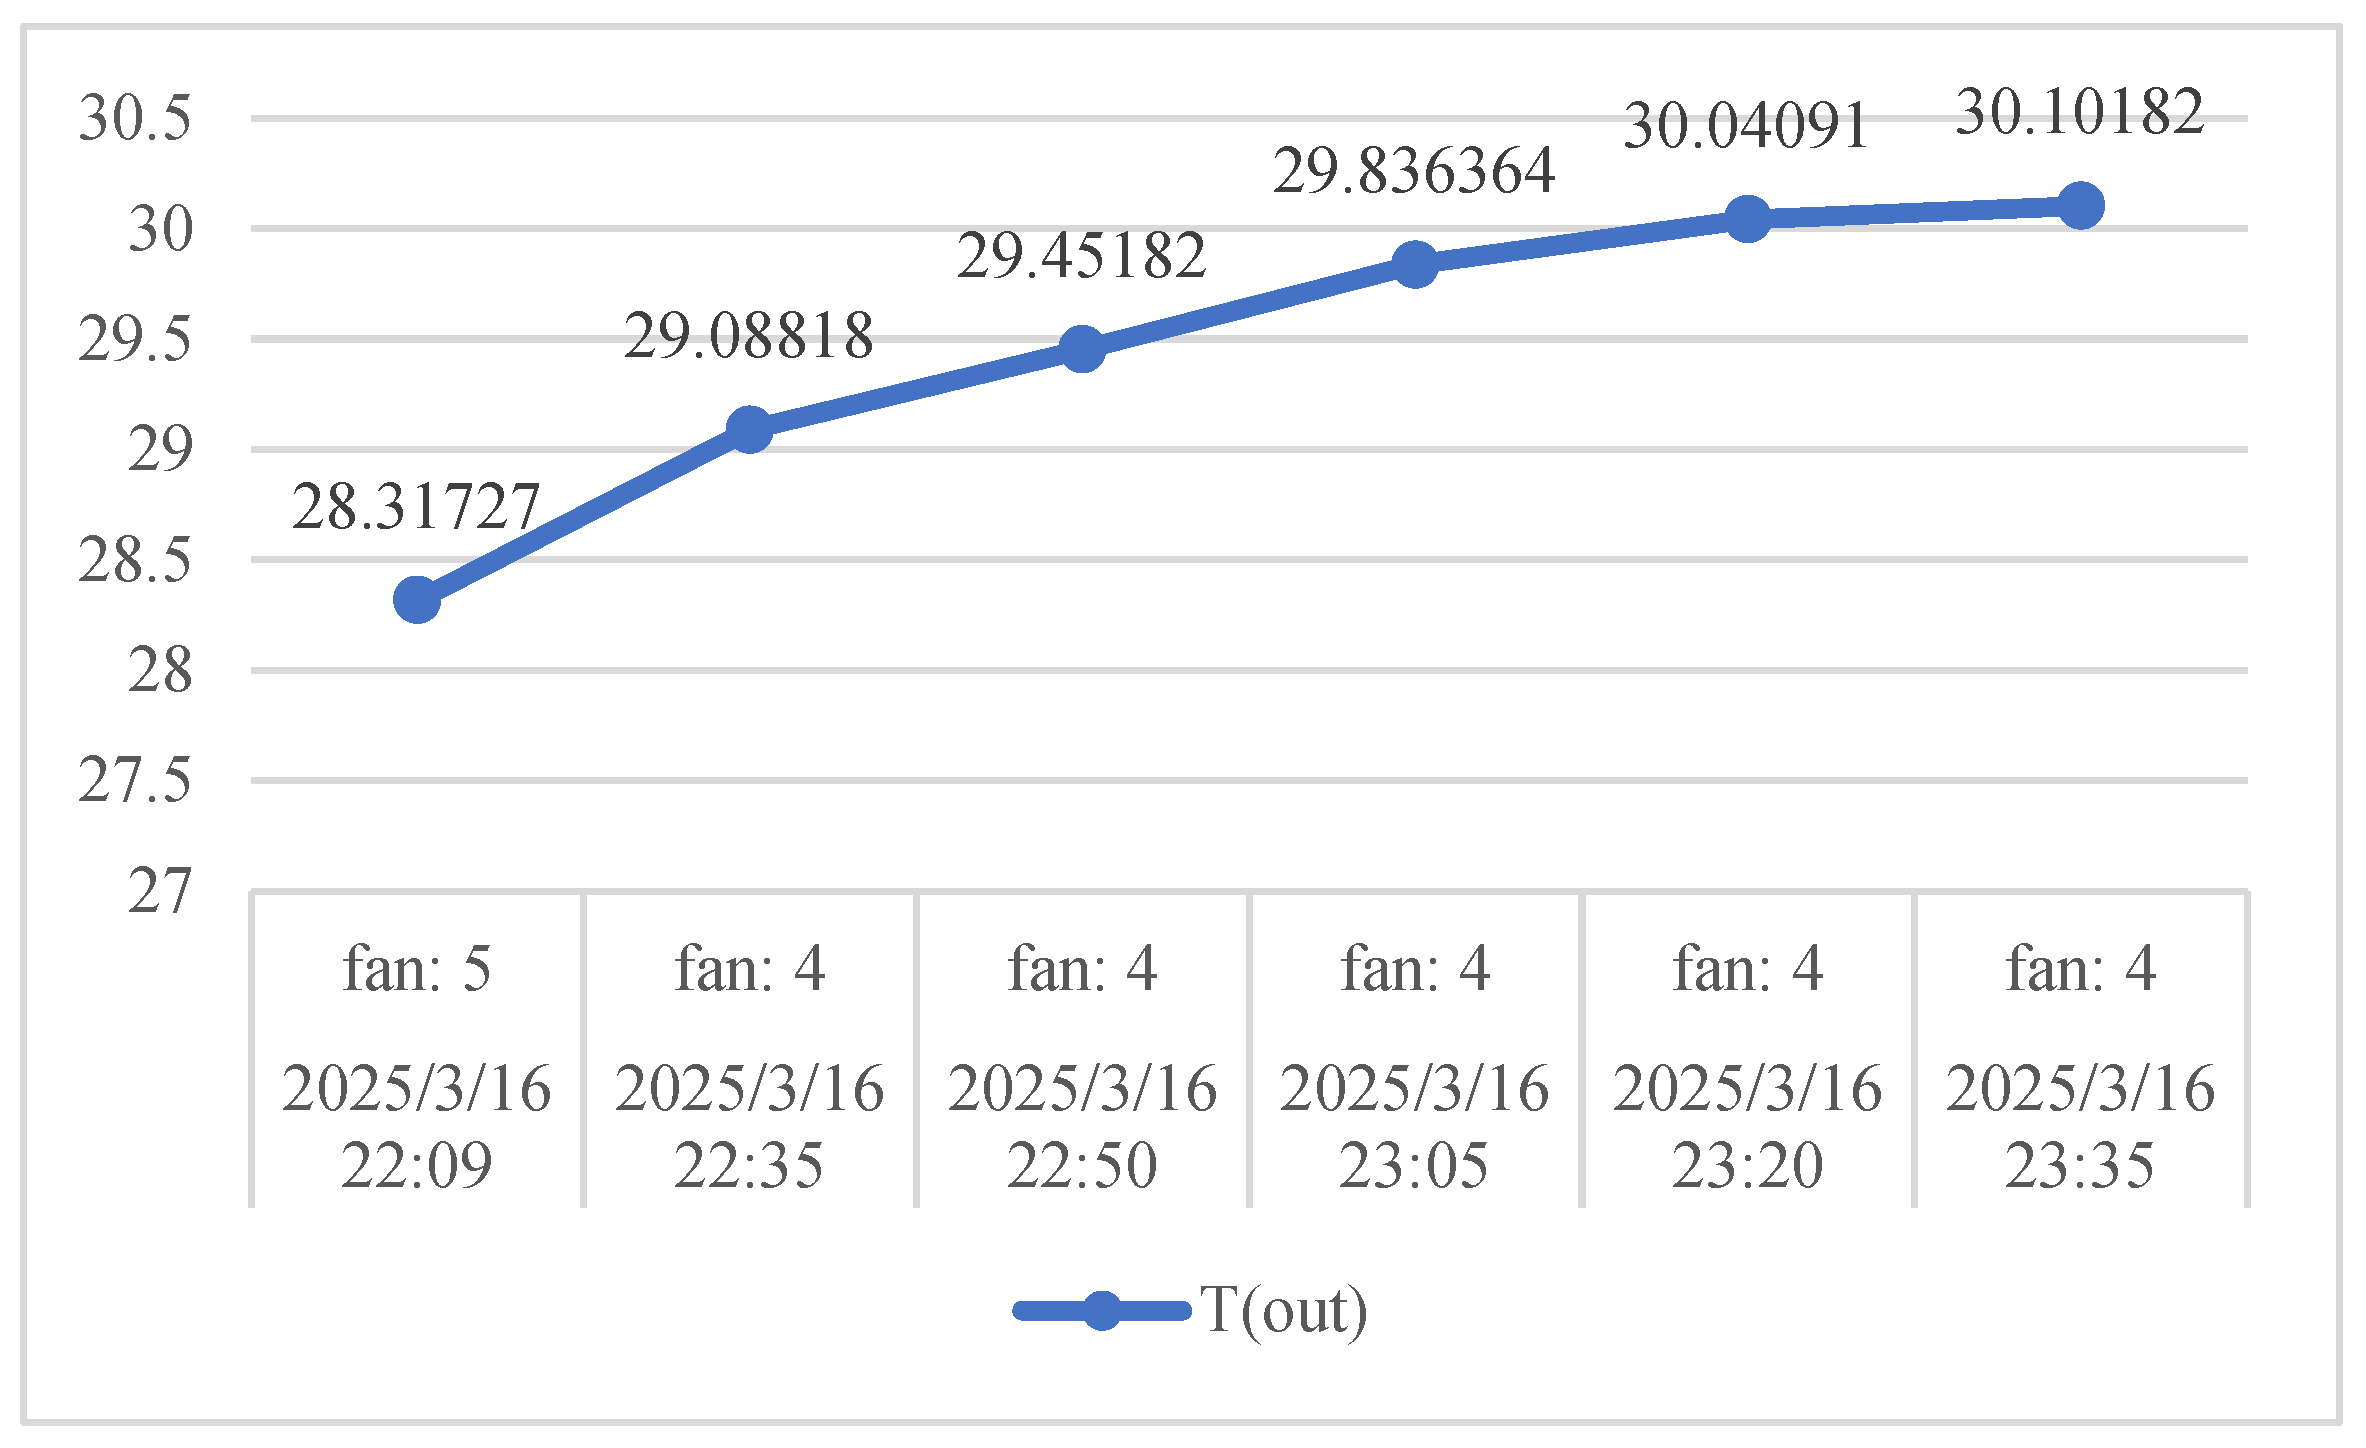
After one cooling fan was deactivated, the outlet water temperature gradually increased and returned to the target range after approximately 45 min, with a total temperature rise of about 1.7 °C (
Figure 6). This result demonstrates that when the operator followed the system’s recommendation to deactivate the fan, the outlet temperature gradually returned to the target range and remained stable under the same total number of operating fans.
4.2.3. Case 3
The initial outlet water temperature was relatively high. After the operator followed the recommendation to activate the cooling fan, the temperature decreased to approximately 30.4 °C within 15 min (
Table 3). However, prolonged fan operation caused the temperature to drop below the target range. Therefore, 15 min later, the system recommended deactivating the fan to maintain temperature stability. This figure illustrates the outlet temperature trend during fan operation and the corresponding changes in recommendations provided by the decision support evaluation process.
4.3. Web Interface Validation
4.3.1. Decision Recommendation Display
The system provides real-time AI-based decision recommendations through the web interface to assist operators in making fan control judgments. When the system recommends turning a fan on or off, a pop-up alert window appears on the dashboard, accompanied by a flashing indicator light. This visual cue clearly informs operators of the current fan operation recommendation.
4.3.2. Temperature Trend Line Chart
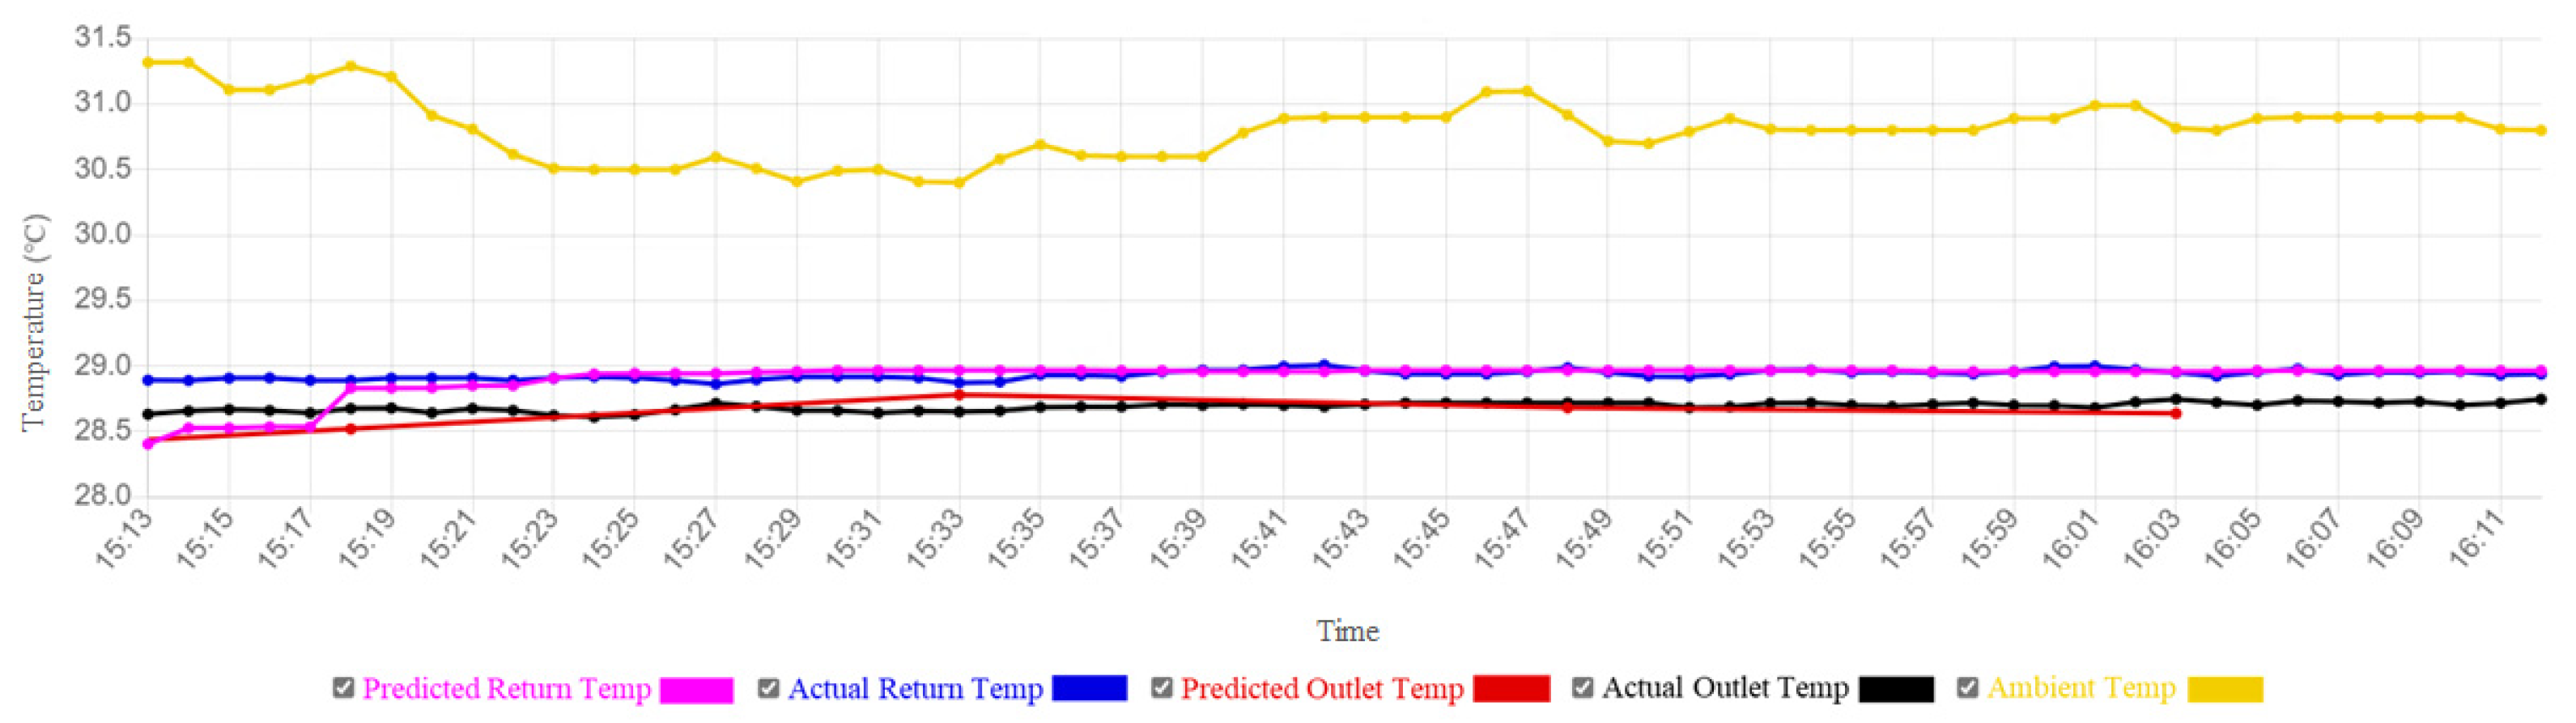
The system displays both predicted and actual temperature variations through a temperature trend line chart. This visualization helps operators understand the temperature trends and the rationale behind system recommendations, thereby enhancing their trust in the decision support mechanism.
Figure 7 presents the visualization of temperature trend curves, including predicted and actual return water, outlet water, and ambient temperatures.
4.3.3. Historical Data Query and Display
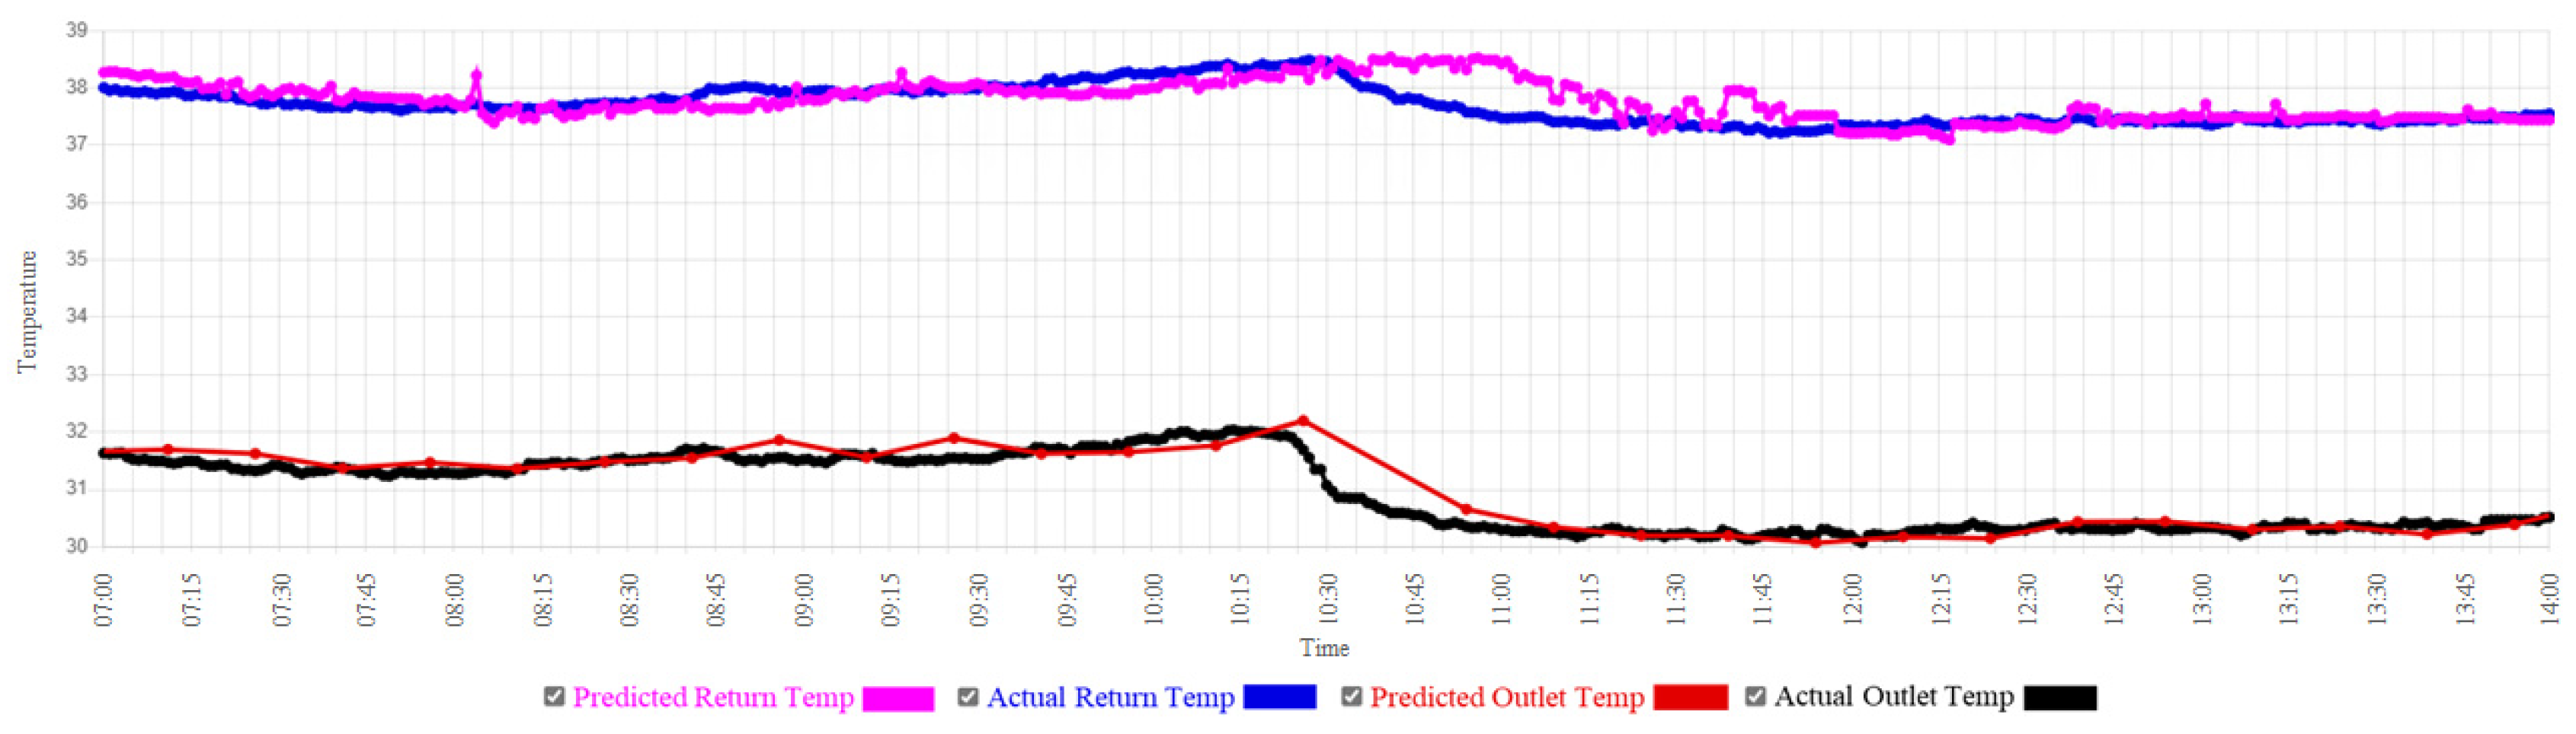
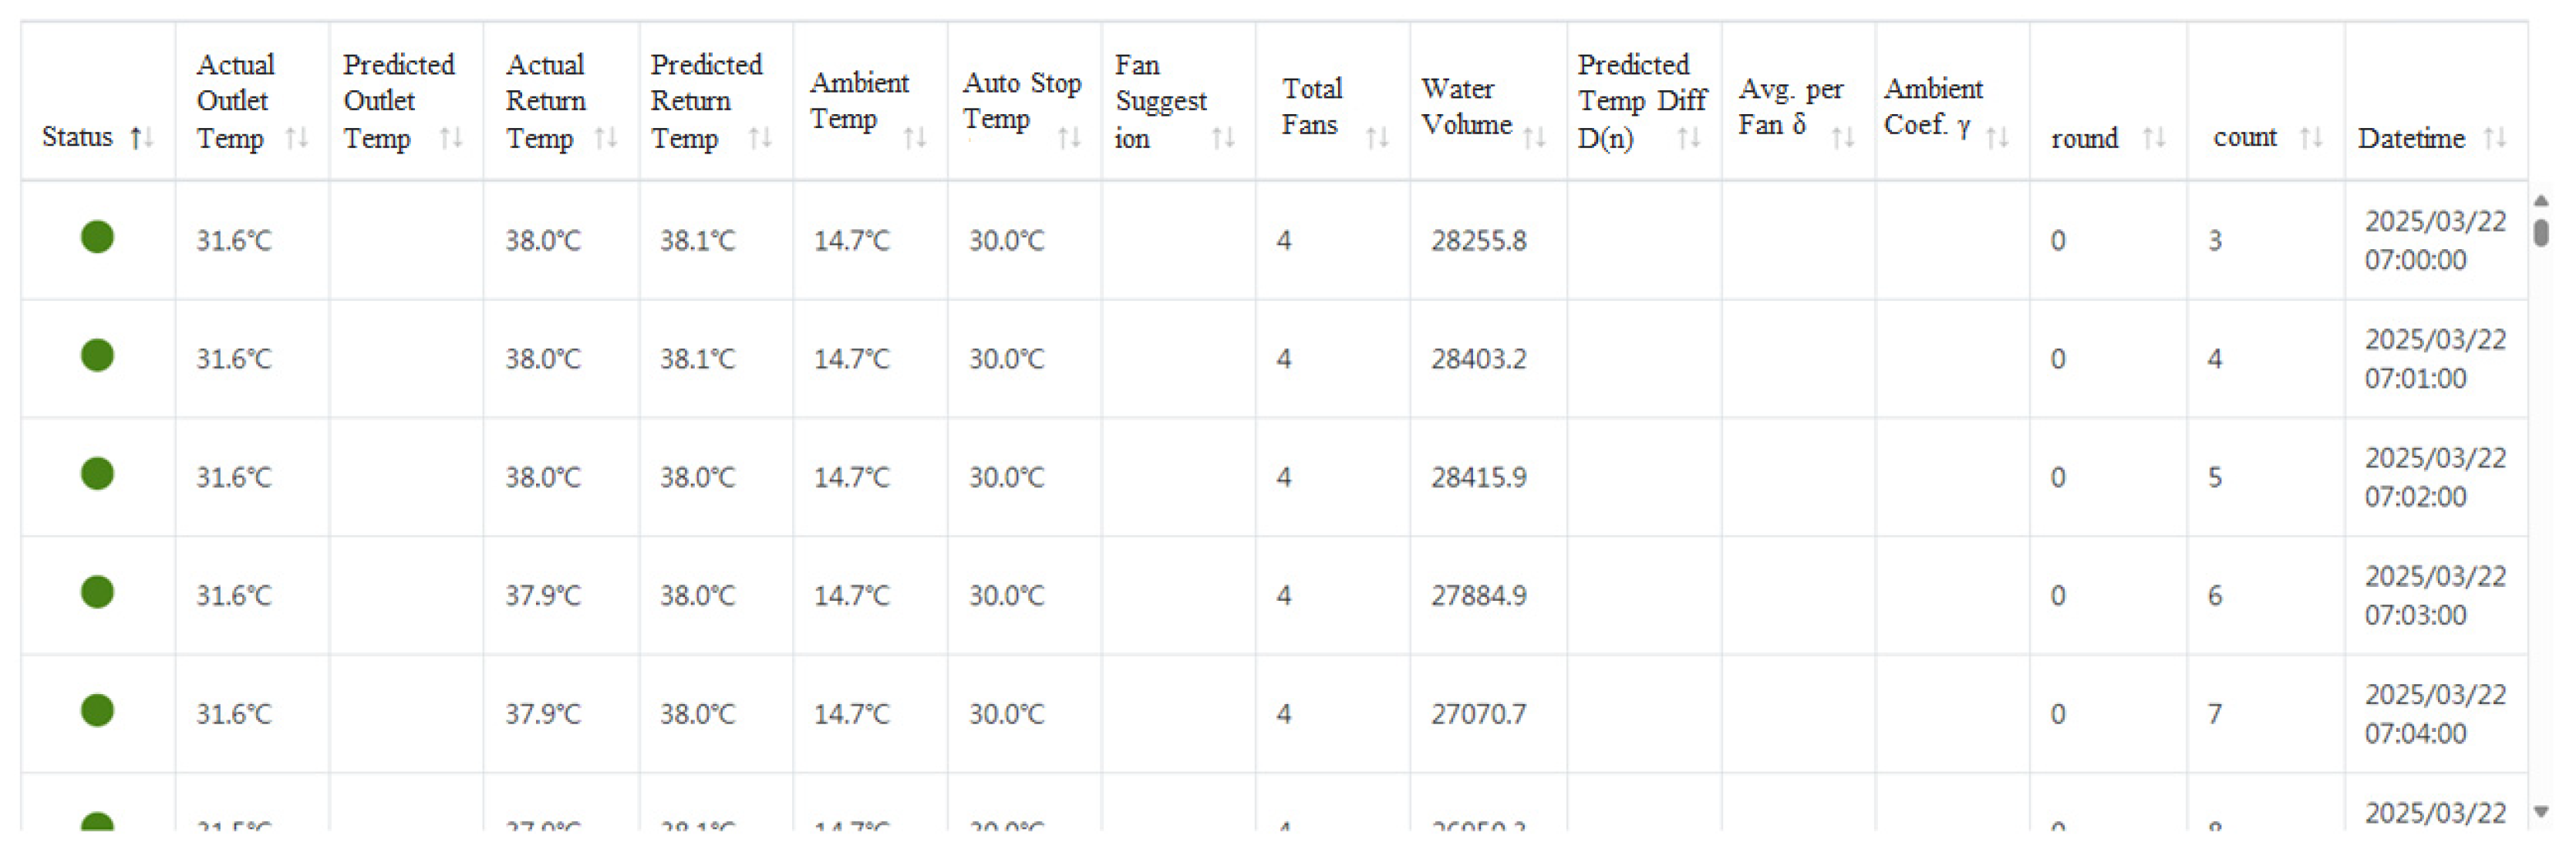
The web interface provides a historical data query function that allows users to select specific time intervals and visualize temperature trends and detailed data for the selected period.
Figure 8 and
Figure 9 show the historical data query interface, including trend charts and tabular data. The data table displays detailed temperature readings, fan operation statuses, and AI decision parameters and supports exporting reports in Portable Document Format and Comma-Separated Values formats. This feature enables operators to review past decision processes and evaluate the long-term performance of the system.
4.3.4. Fan Operation Statistics and Effectiveness Analysis
The web interface also includes a fan operation statistics function that analyzes the records and effectiveness of fan operations within a selected time range.
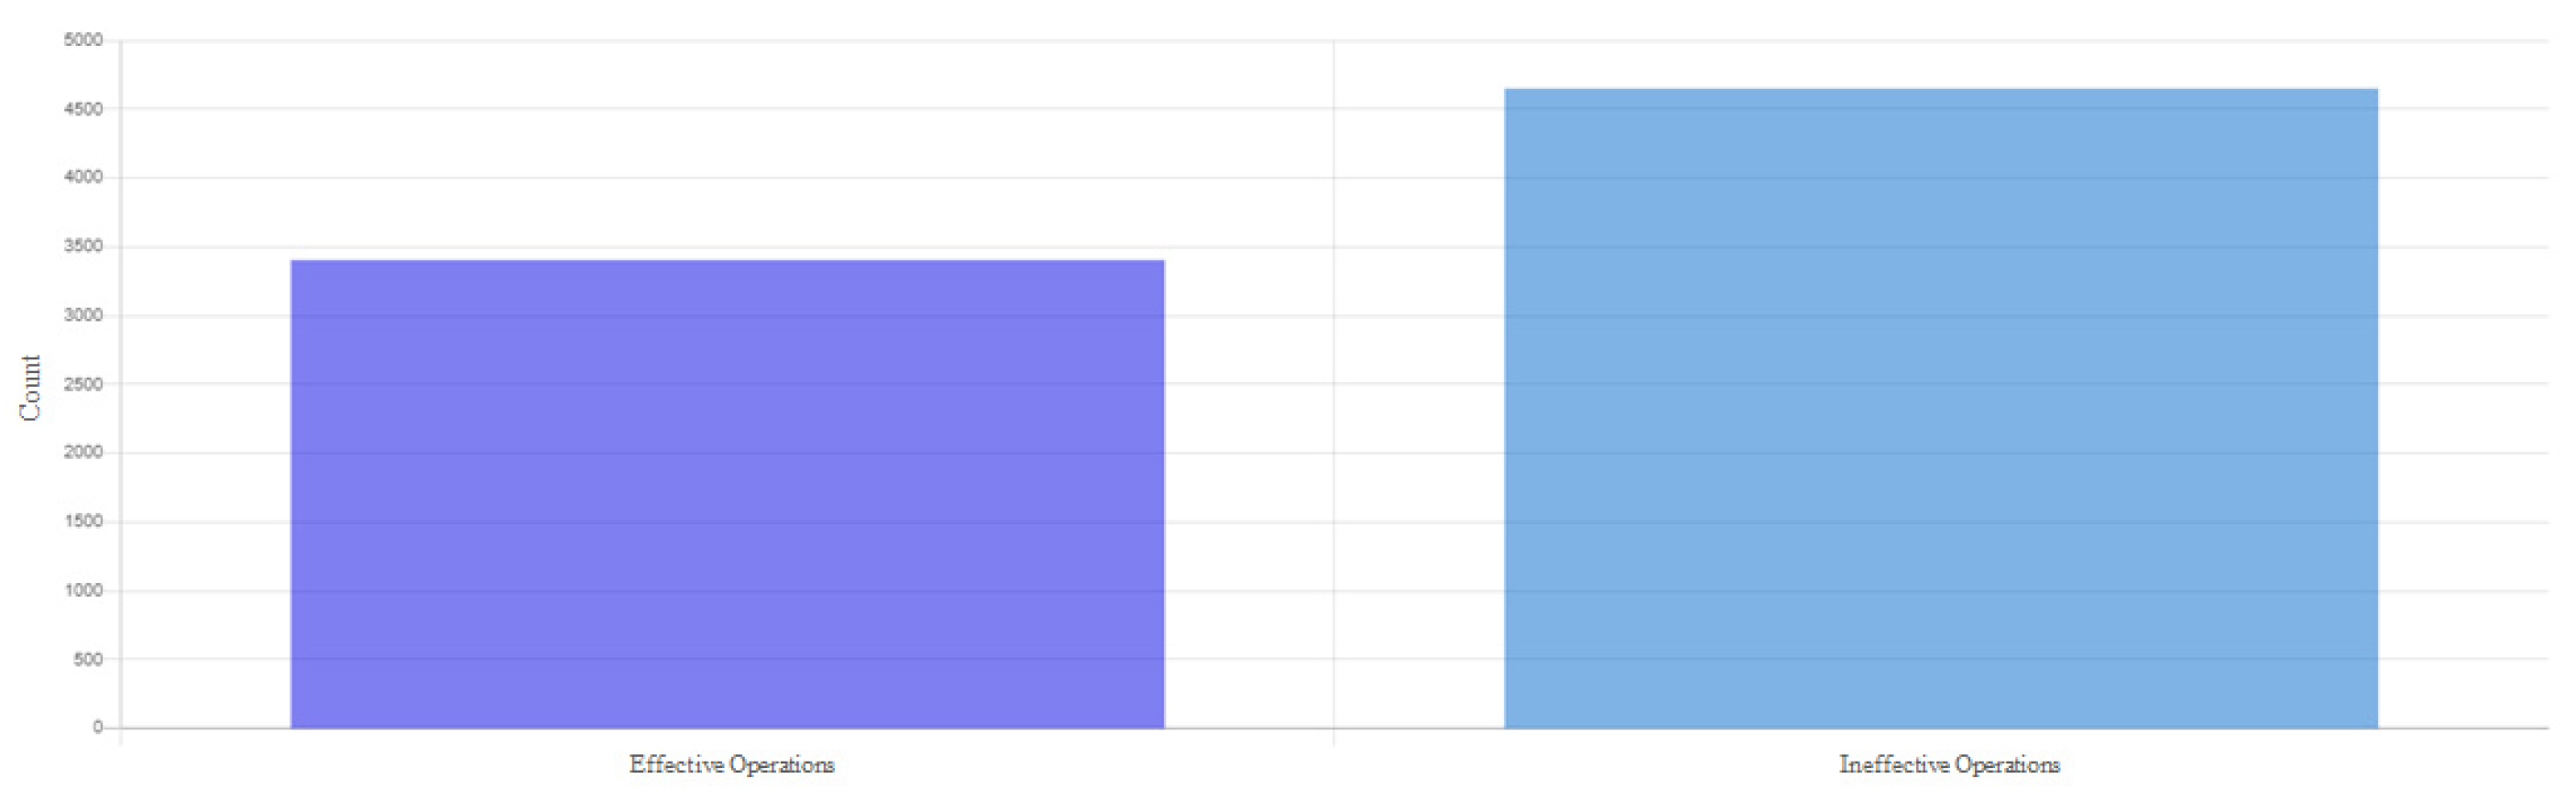
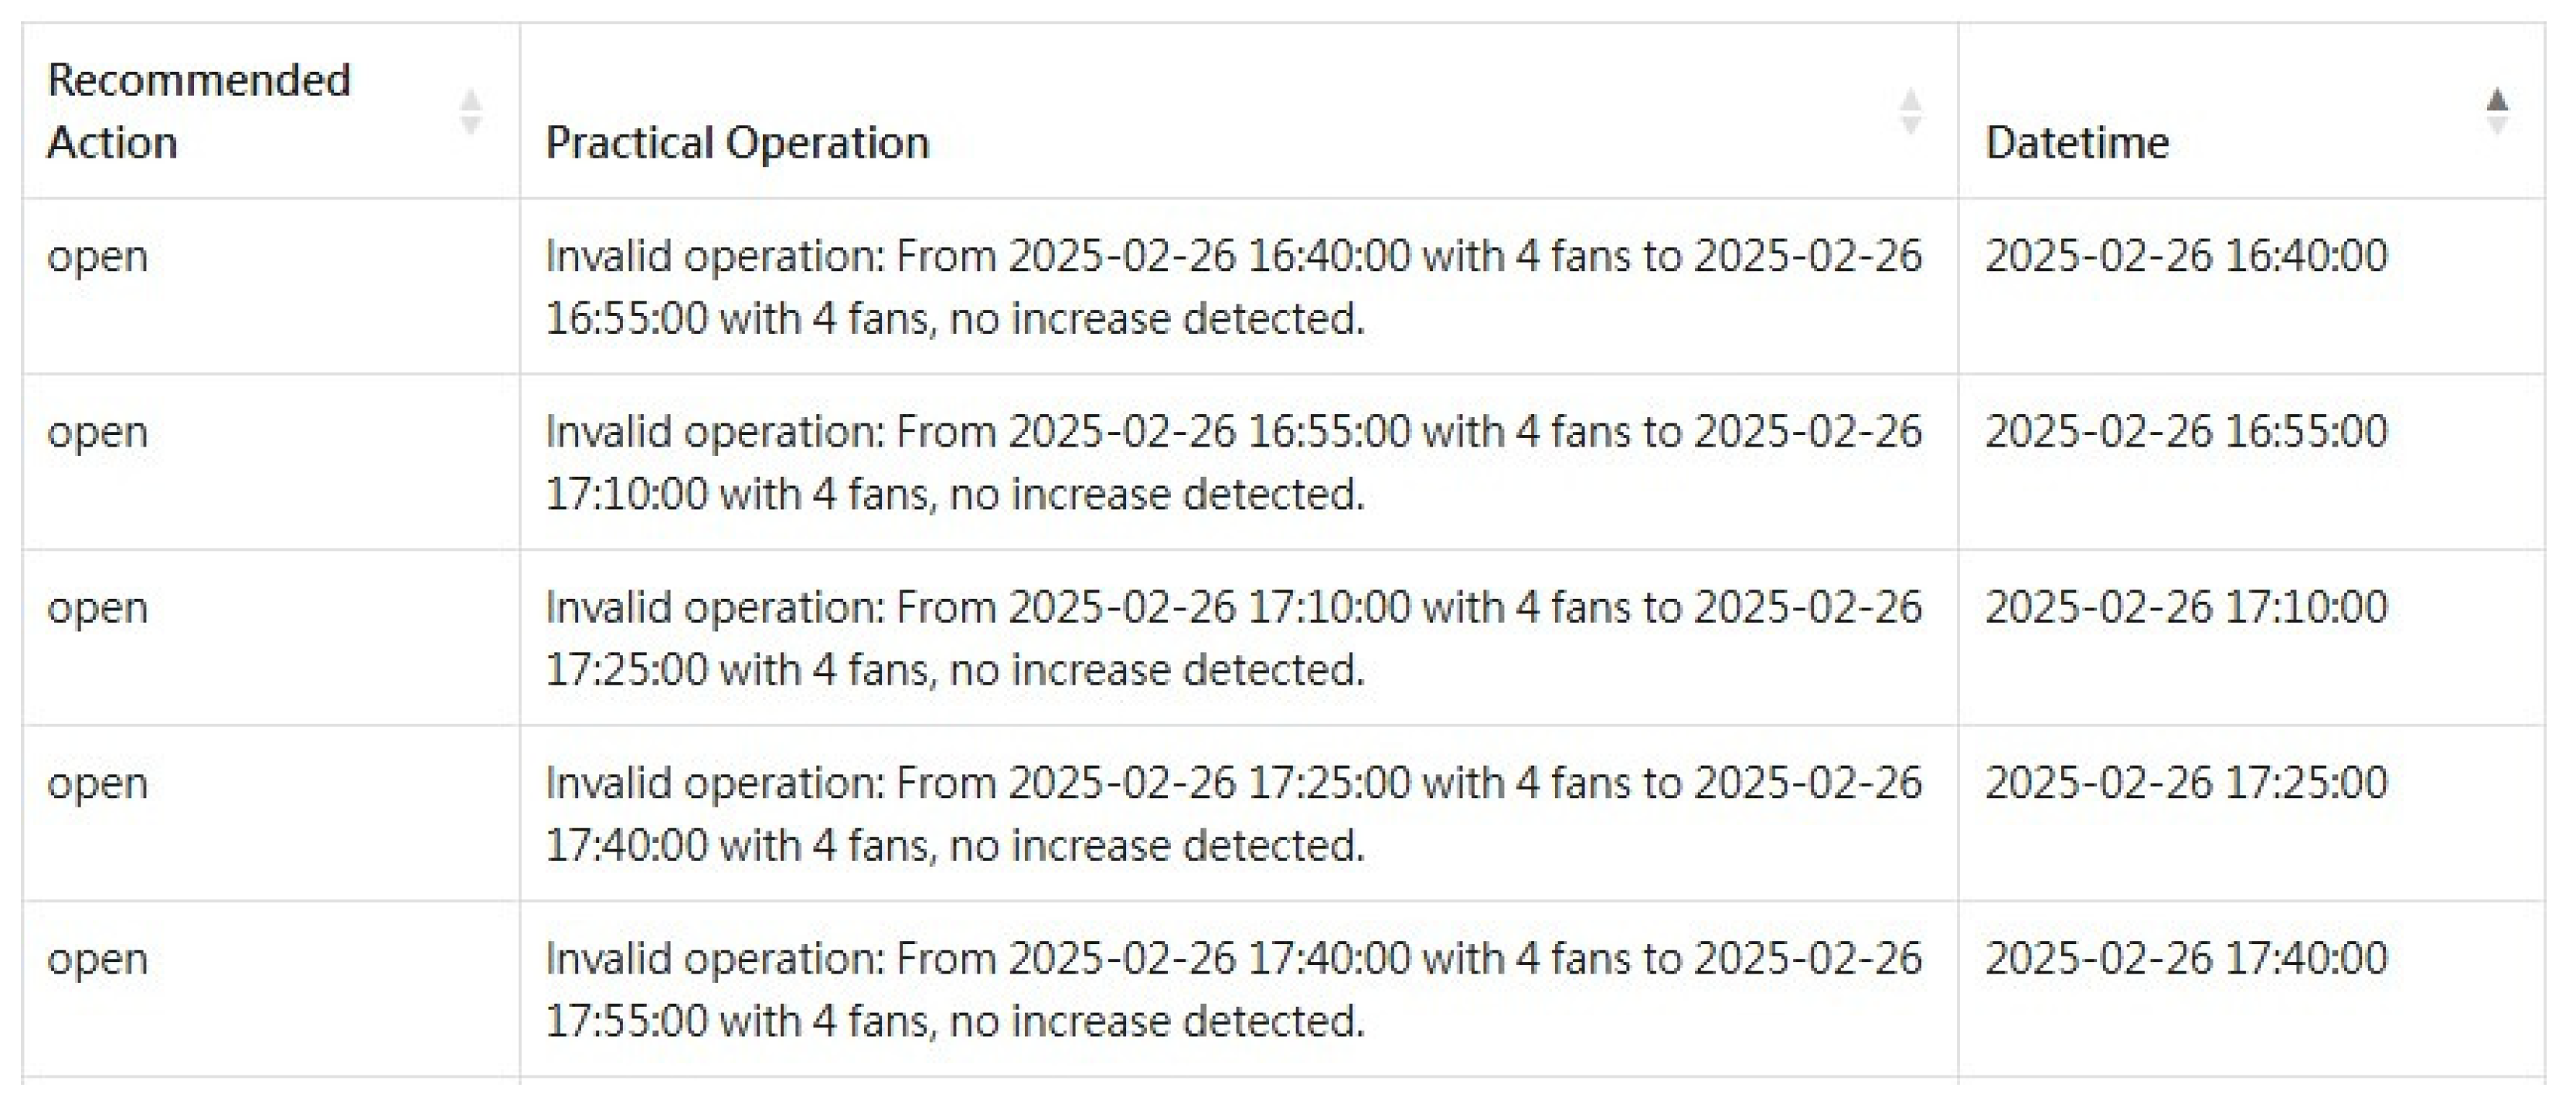
Figure 10 and
Figure 11 show the fan operation statistics over the past six months, presenting the distribution of recommended and actual operations. Effective operations are marked in purple, while ineffective operations are marked in blue.
The statistical results show that the proportion of ineffective operations is significantly higher, indicating that in most cases, operators did not follow the system’s recommendations. This may be due to multiple factors, such as other process requirements, maintenance scheduling, or operators’ independent judgments based on experience. The detailed record table presents each recommendation, its execution status, and timestamp, providing a valuable reference for further analysis.
This statistical feature confirms the system’s role as a decision support tool that provides recommendations rather than enforcing control, thereby preserving operators’ final decision-making authority. Furthermore, the collected data can serve as a reference for future system optimization by analyzing the characteristics of scenarios where recommendations were not adopted, thus improving the adaptability of the decision logic.
5. Conclusions
We developed a web-based decision support system for cooling tower operations, integrating LSTM temperature prediction and RL-based decision evaluation mechanisms. Through the web interface, the system provides real-time fan control recommendations. Case studies conducted at an actual manufacturing plant demonstrated that the AI-based decision mechanism effectively maintained the outlet water temperature within the target range of 30–31 °C, while the web interface successfully conveyed decision information to operators. As a decision support tool, the system provides intelligent recommendations while preserving operators’ final decision-making authority, thereby demonstrating flexibility in human–machine collaboration.
The feasibility of applying AI technologies was verified in industrial process control by effectively communicating AI-generated recommendations through a web interface. Future research could be extended in the following directions: (1) conducting an in-depth analysis of scenarios where recommendations were not adopted, incorporating more process-related factors to improve decision logic; (2) implementing an automatic fan control mode that executes recommended operations under specific conditions; and (3) expanding the system to enable integrated control of multiple cooling towers to enhance overall energy efficiency. Through continuous optimization, the system’s practical value and recommendation adoption rate can be further improved.
Author Contributions
Conceptualization, Y.-J.C.; methodology, W.-H.C.; software, H.-Y.L.; validation, H.-Y.L. and W.-H.C.; formal analysis, H.-Y.L.; investigation, H.-Y.L.; resources, W.-H.C.; data curation, H.-Y.L.; writing—original draft preparation, H.-Y.L.; writing—review and editing, Y.-J.C.; visualization, H.-Y.L.; supervision, Y.-J.C.; project administration, Y.-J.C.; funding acquisition, Y.-J.C. All authors have read and agreed to the published version of the manuscript.
Funding
This research received no external funding.
Institutional Review Board Statement
Not applicable.
Informed Consent Statement
Not applicable.
Data Availability Statement
The data presented in this study are not publicly available due to privacy and industrial restrictions.
Conflicts of Interest
The authors declare no conflict of interest.
References
- Qiu, R.; Wang, Y.; Wang, D.; Qiu, W.; Wu, Y.; Tao, Y. River water temperature forecasting using a deep learning method. J. Hydrol. 2021, 595, 126016. [Google Scholar] [CrossRef]
- Zhang, W.; Guo, W.; Liu, X.; Liu, Y.; Zhou, J.; Li, B.; Lu, Q.; Yang, S. LSTM-based analysis of industrial IoT equipment. IEEE Access 2018, 6, 23551–23560. [Google Scholar] [CrossRef]
- He, K.; Chen, Y.; Wang, Z. Predictive control optimization of chiller plants based on deep reinforcement learning. J. Clean. Prod. 2023, 421, 138504. [Google Scholar] [CrossRef]
- Nievas, N.; Pagès-Bernaus, A.; Bonada, F.; Echeverria, L.; Domingo, X. Reinforcement learning for autonomous process control in Industry 4.0: Advantages and challenges. Appl. Artif. Intell. 2024, 38, 2383101. [Google Scholar] [CrossRef]
- Marques, R.; Moura, J.; Santos, M.; Faria, R. Decision support system for the Industry 4.0 environment: Design and development of a business intelligence tool. In Proceedings of the International Conference on Industrial Engineering and Operations Management, Detroit, MI, USA, 10–14 August 2020. [Google Scholar]
- Poch, M.; Comas, J.; Rodríguez-Roda, I.; Sànchez-Marrè, M.; Cortés, U. Designing and building real environmental decision support systems. Environ. Model. Softw. 2004, 19, 857–873. [Google Scholar] [CrossRef]
- Michael, E. The decision support system in district cooling system (DCS) installation. Prog. Eng. Appl. Technol. 2022, 3, 215–227. [Google Scholar]
- Schulze, C.; Peters, J.; Spengler, T. Cooling tower management in manufacturing companies: A cyber-physical system approach. Comput. Ind. Eng. 2019, 127, 1291–1308. [Google Scholar] [CrossRef]
- Speier, C.; Morris, M.G. The influence of query interface design on decision-making performance. MIS Q. 2003, 27, 397–423. [Google Scholar] [CrossRef]
| Disclaimer/Publisher’s Note: The statements, opinions and data contained in all publications are solely those of the individual author(s) and contributor(s) and not of MDPI and/or the editor(s). MDPI and/or the editor(s) disclaim responsibility for any injury to people or property resulting from any ideas, methods, instructions or products referred to in the content. |