Proceeding Paper

Flow Characterization Around a Mars Rover Model at Extremely Low Reynolds Number †
by
Jaime Fernández-Antón
1,2,*,
Rafael Bardera-Mora
2,
Ángel Rodríguez-Sevillano
1,
Juan Carlos Matías-García
2 and
Estela Barroso-Barderas
2
1
Department of Aircraft and Space Vehicles at Escuela Técnica Superior de Ingeniería Aeronáutica y Espacio (ETSIAE), Universidad Politécnica de Madrid (UPM), 28040 Madrid, Spain
2
Experimental Aerodynamics, Instituto Nacional de Técnica Aeroespacial (INTA), Torrejón de Ardoz, 28850 Madrid, Spain
*
Author to whom correspondence should be addressed.
Presented at the 15th EASN International Conference, Madrid, Spain, 14–17 October 2025.
Eng. Proc. 2026, 133(1), 33; https://doi.org/10.3390/engproc2026133033
Published: 22 April 2026

Abstract

This work presents an experimental aerodynamic study of a Mars rover model, aimed at characterizing its flow behavior under Martian environmental conditions. Due to the extremely low Reynolds numbers associated with Mars’ thin atmosphere, the experiments were conducted using a scaled model of the rover manufactured via additive techniques. The study first focuses on understanding how the geometry of the rover influences the overall flow field, identifying key aerodynamic features such as separation zones, vortical structures, and flow reattachment regions driven by the complexity of the vehicle. A comprehensive investigation of the flow around the model was performed using both a hydrodynamic towing tank with dye injection for qualitative visualization, and particle image velocimetry (PIV) for quantitative flow field analysis in wind tunnel tests. After the general flow characterization, a more detailed local analysis was conducted using laser Doppler anemometry (LDA). This phase of the study targeted precise velocity measurements at specific locations corresponding to the MEDA (Mars Environmental Dynamics Analyzer) wind sensors onboard the rover. Quantitative results indicate that the central body induces a local flow acceleration of 20% to 40% relative to the free stream while severe turbulence was recorded in specific angular sectors, with velocity fluctuations reaching up to 120% for Sensor 1 and 90% for Sensor 2.

1. Introduction

The planet Mars remains a primary target for international space exploration, driven by compelling evidence of past fluvial activity and its astrobiological potential for harboring habitable environments [1]. In situ exploration of the Martian surface is dominated by robotic vehicles, or rovers, which have provided invaluable data over the past decades. A key scientific objective for modern missions, such as the Mars Science Laboratory carrying the Curiosity rover and the Mars 2020 mission carrying the Perseverance rover, is the detailed characterization of the planet’s atmospheric boundary layer and surface weather patterns. To accomplish this, both rovers are equipped with sophisticated meteorological suites: the Rover Environmental Monitoring Station on Curiosity [2], and the Mars Environmental Dynamics Analyzer (MEDA) on Perseverance [3]. The vehicle, acting as a complex, multi-component bluff body, generates a significant wake, flow separation, and regions of flow acceleration that distort the ambient wind field before it reaches the sensors. This aerodynamic challenge is defined by the unique conditions of the Martian environment, with a challenging atmosphere composed mainly of carbon dioxide (CO2) [4]. This environment results in a unique flow regime characterized by low Reynolds numbers (Re). This regime is distinct from most terrestrial aerodynamic applications and necessitates specific study. Previous numerical (CFD) and experimental investigations have confirmed the significance of this interference, identifying large velocity deficits and turbulent structures in the wake of the mast and main body [5,6]. Furthermore, the Multi-Mission Radioisotope Thermoelectric Generator (MMRTG) used to power the rover introduces a secondary, complex phenomenon: a constant thermal-convective plume that interacts with the local wind field, further complicating the flow physics [7]. Therefore, there is a critical need for detailed experimental data to baseline these effects.

2. Mars Rover Model

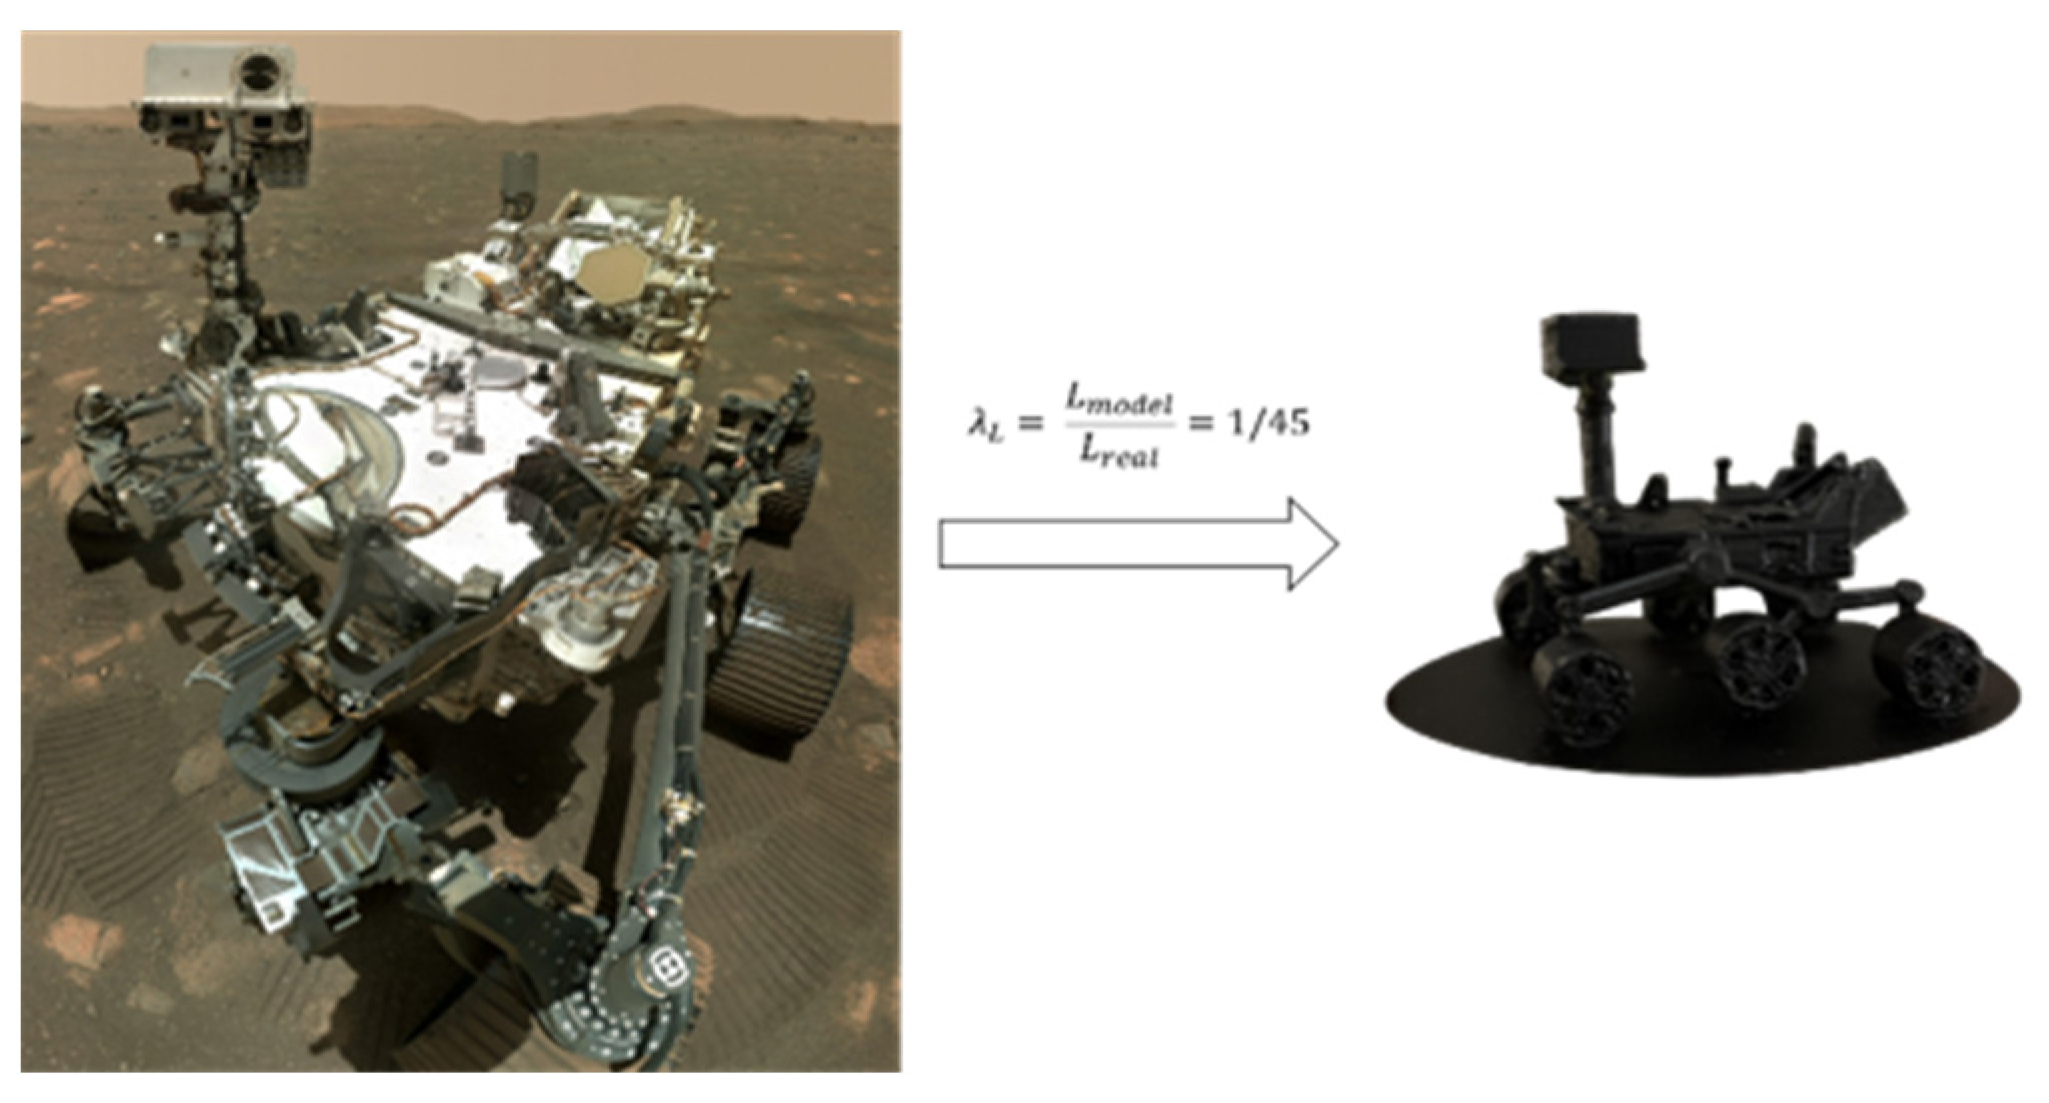
The vehicle of study is the Mars 2020 Perseverance rover. The primary objective of this robotic platform is to investigate the Martian surface, searching for signs of past life and collecting data on the planet’s geology and habitability [8]. The vehicle’s aerodynamic field is governed by the flow interactions and interference between these components. The primary geometric features expected to dominate the flow field include: a central body with a rectangular section, a six-wheeled mobility system, a vertical mast that is of primary interest, as it supports remote sensing instrumentation and the MEDA station [3] and the MMRTG, which provides electrical power by converting heat from radioactive decay [9]. The MEDA station’s wind sensors are located on this vertical mast [3]. Their measurements are therefore directly influenced by the aerodynamic wake shed by the mast itself, as well as by the larger-scale flow disturbances originating from the central body, wheels, and MMRTG. To investigate this complex geometry in a laboratory setting, a 1:45 scale physical model of the rover was built using additive manufacturing (Figure 1).

3. Mars Atmosphere and Similarity Analysis

3.1. Mars Atmosphere

To perform representative aerodynamic testing, it is essential to first understand the properties of the Martian atmosphere. The atmosphere has an average surface pressure of approximately 600 Pa, which is less than 1% of Earth’s mean sea-level pressure [10]. The composition is predominantly CO2 (~95%), with small amounts of nitrogen (N2) and argon (Ar) [10]. The atmospheric properties are highly variable, with surface temperatures fluctuating widely from 133 K to 293 K depending on location and season [11]. This environment results in a very low atmospheric density [12] and a low dynamic viscosity [13].

3.2. Similarity Analysis

The primary challenge of this study was to ensure that the flow field is representative of the full-scale rover operating on Mars. This requires achieving dynamic similarity, which is met when the ratio of key forces is the same in both scenarios. This ratio is defined by the non-dimensional Reynolds number (Re), which quantifies the relationship between inertial and viscous forces [14]. The Reynolds number for the full-scale rover on Mars was calculated based on its characteristic length, the Martian wind speed, and the density and dynamic viscosity of the Martian atmosphere, which is characterized by an extremely low Reynolds number [15]. As calculated in previous works, the target Reynolds number for this vehicle is approximately:
R e =   ρ · V · L μ = 1.2   k g m 3 · 3.0   m s · 4.4 × 10 2   m 1.85 × 10 5   P a · s 8600
where V is the velocity of the flow, ρ and μ are the density and the kinematic viscosity of the atmosphere, respectively, and L is the model characteristic length. Table 1 presents the comparison between the values governing the Reynolds number on Earth and Mars.

4. Experimental Setup

4.1. Wind Tunnel

The experiments were performed in a modified low-speed, open-circuit wind tunnel. The original facility, a TSI Model 8390 [16], was modified by replacing the diffuser and fan to achieve the low velocity of 3.0 m/s required to match the target Reynolds number. The facility has a closed test section with a 10 cm × 10 cm cross-section. The walls are constructed from methyl methacrylate to provide full optical access for the non-intrusive diagnostic techniques. A Setra differential pressure transducer was used to control the test section velocity [17]. Based on the 1:45 scale model, the maximum lateral blockage area was 8.6 cm2, satisfying the standard non-blockage criterion of remaining below 10% to minimize wall-interference effects [18].

4.2. Flow Visualization Techniques

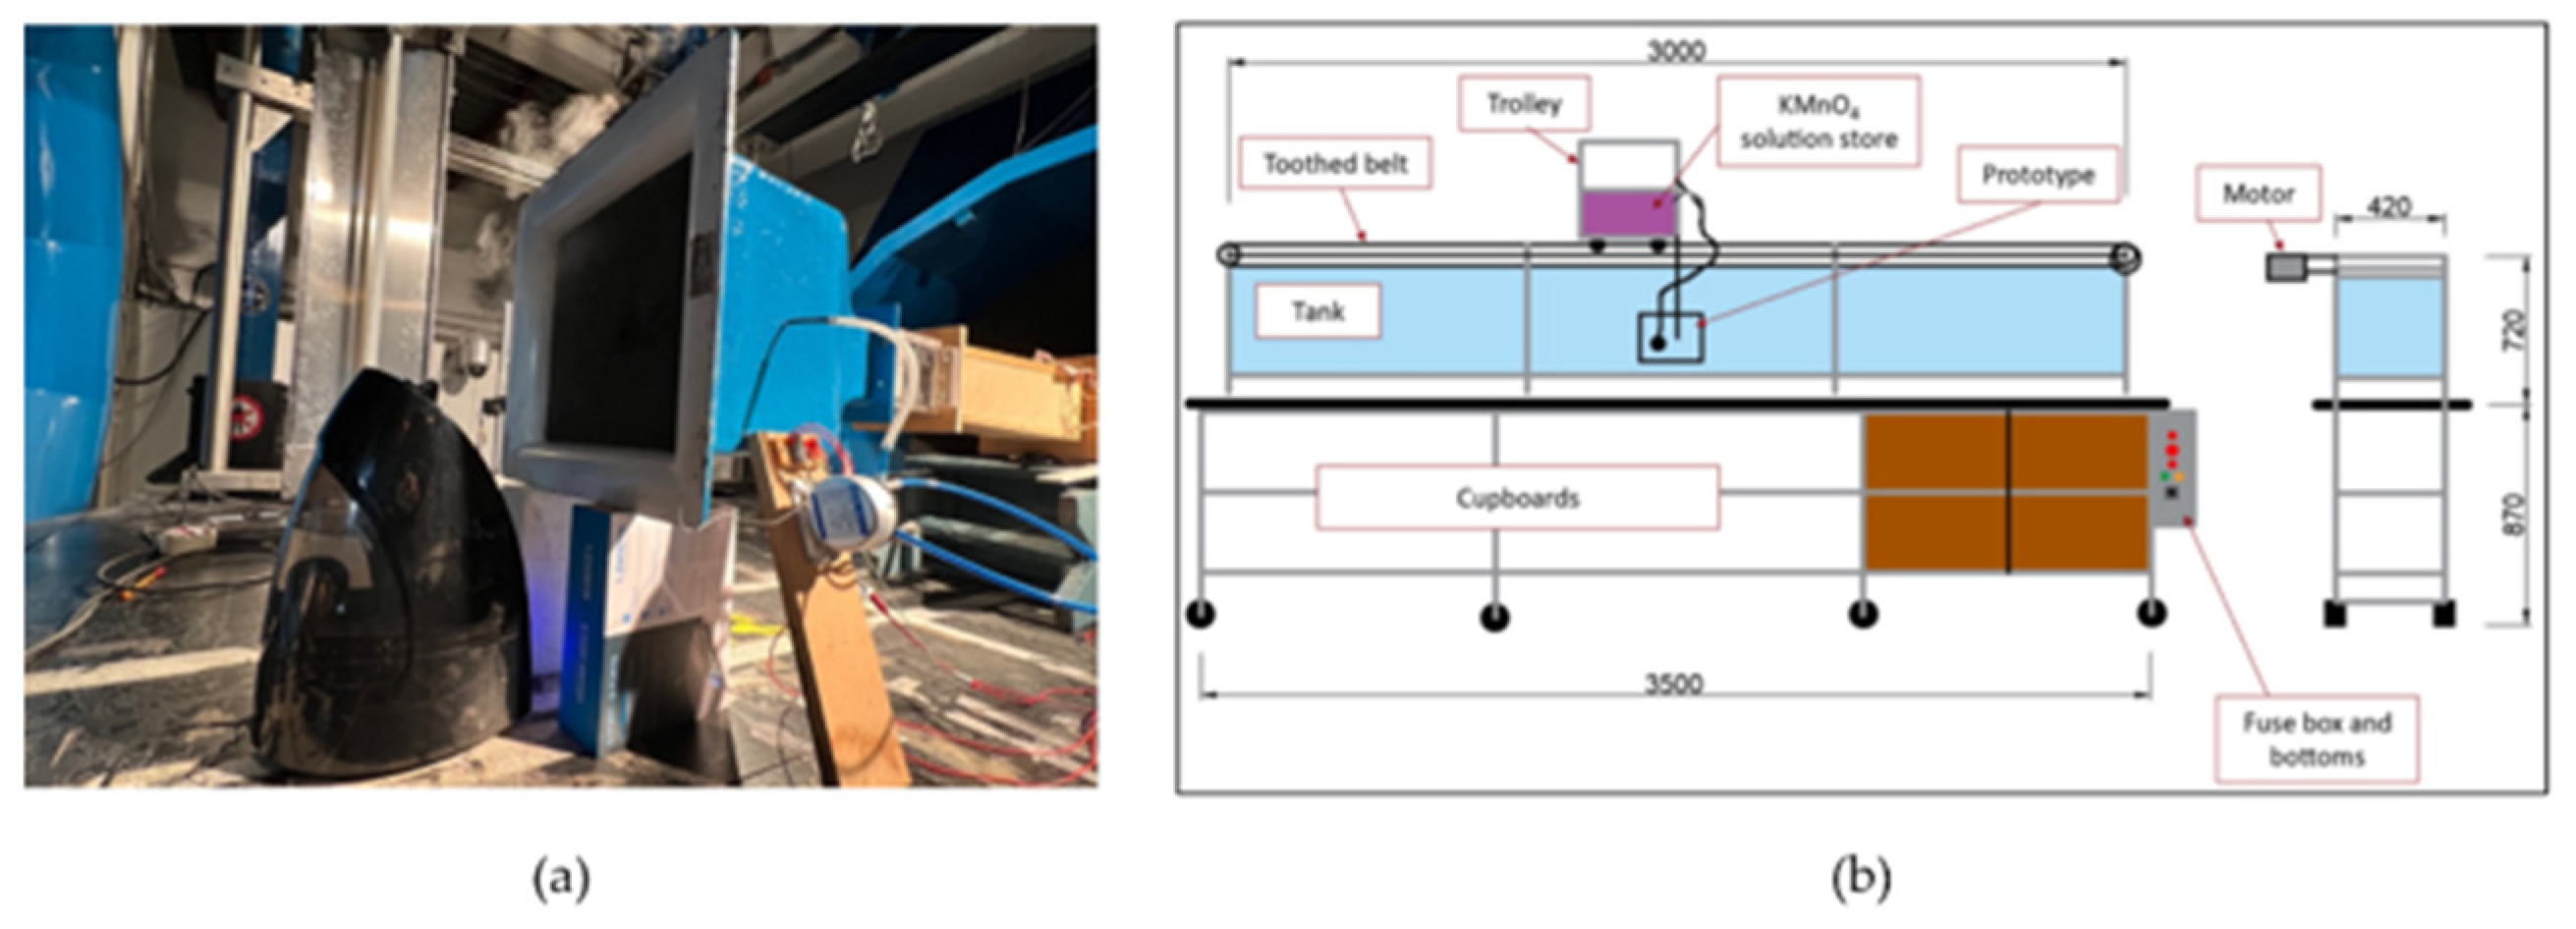
Two distinct visualization methods were employed as a preliminary analysis. First, in the low-speed wind tunnel, visualizations were performed using a water-based aerosol and a laser sheet to illuminate the flow. Second, tests were conducted at the Hydrodynamic Towing Tank (HTT) at the School of Aeronautics and Space Engineering (ETSIAE-UPM). This technique is a simple, low-cost method that provides excellent qualitative consistency for fluid mechanics analysis, particularly in low-speed, laminar-like flow regimes [19]. Figure 2 shows the two visualization techniques that have been described.

4.3. Anemometry Techniques

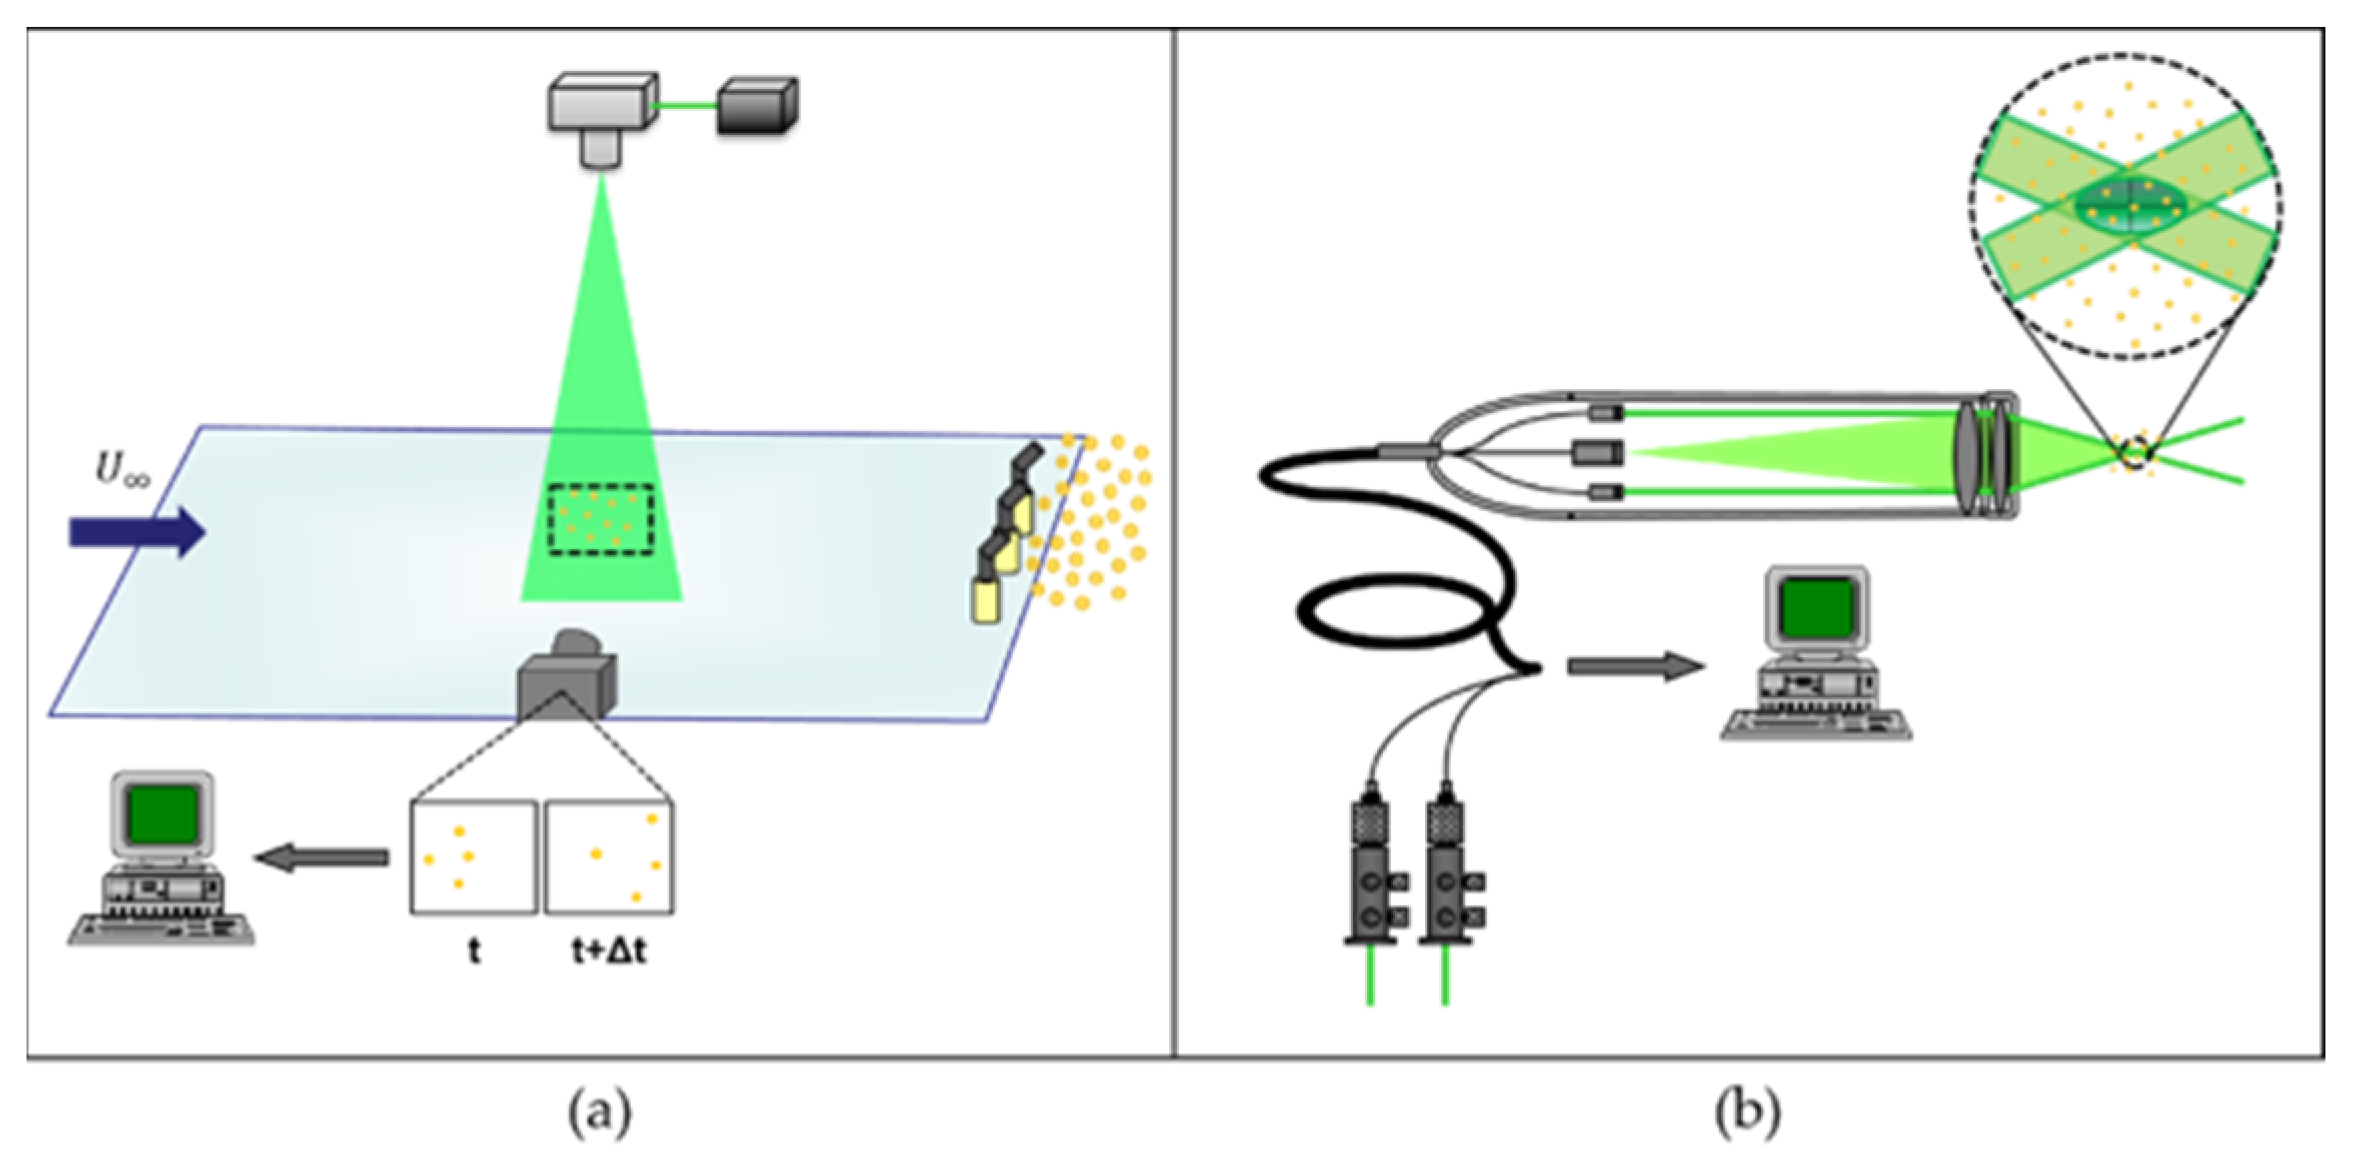
Quantitative flow field measurements employed two non-intrusive optical techniques. Global aerodynamic analysis utilized a 2D PIV system (TSI Inc., Shoreview, MN, USA) [20] with a dual-pulsed laser and a synchronized camera. The flow was seeded with olive oil particles, and mean velocity fields were computed by averaging 100 instantaneous vector fields via cross-correlation. Complementing this, high-resolution point measurements were conducted using a LDA system (Dantec Dynamics). This setup employed a Bragg cell to resolve flow direction and near-zero velocities [21]. The probe was mounted on a three-axis traversing system with 0.01 mm accuracy (Figure 3).

4.4. Tests Configuration

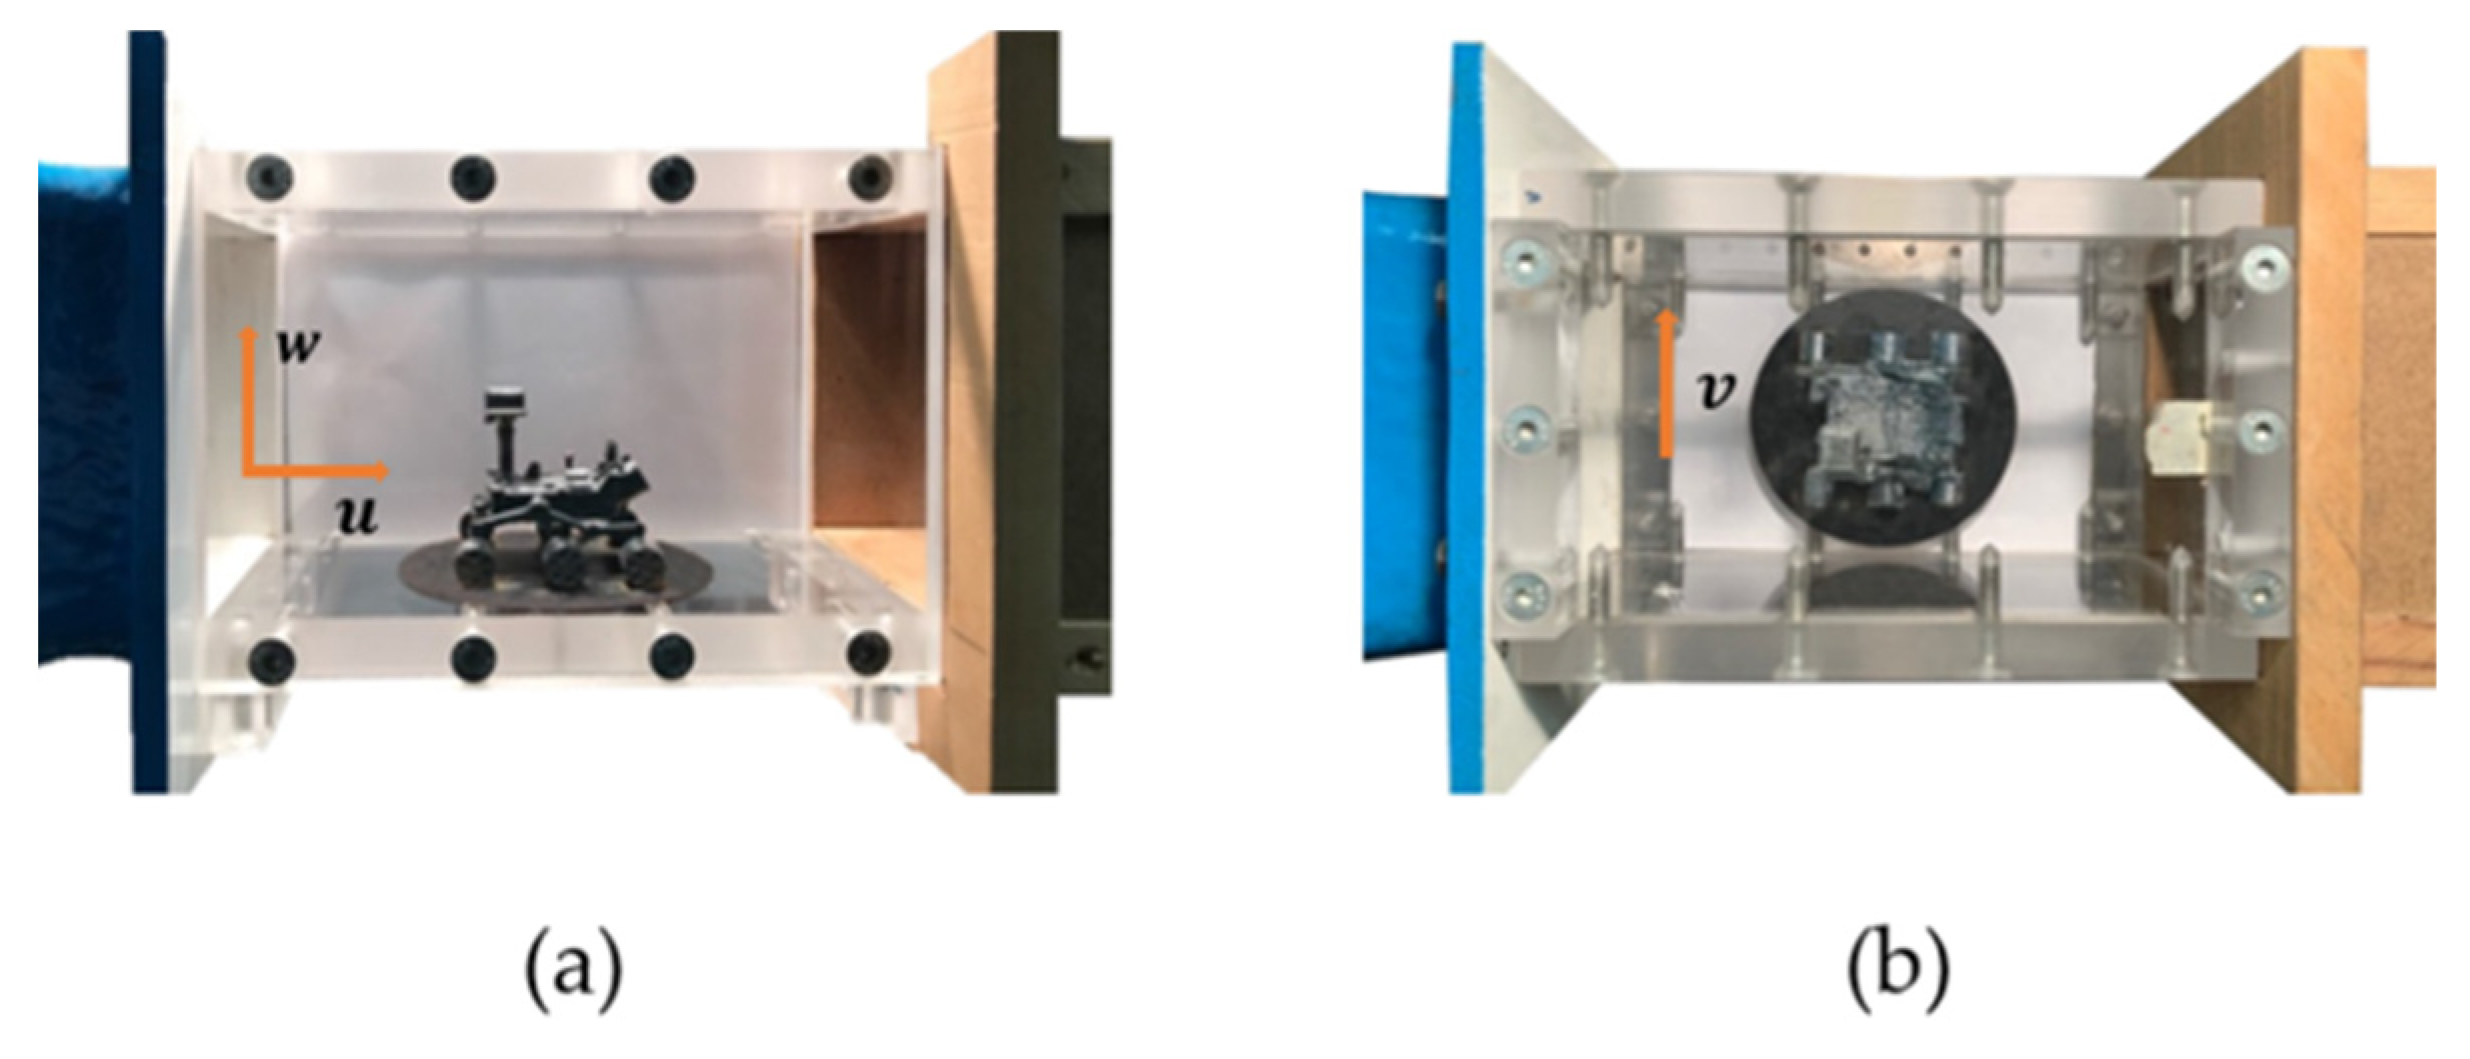
The experimental campaign was conducted using two distinct model configurations within the wind tunnel. For the first configuration, the Mars rover model was positioned on the bottom wall of the test section, replicating its natural orientation on the Martian surface and allowing us to measure the longitudinal (u) and vertical (w) velocity components of the flow field. In contrast, in the second configuration, the model was mounted on the rear vertical side wall of the test section, which allowed for measurement of the transverse (v) velocity component. Figure 4 shows the two different configurations described.

5. Results

5.1. Qualitative Flow Characterization

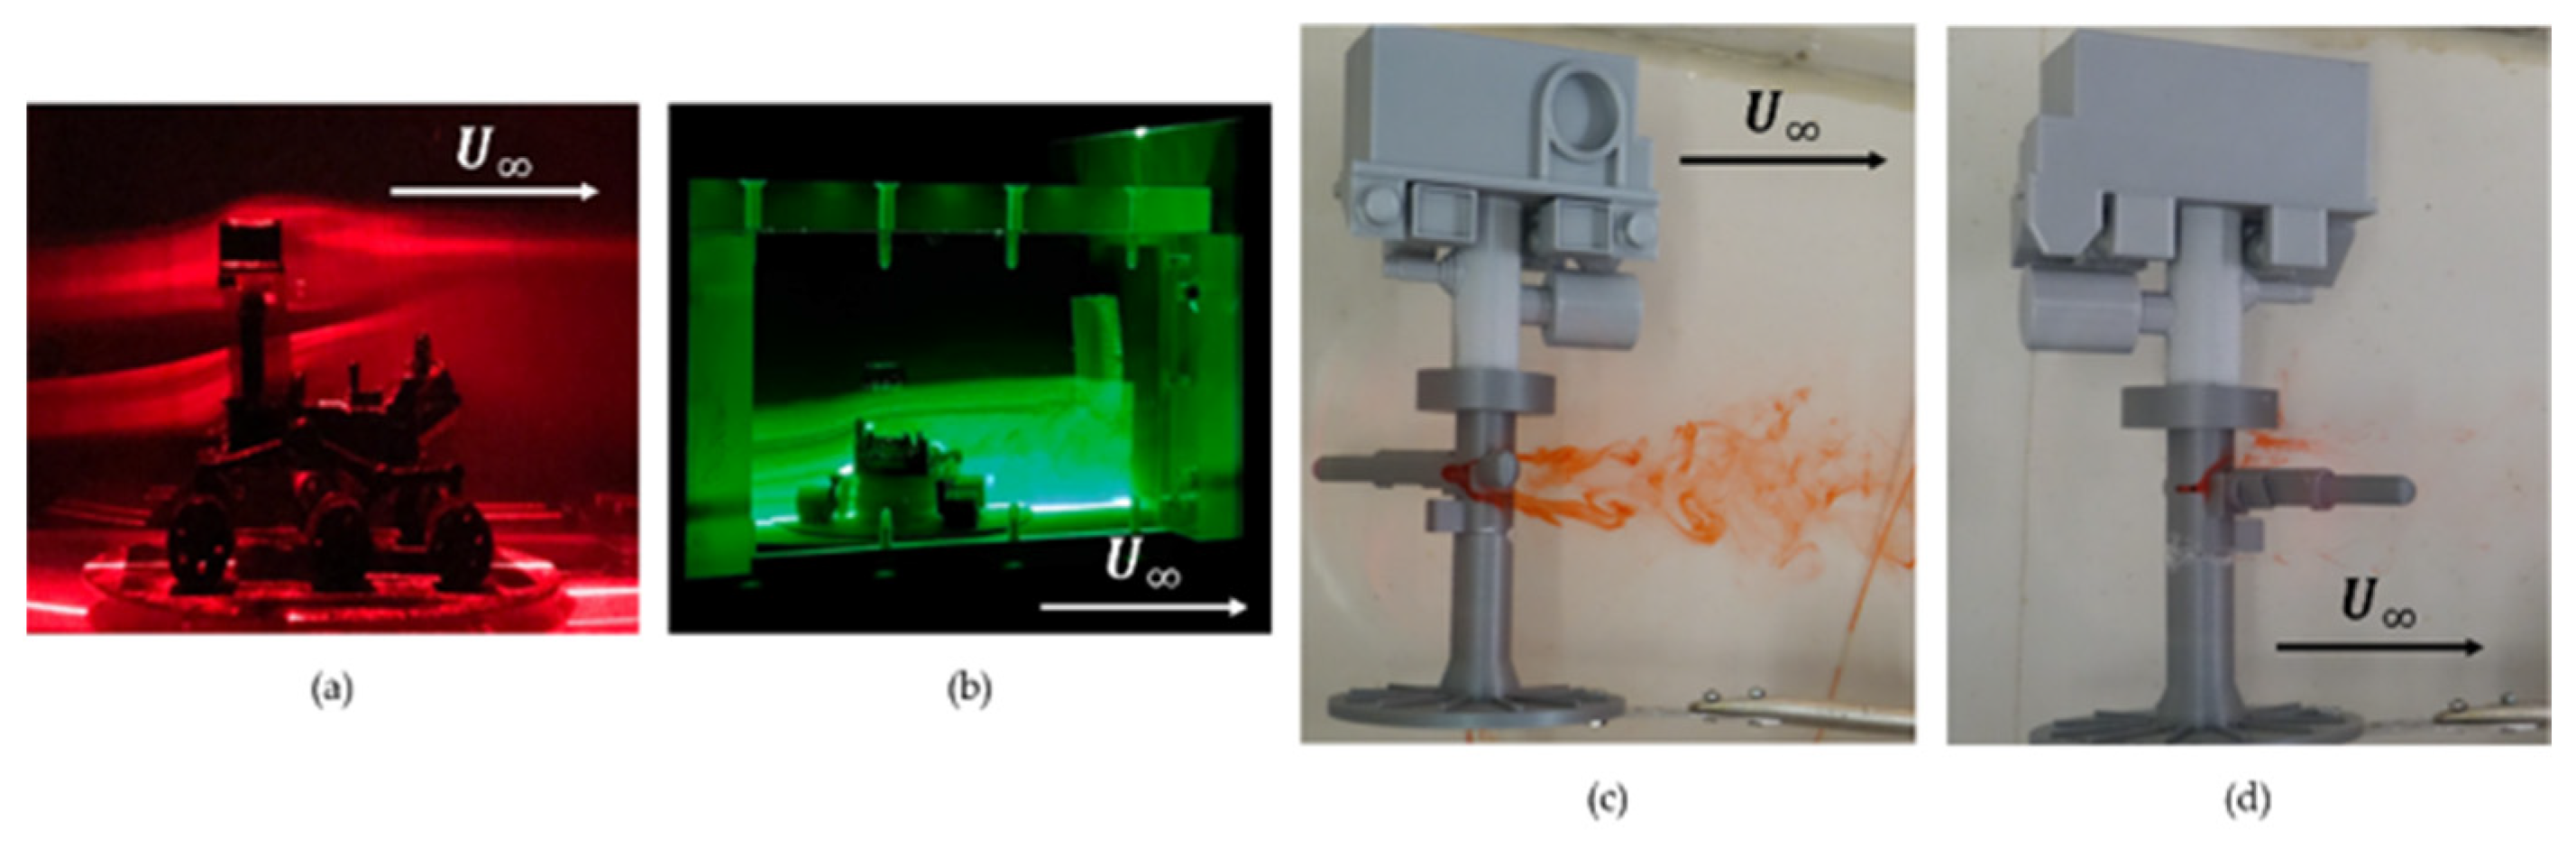
Qualitative flow visualization was conducted to identify the primary aerodynamic structures before performing the quantitative measurements. Figure 5 presents a compilation of these visualizations obtained from both the low-speed wind tunnel and the HTT.
Wind tunnel visualizations using water-based aerosol demonstrated significant interaction between the model geometry and the flow. Figure 5a shows that while the upstream flow remained laminar, a distinct wake formed downstream of the mast. In contrast, rear-facing flow (Figure 5b) generated a massive, highly turbulent wake driven primarily by the MMRTG. Complementary HTT tests (Figure 5c,d) utilized dye injection to reveal local flow behavior, highlighting flow deflection and small-scale vortex shedding around the sensor booms. These visualizations confirm the complex, three-dimensional nature of the aerodynamic interference.

5.2. Global Flow Field Analysis

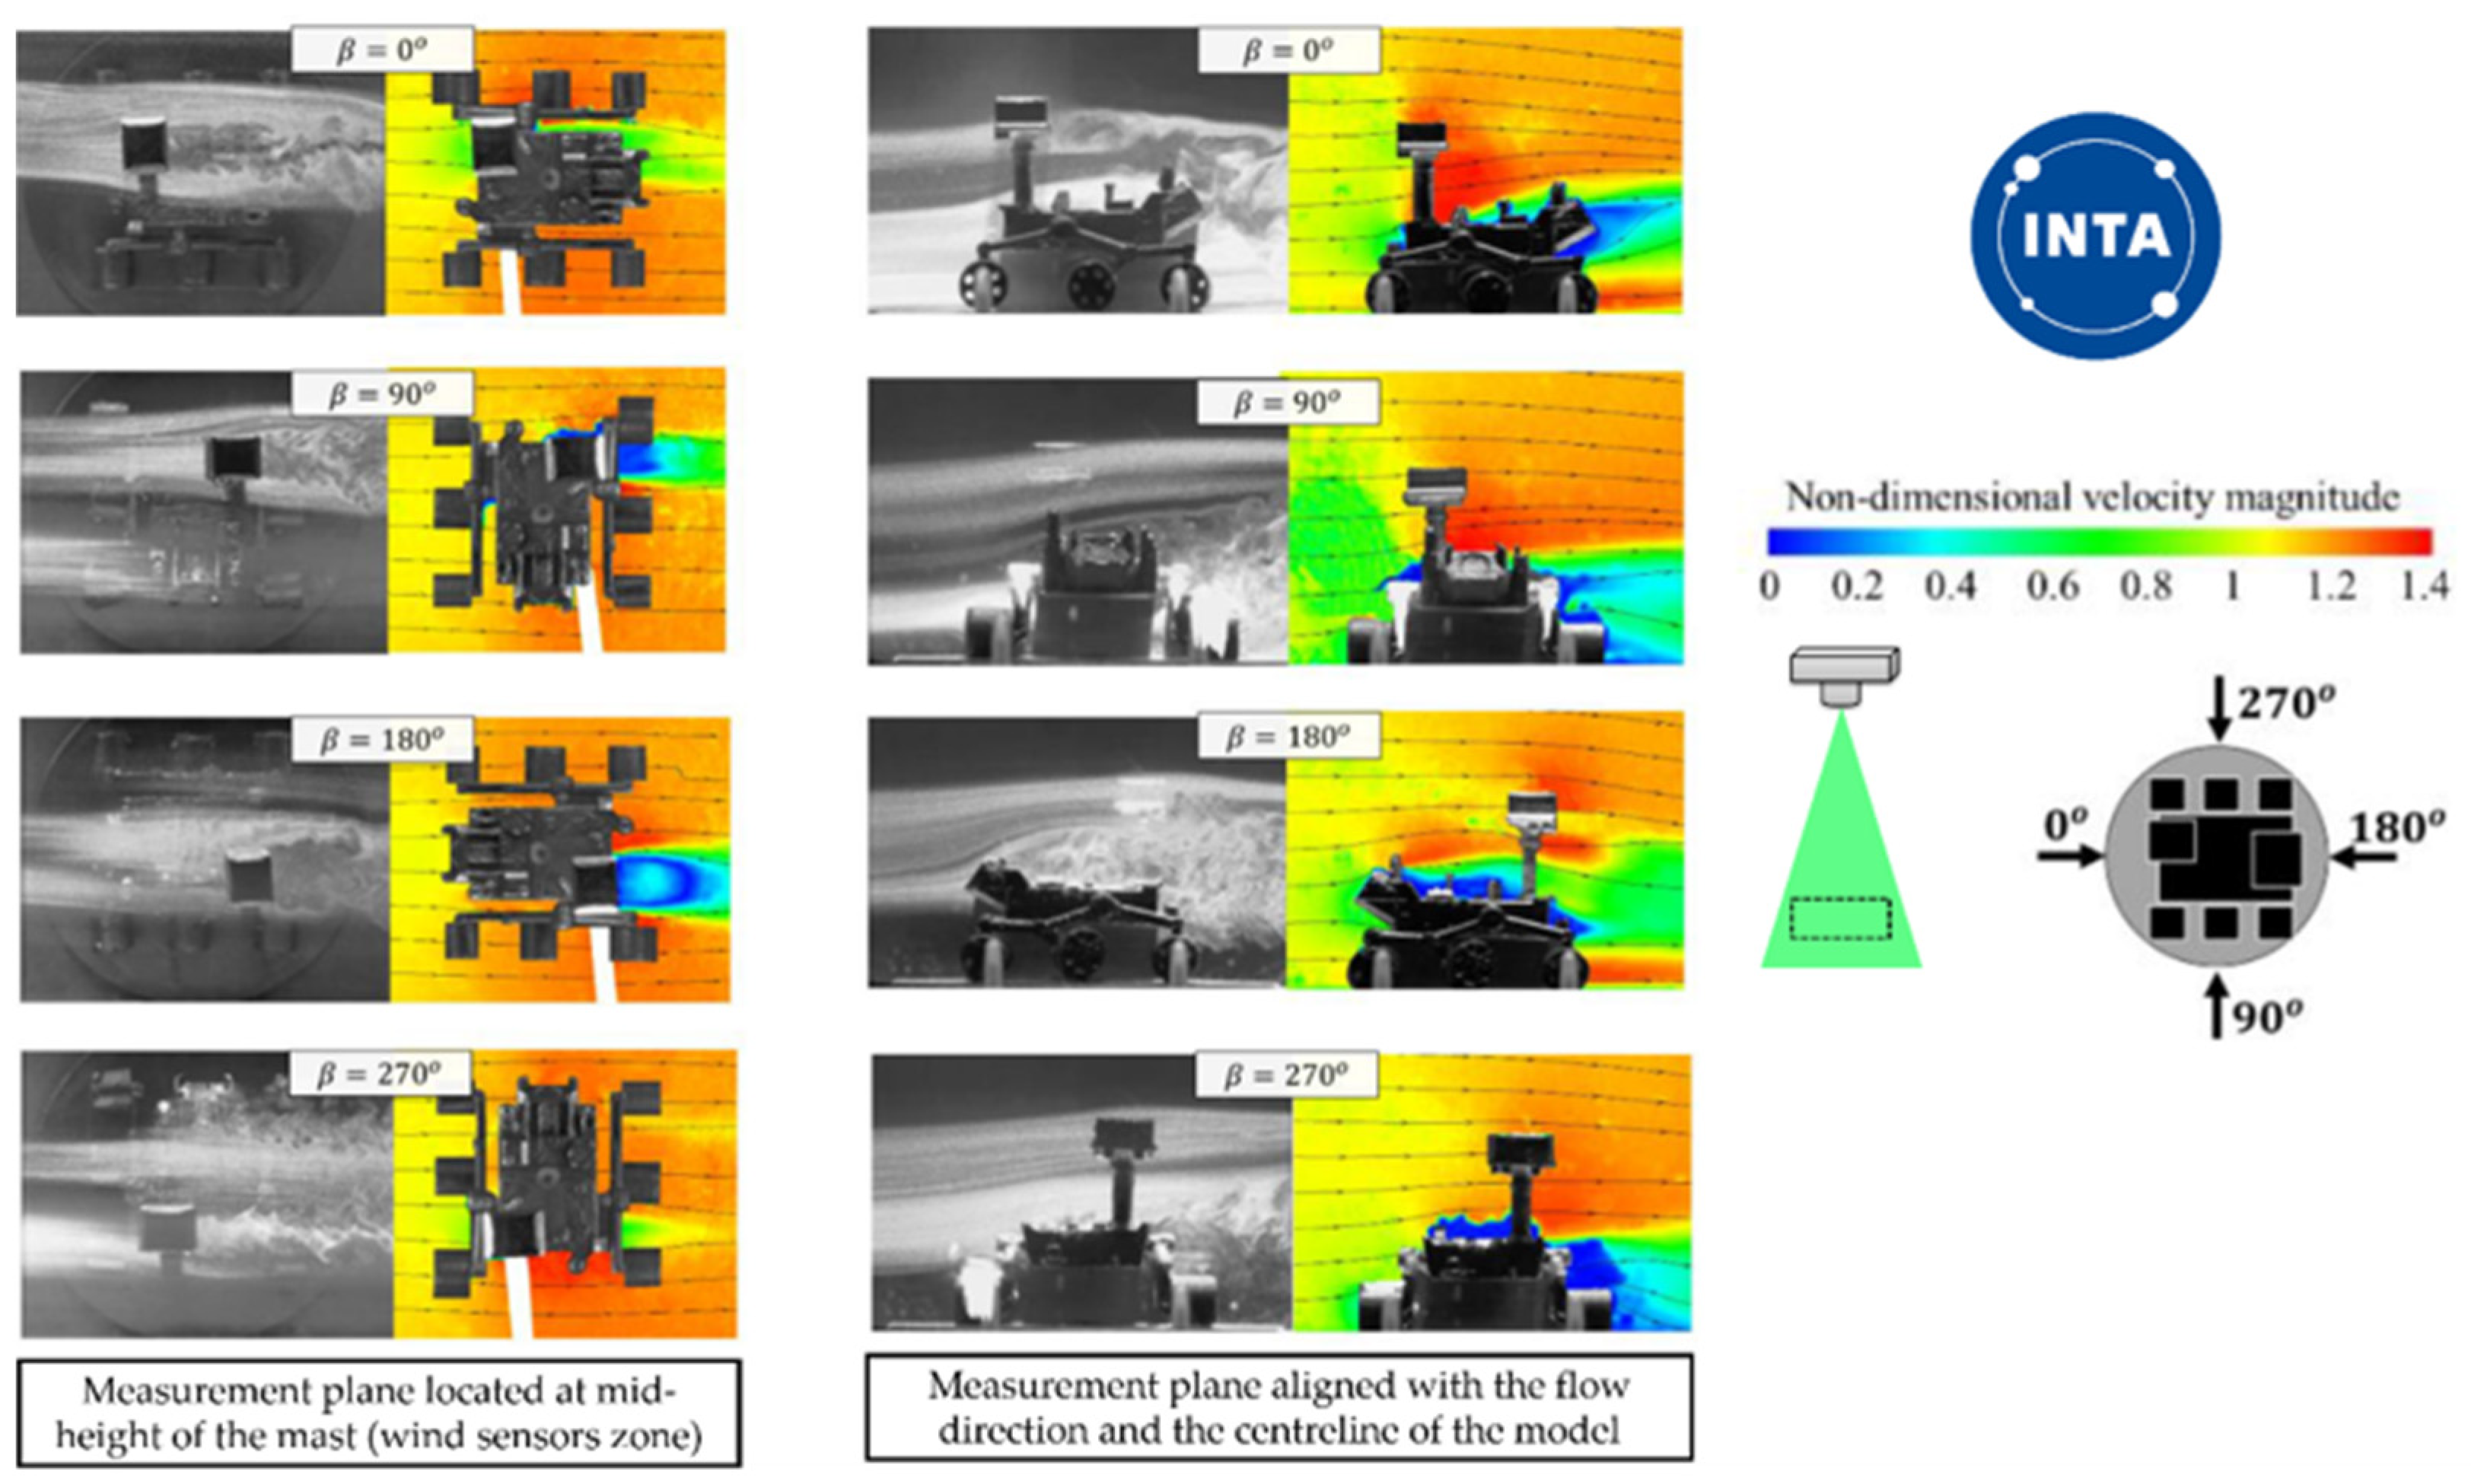
The PIV campaign provided two-dimensional velocity maps that characterize the global flow topology. Figure 6 presents a comparative view of the non-dimensional velocity magnitude for both configurations across four different wind incidence angles.
Horizontal plane analysis at mast height identified a specific wake downstream of the mast at β = 0 ° , while β = 90 ° and β = 270 ° exhibited large recirculation bubbles and local accelerations. The most critical condition occurred at β = 180 ° , where the combined blockage of the MMRTG and mast generated a massive turbulent wake, dropping the local velocity to below 40%. Vertical plane measurements validated these wake structures and revealed significant flow acceleration (20–40%) over the central body.

5.3. Local Velocity Measurement

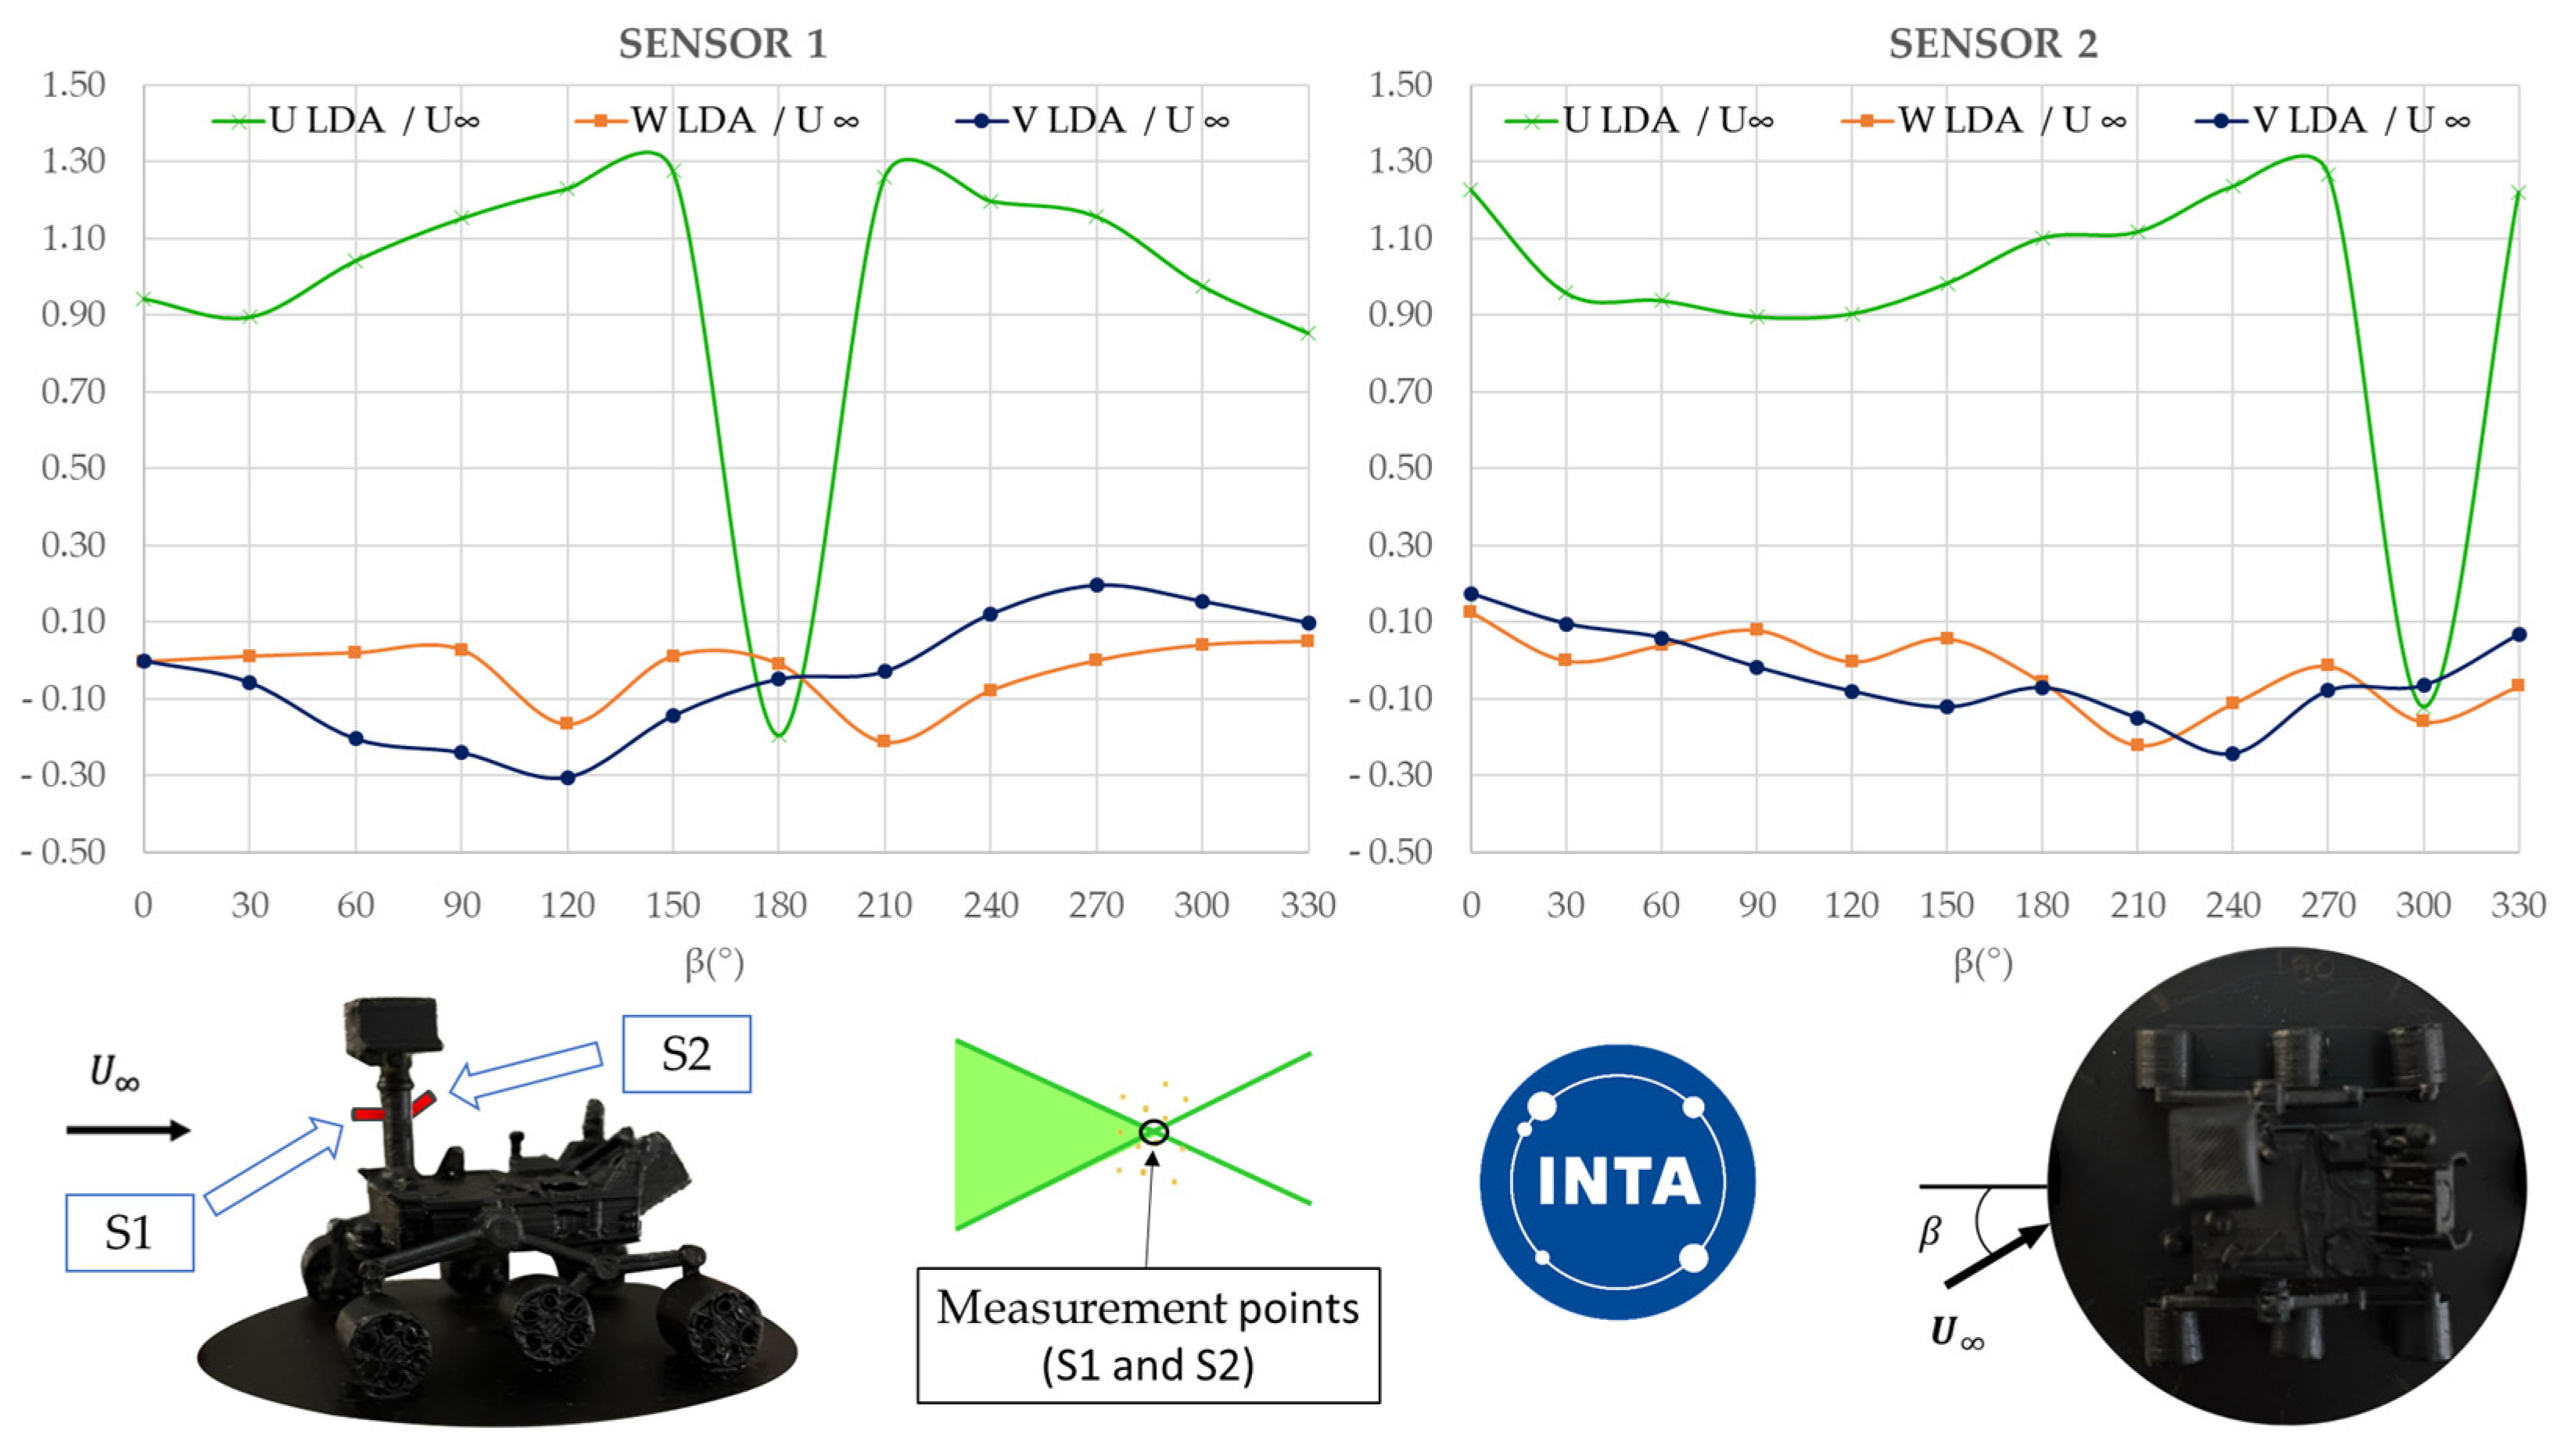
The LDA system was used to perform high-resolution point measurements at the precise locations of the two wind sensors located in the mast: Wind Sensor 1 (S1) and Wind Sensor 2 (S2). This allowed for a detailed quantification of the velocity deficit experienced by the anemometers throughout the full range of incident wind angles ( β ). The results extracted from these measurements for both Sensor 1 and Sensor 2 are presented in Figure 7, which illustrates the non-dimensional velocity components read by the LDA system.
The results reveal that S1 operates nominally between 0 ° β 120 ° , though influenced by local acceleration. However, performance degrades critically around β = 180 ° , where the sensor is immersed in the turbulent wake of the mast and MMRTG, resulting in high fluctuations of the longitudinal velocities. Similarly, S2 provides consistent readings for the majority of the angular range, often capturing accelerated flow ( U U > 1 ), but experiences a sharp velocity deficit centered at β = 300 ° as it is located in the wake of the mast and other structural parts of the model. Furthermore, for both sensors, the data indicate that the transverse ( V ) and vertical ( W ) velocity components are generally of a lower order of magnitude compared to the longitudinal component ( U ), which dominates the flow field outside the separation regions.

6. Conclusions

This study characterized the aerodynamic environment of the Mars 2020 rover through experimental testing of a 1:45 scaled model in a low-Reynolds number wind tunnel ( R e 8600 ). The comprehensive campaign, combining qualitative visualizations with quantitative PIV and LDA measurements, confirms that the rover’s complex geometry significantly distorts the ambient wind field, creating a challenging environment for accurate meteorological monitoring. The experimental results demonstrate that the rover acts as a bluff body, generating distinct wake structures that vary with the wind incidence angle. The central body of the vehicle induces a blockage effect that accelerates the local flow by 20% to 40% relative to the free stream. This systematic acceleration must be accounted for in calibration models to prevent the overestimation of wind speeds. High-resolution LDA measurements at the specific locations of the MEDA wind sensors revealed that neither sensor could provide reliable data for the full 360 ° azimuth. Sensor 1 (S1) experienced critical interference when the wind originated from the rear sector ( 150 ° β 210 ° ), where it was immersed in the turbulent wake of the mast and MMRTG, recording velocity fluctuations of up to 120%. Similarly, Sensor 2 (S2) was compromised in the sector 270 ° β 330 ° , with fluctuations reaching 90% due to the wake of the mast and structural booms. Consequently, this study concludes that a single-sensor approach is insufficient for Martian surface operations. An active redundancy strategy is essential to reconstruct the true wind vector: the data acquisition algorithm must dynamically switch between Sensor 1 and Sensor 2 based on the detected wind sector to ensure that measurements are always taken from the sensor exposed to the cleanest flow.

Author Contributions

Conceptualization, R.B.-M. and Á.R.-S.; methodology, R.B.-M., Á.R.-S., J.C.M.-G., E.B.-B. and J.F.-A.; software, R.B.-M., Á.R.-S., J.C.M.-G., E.B.-B. and J.F.-A.; validation, R.B.-M., Á.R.-S., J.C.M.-G., E.B.-B. and J.F.-A.; formal analysis, R.B.-M., Á.R.-S., J.C.M.-G., E.B.-B. and J.F.-A.; investigation, R.B.-M., Á.R.-S., J.C.M.-G., E.B.-B. and J.F.-A.; resources, R.B.-M. and Á.R.-S.; data curation, R.B.-M., Á.R.-S., J.C.M.-G., E.B.-B. and J.F.-A.; writing—original draft preparation, R.B.-M., Á.R.-S., J.C.M.-G., E.B.-B. and J.F.-A.; writing—review and editing, R.B.-M., Á.R.-S., J.C.M.-G., E.B.-B. and J.F.-A.; visualization, R.B.-M., Á.R.-S., J.C.M.-G., E.B.-B. and J.F.-A.; supervision, R.B.-M. and Á.R.-S. All authors have read and agreed to the published version of the manuscript.

Funding

This research received no external funding.

Institutional Review Board Statement

Not applicable.

Informed Consent Statement

Not applicable.

Data Availability Statement

Not applicable.

Conflicts of Interest

The authors declare no conflicts of interest.

Abbreviations

The following abbreviations are used in this manuscript:
CFDComputational Fluid Dynamics
CO2Carbon Dioxide
ETSIAEEscuela Técnica Superior de Ingeniería Aeronáutica y del Espacio
HTTHydrodynamic Towing Tank
INTAInstituto Nacional de Técnica Aeroespacial
LDALaser Doppler Anemometry
MEDAMars Environmental Dynamics Analyzer
MMRTGMulti-Mission Radioisotope Thermoelectric Generator
N2Nitrogen
PIVParticle Image Velocimetry
UPMUniversidad Politécnica de Madrid

References

  1. Grotzinger, J.P.; Sumner, D.Y.; Kah, L.C.; Stack, K.; Gupta, S.; Edgar, L.; Rubin, D.; Lewis, K.; Schieber, J.; Mangold, N.; et al. A habitable environment at Gale Crater, Mars, from Curiosity rover analyses. Science 2014, 343, 1242777. [Google Scholar] [CrossRef] [Scilit] [PubMed]
  2. Gómez-Elvira, J.; Armiens, C.; Castañer, L.; Domínguez, M.; Genzer, M.; Gómez, F.; Haberle, R.; Harri, A.-M.; Jiménez, V.; Kahanpää, H.; et al. REMS: The Environmental Sensor Suite for the Mars Science Laboratory Rover. Space Sci. Rev. 2012, 170, 583–640. [Google Scholar] [CrossRef] [Scilit]
  3. Rodriguez-Manfredi, J.A.; Juárez, M.d.l.T.; Alonso, A.; Apéstigue, V.; Arruego, I.; Atienza, T.; Banfield, D.; Boland, J.; Carrera, M.A.; Castañer, L.; et al. The Mars Environmental Dynamics Analyzer, MEDA. A Suite of Environmental Sensors for the Mars 2020 Mission. Space Sci. Rev. 2021, 217, 48. [Google Scholar] [CrossRef] [Scilit] [PubMed]
  4. Haberle, R.M.; Clancy, R.T.; Forget, F.; Smith, M.D.; Zurek, R.W. (Eds.) The Martian Atmosphere: Modeling and Observations. In The Atmosphere and Climate of Mars; Cambridge University Press: Cambridge, UK, 2017; pp. 1–20. [Google Scholar]
  5. Bardera-Mora, R.; Sor, S.; Garcia-Magariño, A.; Gomez-Elvira, J.; Marin, M.; Torres, J.; Carretero, S. Characterization of the flow around the Mars 2020 rover. In Proceedings of the 35th AIAA Applied Aerodynamics Conference, Denver, CO, USA, 5–9 June 2017. [Google Scholar]
  6. Garcia-Magariño, A.; Sor, S.; Bardera, R.; Muñoz-Campillejo, J. Mars 2020 Wind Velocity Measurement Interferences at High Reynolds Numbers. J. Spacecr. Rockets 2020, 57, 354–363. [Google Scholar] [CrossRef] [Scilit]
  7. Rodríguez-Sevillano, Á.A.; Casati-Calzada, M.J.; Bardera-Mora, R.; Matías-García, J.C.; Barroso-Barderas, E.; Fernández-Rivero, E. Image Analysis of the Influence of the Multi-Mission Radioisotope Thermoelectric Generator (MMRTG) on the Mars Environmental Dynamics Analyzer at Extremely Low Reynolds Number. Appl. Sci. 2025, 15, 220. [Google Scholar] [CrossRef] [Scilit]
  8. Sun, V.Z.; Hand, K.P.; Stack, K.M.; Farley, K.A.; Simon, J.I.; Newman, C.; Wogsland, B. Overview and results from the Mars 2020 Perseverance rover’s first science campaign on the Jezero crater floor. J. Geophys. Res. Planets 2023, 128, e2022JE007613. [Google Scholar] [CrossRef] [Scilit]
  9. Ritz, F.; Peterson, C. Multi-mission radioisotope thermoelectric generator (MMRTG) program overview. In Proceedings of the IEEE Aerospace Conference Proceedings (IEEE Cat. No. 04TH8720), Big Sky, MT, USA, 6–13 March 2004; Volume 5. [Google Scholar] [CrossRef] [Scilit]
  10. Barth, C.A. The atmosphere of Mars. Annu. Rev. Earth Planet. Sci. 1974, 2, 333–367. [Google Scholar] [CrossRef] [Scilit]
  11. Gierasch, P.J.; Toon, O.B. Atmospheric pressure variation and the climate of Mars. J. Atmos. Sci. 1973, 30, 1502–1508. [Google Scholar] [CrossRef] [Scilit]
  12. Jakosky, B.M.; Lin, R.P.; Grebowsky, J.M.; Luhmann, J.G.; Mitchell, D.F.; Beutelschies, G.; Priser, T.; Acuna, M.; Andersson, L.; Baird, D.; et al. The Mars atmosphere and volatile evolution (MAVEN) mission. Space Sci. Rev. 2015, 195, 3–48. [Google Scholar] [CrossRef] [Scilit]
  13. Chamberlain, T.E. Atmospheric measurements on Mars: The Viking Meteorology Experiment. Bull. Am. Meteorol. Soc. 1976, 57, 1094–1104. [Google Scholar] [CrossRef] [Scilit]
  14. White, F.M. Fluid Mechanics, 7th ed.; McGraw-Hill: New York, NY, USA, 2011; pp. 280–285. [Google Scholar]
  15. Liu, J.; Li, D.; Zuo, Z.; Liu, C.; Wang, H. Aerodynamic performance of a characteristic airfoil at low-Reynolds number and transonic flow under Mars sand-containing environment. Phys. Fluids 2023, 35, 076120. [Google Scholar] [CrossRef] [Scilit]
  16. TSI Inc. Model 8390 Bench Top Wind Tunnel P/N 1980004; Rev C; TSI Inc.: Saint Paul, MN, USA, 1989. [Google Scholar]
  17. Setra Systems, Inc. Setra Model 239 Data Sheet. 800.257.3872; Setra Systems, Inc.: Boxborough, MA, USA, 2018. [Google Scholar]
  18. Barlow, J.B.; Rae, W.H.; Pope, A. Low-Speed Wind Tunnel Testing; John Wiley & sons: Hoboken, NJ, USA, 1999. [Google Scholar]
  19. Rodríguez-Sevillano, Á.A.; Casati-Calzada, M.J.; Bardera-Mora, R.; Feliz-Huidobro, A.; Calle-González, C.; Fernández-Antón, J. Flow Study on the Anemometers of the Perseverance Based on Towing Tank Visualization. Appl. Mech. 2022, 3, 1385–1398. [Google Scholar] [CrossRef] [Scilit]
  20. TSI Inc. INSIGHT 3G Data Acquisition, Analysis and Display Software; TSI Inc.: Shoreview, MN, USA, 2009. [Google Scholar]
  21. Zhang, Z. LDA Application Methods: Laser Doppler Anemometry for Fluid Dynamics; Springer Science & Business Media: New York, NY, USA, 2010. [Google Scholar]
Figure 1. Scaling of the Mars 2020 rover model.
Engproc 133 00033 g001
Figure 2. Water-based aerosol in the low-speed wind tunnel (a) and a scheme of the Hydrodynamic Towing Tank (HTT) at the ETSIAE-UPM (b).
Engproc 133 00033 g002
Figure 3. Scheme of the two anemometry techniques used in this study: PIV (a) and LDA (b).
Engproc 133 00033 g003
Figure 4. Test configurations: model placed on the bottom wall (a) and the rear vertical wall (b).
Engproc 133 00033 g004
Figure 5. (a) Wind tunnel water aerosol visualization of the rover aligned with the flow. (b) Wind tunnel visualization of the rover in a rear-flow configuration. (c) HTT dye visualization showing flow interaction with Sensor 1. (d) HTT dye visualization showing flow interaction with Sensor 2.
Engproc 133 00033 g005
Figure 6. PIV non-dimensional velocity contours and flow visualizations. (Left) Horizontal plane at mast height (Configuration 1). (Right) Vertical plane aligned with the centerline (Configuration 2).
Engproc 133 00033 g006
Figure 7. LDA measurements of non-dimensional velocity components for Sensor 1 (left) and Sensor 2 (right) as a function of the wind incidence angle ( β ).
Engproc 133 00033 g007
Table 1. Comparison of characteristic parameters between Mars (full-scale rover) and Earth (1:45 scale model) under Reynolds number similarity.
ParameterMars (Full-Scale Prototype)Earth (1:45 Scale Model)
Characteristic length ( L )2 m4.4 cm
Characteristic velocity ( V )2.5 m/s3.0 m/s
Density ( ρ )0.017 kg/m31.20 kg/m3
Dynamic viscosity (μ) 1.0   ×   10 5   Pa · s 1.85   ×   10 5   Pa · s
Reynolds number~8600~8600
Disclaimer/Publisher’s Note: The statements, opinions and data contained in all publications are solely those of the individual author(s) and contributor(s) and not of MDPI and/or the editor(s). MDPI and/or the editor(s) disclaim responsibility for any injury to people or property resulting from any ideas, methods, instructions or products referred to in the content.