Proceeding Paper

Application of Analytic Hierarchy Process for Evaluating Service Quality of Subscription Video on Demand Services Based on Weighted Values in the Philippines †
Industrial and Systems Engineering Department, De La Salle University, Manila 1004, Philippines
*
Author to whom correspondence should be addressed.
Presented at 2025 IEEE International Conference on Computation, Big-Data and Engineering (ICCBE), Penang, Malaysia, 27–29 June 2025.
Eng. Proc. 2026, 128(1), 36; https://doi.org/10.3390/engproc2026128036
Published: 16 March 2026

Abstract

Streaming services have gained popularity due to their vast content library and convenience. To ensure continued patronage, service quality measurement is important. In this study, we ranked and determined how to maintain the competitiveness of streaming services using the analytic hierarchy process. Using focus group discussions and questionnaire administration, Netflix was found to have the highest perceived service quality, as measured by the consistency ratio and rating scales. Content library, quality of experience, and system availability were the top three service quality dimensions, while the top three sub-dimensions were quality of content, frequency of video freezing, and picture quality. These results allow companies to adjust their service strategies to suit the Philippine market.

1. Introduction

Amid the pandemic in 2020, the majority of the population was forced to stay indoors as a means of quarantine to prevent the further spread of the coronavirus to the general populace of a specific nation. With the entire world in the comfort of their homes, one emerging market was noticeably on the rise, even before the beginning of the pandemic: subscription video on demand (SVOD) [1]. This market has been on the rise, given the ability of the service to provide a wide range of movies and television shows of any genre for each consumer at a fixed cost subscription bundle. The likes of Netflix, HBO Max, Disney+, and Hulu are examples of the major market players within the SVOD industry due to each service’s wide array of exclusive TV and movie titles available for streaming at any given time of day [1]. Services such as movie theaters have become unable to support new safety and health regulation laws. SVOD services, on the other hand, provide a wider array of titles at a lower cost at the comfort of one’s own home. Despite the sudden rise of the SVOD industry, questions remain about the success factors of companies entering the industry [2].
There is a gap in the literature in terms of the development of a decision support system that enables customers to select the optimal service provider based on service quality. Furthermore, there is a need to study and identify which SVOD service quality dimensions need the most improvement, since fulfillment, system availability, and pricing have a strong positive correlation with customer satisfaction [2]. This study involved focus group discussions (FGDs) to determine the service quality dimensions and sub-dimensions for SVOD services. We also utilized the pairwise comparison method when comparing each of the dimensions and sub-dimensions. In addition, the analytic hierarchy process (AHP) was utilized to determine the local and global weights of the SVOD service quality dimensions and sub-dimensions [3].

2. Literature Review

SVOD refers to a streaming service for videos such as movies and TV shows on demand. On-demand entails that consumers can access this service anytime and anywhere. They use any device, and the geographical location of the users is irrelevant [1]. In addition to this, they have the option to pause, play, rewind, and fast forward [2]. On other platforms, they play at twice the speed, add subtitles, and change the language settings. All of this can be accessible to consumers if they pay the fixed monthly fee for these SVOD services. Given that the demands and preferences of consumers with regard to the entertainment industry fluctuate, vary, and constantly change, especially with respect to cultures and countries, SVOD services utilize search engines and recommendation systems to predict and suggest which video content each user is most likely to enjoy or like watching. These features contribute positively to user experience [2].
In the Philippines, the annual revenue of the SVOD industry was reported to be USD 26 million in 2017, and it has continually increased to USD 80 million in 2021 [4]. While the annual revenue growth rate in the Philippines has been increasing in recent years, it has started to decline in 2021 (27.8%), and it is expected to continue to decline from 18.9, 13.4, 9.2, 6.1, and 5.8% throughout 2022–2026, respectively [4]. However, despite the forecasted decline in revenue growth rate, the industry has seen a gradual increase in terms of those who avail of SVOD from 4.1 million in 2018 to 5.7 million in 2020, with an expected continuous growth until 2026 to 8.3 million projected users. Furthermore, despite the decrease in projected revenue growth, the industry remains healthy in terms of potential market, though this growth remains dependent on the customer trends within the industry as well as the rise of potential competitors in the near future. The current decline in growth can be attributed to monopolistic competition, with Netflix having dominance of the market share at 35%.
Previous studies have developed models for service quality, with an attempt to establish the quality dimensions [2,5]. Along with the development of applying attainable criteria in different fields, AHP is considered one of the inclusive multiple criteria decision-making (MCDM) techniques in terms of decision-making criteria. Paired with effective questionnaires and tools, the decision-making process is quantified by researchers based on an importance scale [3].
AHP has already been applied in a similar field, where Lu conducted a study with regard to predicting Movie Box Office hits using the AHP method. AHP was the most widely used technique, amounting to over 32% of the total number of published MCDM-related studies from 2000 to 2014, while hybrid MCDM ranked second as the most popular MCDM technique. On the other hand, the only disadvantage of AHP is that there could be potential problems due to interdependence between criteria and alternatives, which could lead to possible inconsistencies between the judgment and ranking criteria.

3. Methodology

We focused on the leading SVOD services based on market share in the Philippines, such as Netflix, Amazon Prime Video, HBO Go, and Viu [4]. Both qualitative and quantitative methods were utilized for data analysis within individuals from the Philippines, since this analysis involved focus group discussions with experts [2]. These individuals must have availed of subscriptions at least once within two years and have experience using multiple service providers in the SVOD industry. Through the use of AHP analysis tools [6], the study analyzes the raw data to draw insights into dimensions of service quality.
Using FGDs, eight participants replied to six questions (one per service provider—Amazon Prime, Disney Plus, HBO Go, Netflix, Viki, and Viu) about service quality dimensions and sub-dimensions of Strand et al. [2]. This led to the final list of service quality dimensions and sub-dimensions for the ranking of SVOD services through the means of AHP and the development of the perceived service quality evaluation questionnaire. This was discussed with SVOD experts on the pairwise comparison values of each pair of dimensions and sub-dimensions, wherein experts must unanimously agree on a value from 1 to 9 (for pairwise comparison scale) for each pairwise comparison. The results were validated by computing for the consistency index and consistency ratio, and are ranked accordingly. With the derived global weights, the rating from the six questionnaires was computed to attain the total weighted perceived service quality. These were then ranked based on the total weighted perceived service quality of each SVOD service provider. To validate the findings, consistency ratios were used to check whether the pairwise comparison results achieved are consistent to each other [7].

4. Results and Discussion

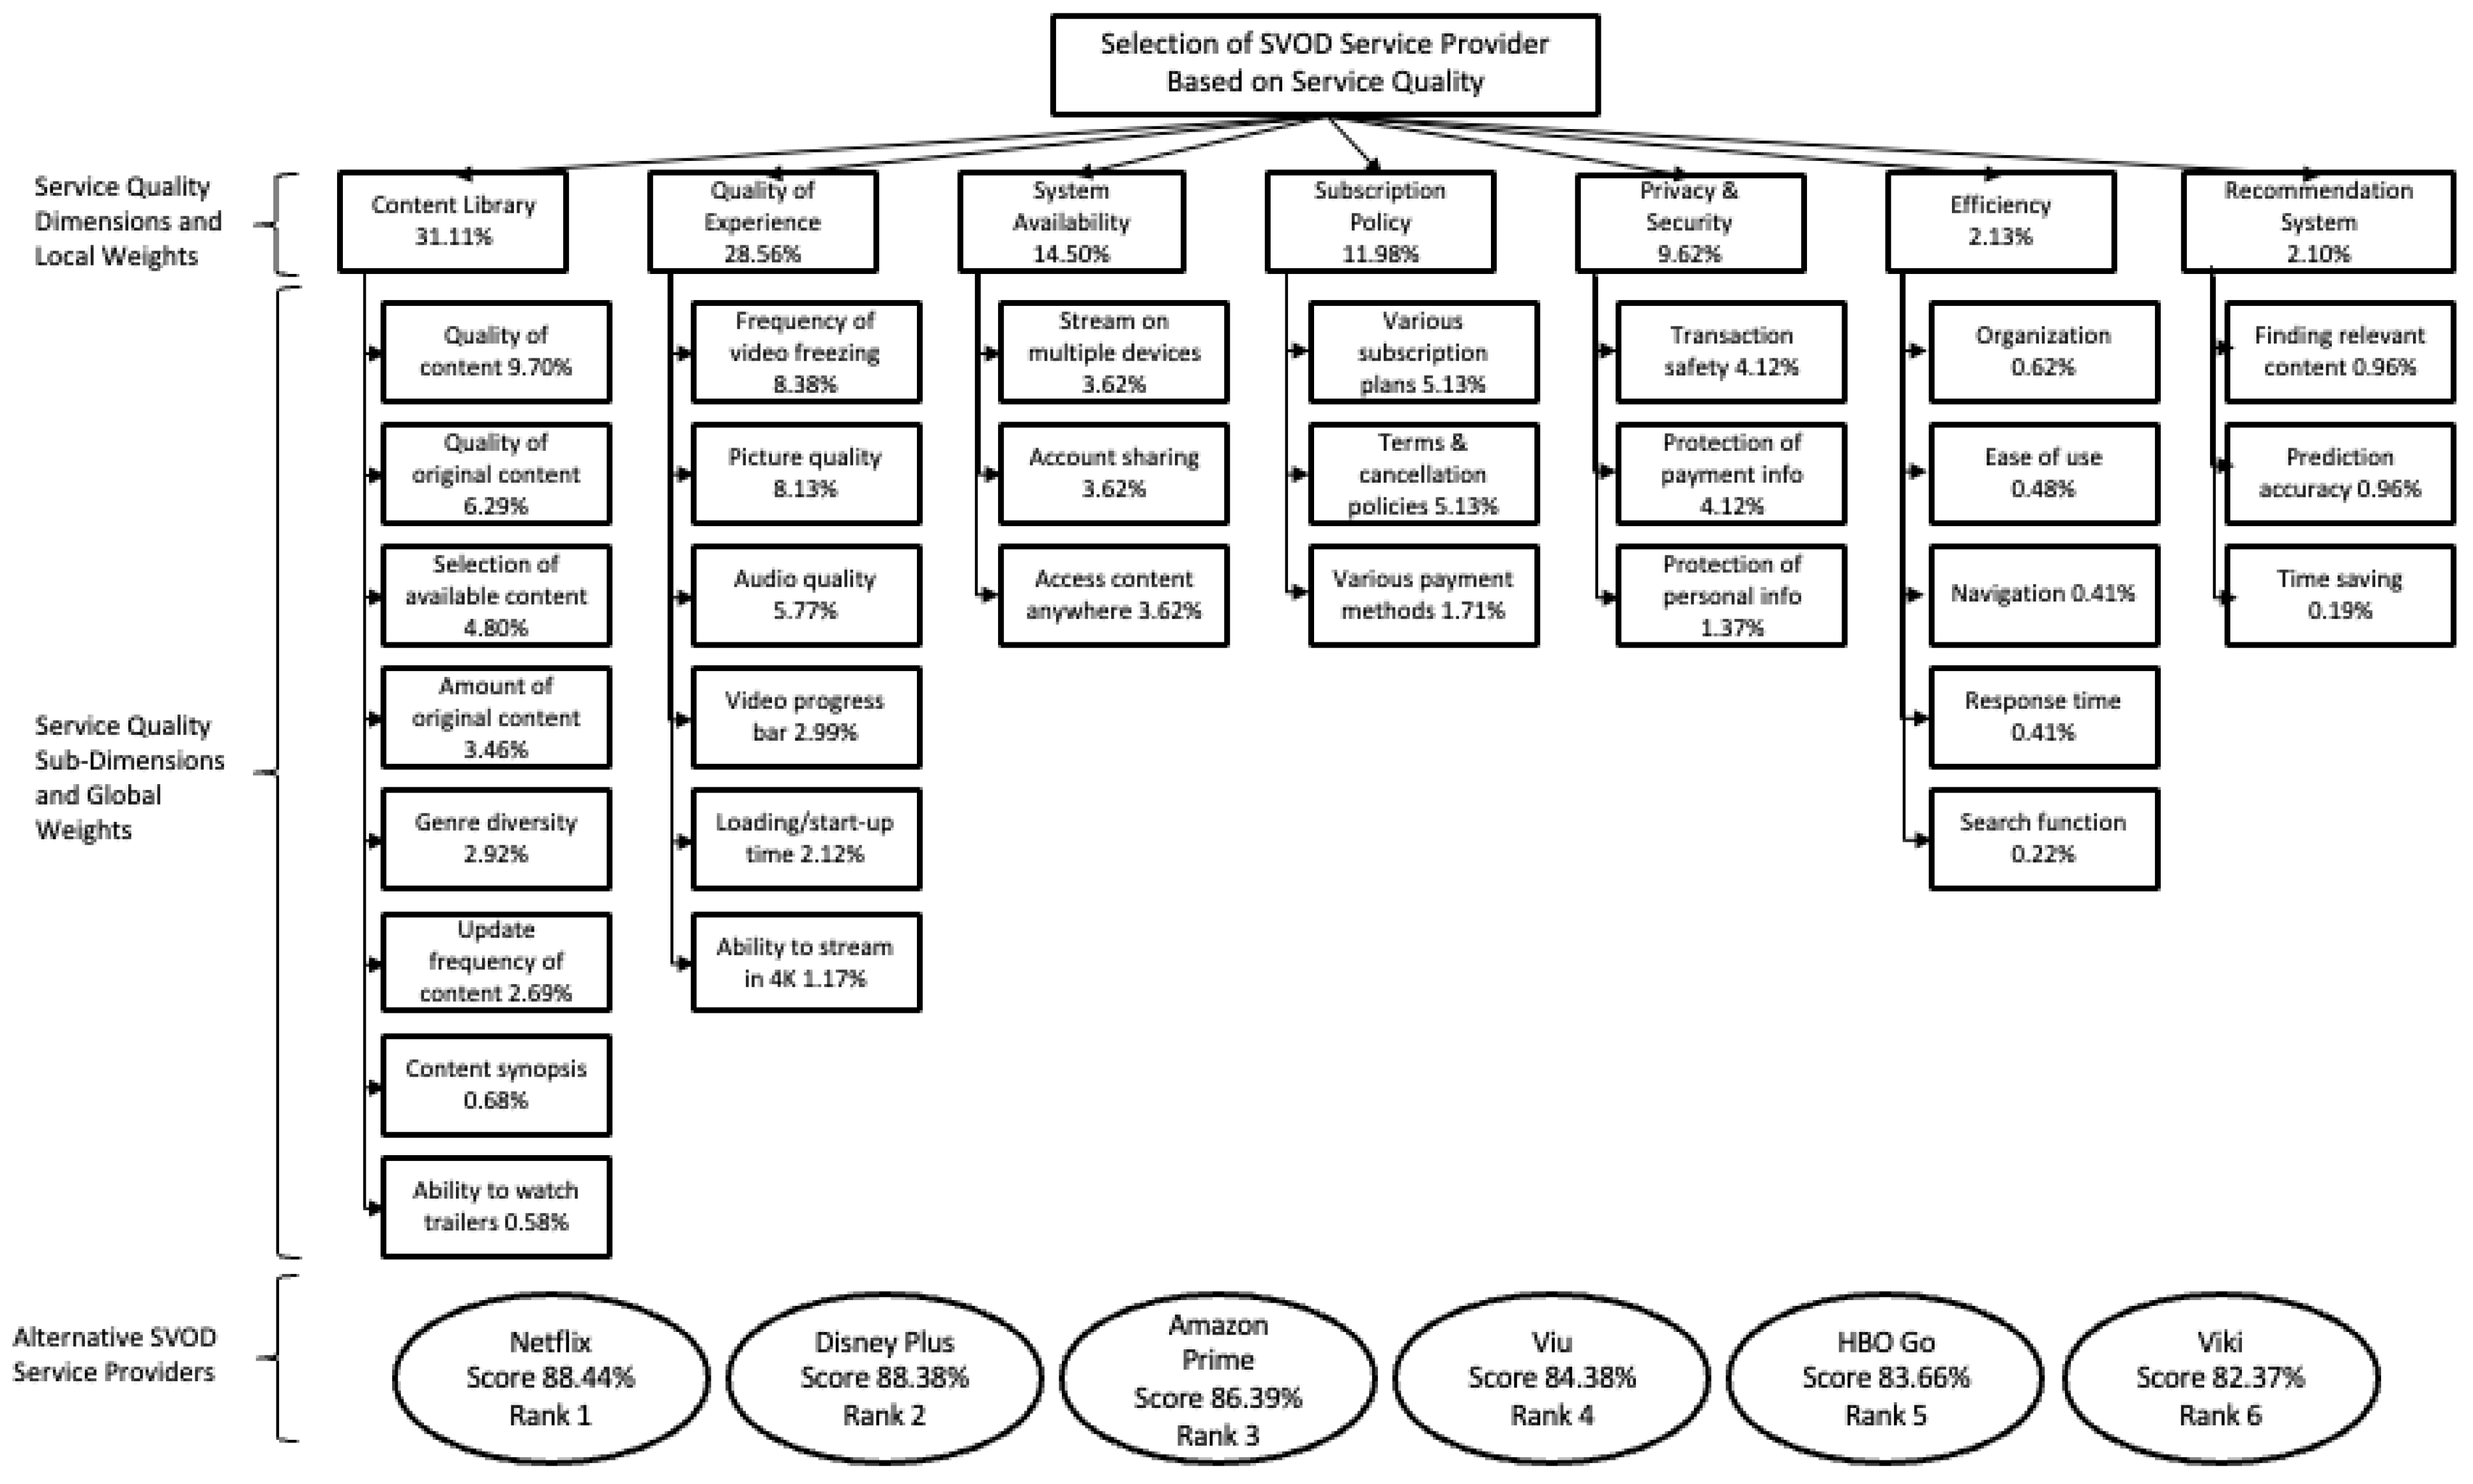
Based on the results of the AHP analysis, the final list of service quality dimensions and sub-dimensions was developed [8,9], as shown in Figure 1. In terms of the insights from the focus group discussion, the content library is the most important dimension, since the primary reason why customers subscribe to SVOD services is to gain access to their content library. Efficiency, privacy and security, quality of experience, recommendation system, subscription policy, and system availability were considered to have a lower degree of importance, since these dimensions exist in service of the content library. The most important sub-dimensions were the content library and quality of experience, particularly the quality of content, picture quality, quality of original content, and audio quality. These findings are later reflected in the pairwise comparisons and the AHP computations for the global weights of the sub-dimensions.
Based on the FGD, the content library dimension held the greatest share of weight at a score of 31.11%, with dimensions such as quality of experience and system availability placing second and third with weights of 28.56 and 14.50%, respectively. The weights translate to each dimension’s percentage contribution to the overall service quality of SVOD. Table 1 shows the ranking of each dimension and sub-dimension, where it utilizes the computed weights acquired from the FGD and AHP analysis.
Content library, quality of experience, and system availability had the highest weighting score based on expert opinion and input from FGD, translating to the idea that, when looking for service providers, the target market relies heavily on the three aforementioned dimensions. The selection of available content, transaction safety, and recommendation systems do not significantly matter to a potential customer when selecting a service provider. Meanwhile, the quality of content (9.70%), the frequency of video freezing (8.38%), and picture quality (8.13%) were recognized as the top three sub-dimensions with the highest global weights, which the potential customer utilizes to determine the overall service quality of SVOD services. The development of local and global weights for dimensions and sub-dimensions provides SVOD service with determining methods of allocating its development efforts into creating a more desirable service. Table 2 shows the pairwise comparison with respect to the computed local weights of the dimensions and sub-dimensions, while Table 3 shows the global weight and perceived quality of sub-dimensions.
Based on Table 1 and Table 2, there is an overall consistency ratio of 0.07089 for the seven dimensions. In terms of the consistency ratio, the ratios have a value less than or equal to 0.1, allowing for the data to be deemed acceptable and valid and indicating that the factors are consistent with their choices. As per the Sato & Tan [6] Rating Scale, if critical ratio is more than 0.1, the judgements made may be untrustworthy because the values may be too near each other for it to be considered random, and thus needs to be repeated. In this scenario, the test was able to capture all the necessary implicit factors needed in the decision context. Having this score shows that the judgements from the data and previous computations are now strongly consistent and not random [10]. Similarly, the sub-dimensions have a consistency ratio value of less than 0.1, which is deemed acceptable and consistent. The weighted questionnaire results had produced rankings of Netflix ranking first, with a total weighted perceived service quality score of 88.44%, followed by Disney Plus (88.38%), Amazon Prime (86.39%), Viu (84.38%), HBO Go (83.66%), and Viki (82.37%).

5. Conclusions

The results of this study provide future and current competitors with an insight into the Philippine market. In the Philippines, Netflix ranks first, with the highest perceived service quality score, followed by Disney Plus, Amazon Prime, Viu, HBO Go, and Viki, as measured by the consistency ratio and rating scales. Based on the rankings and expert insight, companies can have the ability to adjust their service strategies to suit the Philippines market in terms of service desirability.
It is recommended to continue questionnaire surveys for an extended period to monitor the popularity and weight of global ranks, as well as the domestic ranking of competitors, in the event that the said competitors adopt strategies that will further boost their desirability in a certain aspect of the market. In addition, related to cognitive ergonomics, it is necessary to explore the factors behind the ranking/rating of each sub-dimension presented within this study, given that customers primarily interact with SVOD user interfaces.

Author Contributions

Conceptualization, methodology, validation, formal analysis, writing—original draft preparation, M.S.C., N.T.Q., S.B.R. and P.S.; writing—review and editing, M.T. and R.L.; supervision, R.L. All authors have read and agreed to the published version of the manuscript.

Funding

This research received no external funding.

Institutional Review Board Statement

Not applicable.

Informed Consent Statement

Not applicable.

Data Availability Statement

The raw data supporting the conclusions of this article will be made available by the authors on request.

Conflicts of Interest

The authors declare no conflicts of interest.

References

  1. Oskarsson, D.; Ekeroth, F.; Sandoff, V. Perceived Values of SVOD Services; Jonkoping International Business School: Jönköping, Sweden, 2021. [Google Scholar]
  2. Strand, E.; Sandell, V.; Oliver, B. Service Quality, Customer Satisfaction and Brand Loyalty in the Swedish SVOD Industry. 2019. Available online: https://www.diva-portal.org/smash/get/diva2:1320643/FULLTEXT01.pdf (accessed on 7 September 2025).
  3. Rane, N.; Achari, A.; Choudhary, S. Multi-Criteria Decision-Making (MCDM) as a powerful tool for sustainable development: Effective applications of AHP, FAHP, TOPSIS, ELECTRE, and VIKOR in sustainability. Int. Res. J. Mod. Eng. Technol. Sci. 2023, 5, 2654–2670. [Google Scholar]
  4. Statista. Video Streaming (SVoD). 2021. Available online: https://www.statista.com/outlook/dmo/digital-media/video-on-demand/video-streaming-svod/philippines (accessed on 7 September 2025).
  5. Lestari, E.; Soesanto, O.R.C. Predicting Factors That Influence Attitude to Use and its Implications on Continuance Intention to Use SVOD: Study on Netflix Users of Indonesia. DeReMa J. Manaj. 2020, 15, 183–208. [Google Scholar] [CrossRef]
  6. Bajec, P.; Tuljak-Suban, D. A Framework for Detecting the Proper Multi-Criteria Decision-Making Method Taking into Account the Characteristics of Third-Party Logistics, the Requirements of Managers, and the Type of Input Data. In Application of Decision Science in Business and Management; IntechOpen: London, UK, 2019. [Google Scholar] [CrossRef][Green Version]
  7. Sato, Y.; Tan, K.H. Inconsistency indices in pairwise comparisons: An improvement of the Consistency Index. Ann. Oper. Res. 2023, 326, 809–830. [Google Scholar] [CrossRef]
  8. Bennhult, L.; Frogner, H. What Keeps Customers Subscribing to Streaming Services?: A Quantitative Study of E-Loyalty Towards SVOD Services in Sweden. Bachelor’s Dissertation, Uppsala University, Uppsala, Sweden, 2019. [Google Scholar]
  9. Ocampo, L.; Alinsub, J.; Casul, R.A.; Enquig, G.; Luar, M.; Panuncillon, N.; Bongo, M.; Ocampo, C.O. Public service quality evaluation with SERVQUAL and AHP-TOPSIS: A case of Philippine government agencies. Socio-Econ. Plan. Sci. 2019, 68, 100604. [Google Scholar] [CrossRef]
  10. Tešić, D. Measuring dimensions of service quality. Strateg. Manag. 2020, 25, 12–20. [Google Scholar] [CrossRef]
Figure 1. Weighted values and SVOD rankings.
Engproc 128 00036 g001
Table 1. Ranking of dimensions and sub-dimensions.
RankingDimensionLocal Weight
1Content library31.11%
2Quality of experience28.56%
3System availability14.50%
4Subscription policy11.98%
5Privacy and security9.62%
6Efficiency2.13%
7Recommendation system2.10%
Table 2. Pairwise comparison analysis results.
Number of ComparisonsAverage ConsistencyConsistency Index (CI)Random Consistency Index (RI)Consistency Ratio (CR)
Dimension77.560.091.320.070
Content library88.790.111.410.080
Quality of experience55.300.081.120.067
System availability33.000.000.580.000
Subscription policy66.420.081.240.068
Privacy and security33.000.000.580.000
Efficiency33.000.000.580.000
Recommendation System44.000.000.900.000
Table 3. Global weight and perceived quality of sub-dimensions.
DimensionSub-DimensionWgt.Amazon PrimeDisney PlusHBO GoNetflixVikiViu
Selection of available content4.80%85.56%81.85%91.11%79.34%83.87%84.44%
Quality of content9.70%79.26%89.26%80.74%86.69%83.51%86.67%
Genre diversity2.92%92.96%79.26%84.81%87.88%82.44%84.44%
Amount of original content3.46%82.59%88.52%80.00%87.05%81.36%89.63%
Content LibraryQuality of original content6.29%82.59%86.67%85.19%81.08%82.08%88.15%
Update frequency of content2.69%87.04%75.19%81.85%77.41%82.80%83.70%
Content synopsis0.66%81.85%81.48%81.85%81.82%83.15%82.22%
Ability to watch trailers0.58%88.15%84.81%80.74%87.24%86.74%82.96%
Ease of use0.48%81.11%91.48%87.04%96.42%79.57%85.93%
Navigation0.41%83.33%89.63%81.11%93.66%81.36%80.00%
EfficiencyOrganization0.62%81.48%88.52%83.33%90.73%85.66%81.48%
Response time0.41%82.59%91.85%85.19%91.00%79.93%83.33%
Search function0.22%79.26%88.52%84.44%91.00%81.72%82.22%
Transaction safety4.12%89.63%88.52%81.85%91.92%83.15%83.33%
Privacy and SecurityProtection of payment information4.12%85.56%91.85%80.74%90.91%81.36%83.70%
Protection of personal information1.37%91.11%91.85%85.93%90.08%83.87%82.96%
Picture quality8.13%86.67%92.22%78.89%94.40%81.36%85.56%
Audio quality5.77%87.78%88.52%84.44%95.22%83.87%81.85%
Quality ofVideo progress bar2.99%87.78%90.00%84.81%94.12%82.44%79.26%
ExperienceLoading and start-up time2.12%87.78%93.33%82.59%89.99%86.38%80.74%
Frequency of video freezing8.38%88.52%92.59%84.81%85.12%80.29%82.59%
Ability to stream in 4k resolution1.17%88.52%90.37%84.07%87.33%79.21%83.70%
Finding relevant content0.96%89.26%80.74%84.44%87.79%79.93%82.22%
Recommendation SystemTime saving0.19%88.52%82.96%83.33%85.67%86.02%82.22%
Accuracy of predictions0.96%87.04%84.44%85.93%82.64%81.00%85.56%
Ability to select between various subscription plans5.13%84.81%87.41%80.37%85.67%82.08%85.19%
Subscription PolicyTerms and cancelation policies5.13%84.81%90.37%88.52%85.67%78.85%83.33%
Ability to select between various payment methods1.71%85.93%82.59%86.67%87.70%86.38%85.19%
Ability to stream on multiple devices3.62%90.37%87.78%86.67%92.65%82.80%84.07%
System AvailabilityAccount sharing3.62%90.74%91.48%82.96%93.85%85.66%80.00%
Accessing content wherever3.62%90.00%87.04%86.67%92.19%82.80%86.30%
Accessing content whenever3.62%91.11%90.00%84.44%94.40%81.00%86.30%
Total WeightedPerceived Service Quality 86.39%88.38%83.66%88.44%82.37%84.38%
Ranking of SVODService Providers 325164
Disclaimer/Publisher’s Note: The statements, opinions and data contained in all publications are solely those of the individual author(s) and contributor(s) and not of MDPI and/or the editor(s). MDPI and/or the editor(s) disclaim responsibility for any injury to people or property resulting from any ideas, methods, instructions or products referred to in the content.