Proceeding Paper

Predictive Modeling of Malaria Risk Using the Nigerian Demographic and Health Survey Data †

1
Department of Pharmaceutical and Medicinal Chemistry, Faculty of Pharmaceutical Sciences, University of Nigeria, Nsukka 410001, Enugu State, Nigeria
2
Department of Science Laboratory Technology (Biochemistry Unit), Faculty of Physical Sciences, University of Nigeria, Nsukka 410001, Enugu State, Nigeria
3
Department of Pharmaceutical Chemistry, Faculty of Pharmacy, Madonna University Elele Campus, Elele 510001, Rivers State, Nigeria
*
Author to whom correspondence should be addressed.
†
Presented at the 6th International Electronic Conference on Applied Sciences, 9–11 December 2025; Available online: https://sciforum.net/event/ASEC2025.
Eng. Proc. 2026, 124(1), 98; https://doi.org/10.3390/engproc2026124098
Published: 31 March 2026
(This article belongs to the Proceedings of The 6th International Electronic Conference on Applied Sciences)

Abstract

Malaria continues to pose a significant public health challenge in Nigeria, yet there has not been much research utilizing machine-learning techniques to forecast malaria risk. This study developed a machine-learning model that predicts malaria risk by leveraging demographic, environmental, and GPS data from the Nigerian Demographic and Health Survey (DHS) covering the years 2000 to 2020. The dataset was pre-processed and split into a training set (with 406 respondents) and a test set (with 102 respondents). Random Forest (RF), Gradient Boosting (GB) and Linear Regression (LR) algorithms were employed to assess their predictive performance. The RF stood out with the best accuracy, achieving the lowest mean squared error (MSE = 0.0053) and the highest coefficient of determination (R2 = 0.6364). Thus, RF was recognized as the most effective model for predicting malaria risk. The regression equation with positive coefficients (like population density = 0.0141, travel time = 0.0019, minimum temperature = 0.0082, temperature in January = 0.0265, and dry land surface temp = 0.0368) indicate that higher feature values are associated with increased malaria prevalence, while negative coefficients (such as rainfall = −0.0122, nightlights composite = −0.03, potential evapotranspiration = −0.09 and insecticide treated nets = −0.02) suggest that as the feature increases, the prevalence decreases. This study underscores the potential of the RF approach in improving early predictions of malaria risk and can guide targeted interventions to control malaria in areas at high risk.

1. Introduction

Malaria continues to be one of the biggest public health challenges in Nigeria, causing a significant amount of illness and death, especially among children under five and pregnant women [1]. The World Health Organization highlights that Nigeria plays a major role in the global malaria crisis, with millions of cases reported each year. Even after many years of control efforts, the disease remains a threat due to a mix of environmental, socio-economic, and biological factors [2]. This situation emphasizes the urgent need for fresh strategies in risk assessment and intervention planning.
Predictive modelling serves as a powerful tool for grasping malaria risk by combining various datasets and spotting patterns that traditional epidemiological methods might miss [3]. The Nigerian Demographic and Health Survey (DHS) and Malaria Indicator Survey (MIS) offer nationally representative data on household characteristics, mosquito net ownership and usage, fever prevalence, and rapid diagnostic test results. These surveys provide insights into both individual and community-level factors that influence malaria transmission, making them essential for building effective predictive models.
Recently, machine learning and statistical modelling techniques have been increasingly applied to DHS data to estimate malaria prevalence and identify high-risk populations [3,4,5]. These models can take into account demographic factors (like age, sex, and education), socio-economic indicators (such as wealth index and urban-rural residence), and environmental aspects (including seasonality and geographic region). By training algorithms on these datasets, researchers can create risk maps, pinpoint vulnerable groups, and predict future transmission trends. Importantly, predictive modelling enables targeted interventions, such as focusing on the distribution of insecticide-treated nets, indoor residual spraying, and community health education in areas identified as high risk [6]. Incorporating predictive analytics into malaria control strategies aligns perfectly with Nigeria’s National Malaria Strategic Plan, aiming to reduce the burden of this disease effectively.

2. Materials and Methods

2.1. Data Collection and Pretreatment

The dataset was obtained from the 2020 Nigerian Demographic and Health Survey (DHS) and includes 567 respondents along with 135 different covariates [7]. These cover a range of factors such as demographics, malaria exposure, healthcare access, and various raster-based climatic variables like rainfall, land surface temperature, and elevation. The raster data was processed using R, standardized to a consistent resolution, and matched with global positioning system (GPS) coordinates. After cleaning up the data by removing any missing values and duplicates, the data ended up with 508 respondents and 134 covariates [2]. We also took out any outliers, designated malaria_prevalence_2020 as our target variable, and standardized the predictors using Python (version 3.0) libraries. Malaria prevalence was defined at the cluster level rather than the individual level. Individual malaria test results (positive/negative) from the DHS were aggregated within each sampling cluster to compute the proportion of malaria–positive individuals. This cluster-level prevalence estimate was then assigned to all respondents within the corresponding cluster. Consequently, the final dataset comprises 567 individual respondents, each linked to a shared cluster-level malaria prevalence value.

2.2. Statistical Analysis

An independent t-test was conducted to explore the relationships between various factors and malaria prevalence, focusing only on those predictors that showed significance at p < 0.05. The significant covariates were then fed into a machine-learning regression model, built using Python 3.0, to improve our predictions of malaria prevalence and provide valuable, data-driven insights for assessing risk [8].

2.3. Building and Evaluation of the Model

The dataset was divided into training (406 respondents) and test sets (102 respondents) using an 80/20 split. The models were trained on the training set using the fit method, while hyperparameters were fine-tuned through random search on the test set. Three scikit-learn regression algorithms, Linear Regression, Random Forest, and Gradient Boosting, were utilized to predict malaria risk based on demographic, environmental, and GPS data. The Mean Squared Error (MSE) and R2, along with p-values, F-statistics, variance inflation factor (VIF), residual error analysis, and learning curves, were evaluated to assess model performance [3]. This comprehensive approach ensured that our predictions for malaria risk were accurate, robust, and provided valuable insights

3. Results

3.1. Data Set and the Significant Covariates

The 2020 Nigerian Demographic and Health Survey dataset was examined to evaluate the prevalence of malaria. It highlighted several important factors, such as population density, rainfall, temperature, and access to healthcare, that play a significant role in rural communities. The Ordinary Least Squares (OLS) regression identified several significant predictors of malaria prevalence, including demographic, environmental, and climatic variables (malaria_prevalence_2020, nightlights composite, UN_population_density_2020, travel times, ITN_coverage_2020, rainfall_2015, minimum_temperature_2020, temperature in January, potential evapotranspiration_2020, day_land_surface_temperature_2005). Model performance was minimal, with R2 = 0.586, adjusted R2 = 0.576, F-statistic = 58.2, Prob(F) = 1.65 × 10−65, AIC = −851.7, and BIC = −812.3. Significant covariates (p < 0.05) are detailed in Table 1.

3.2. Feature Importance Analysis of the Model

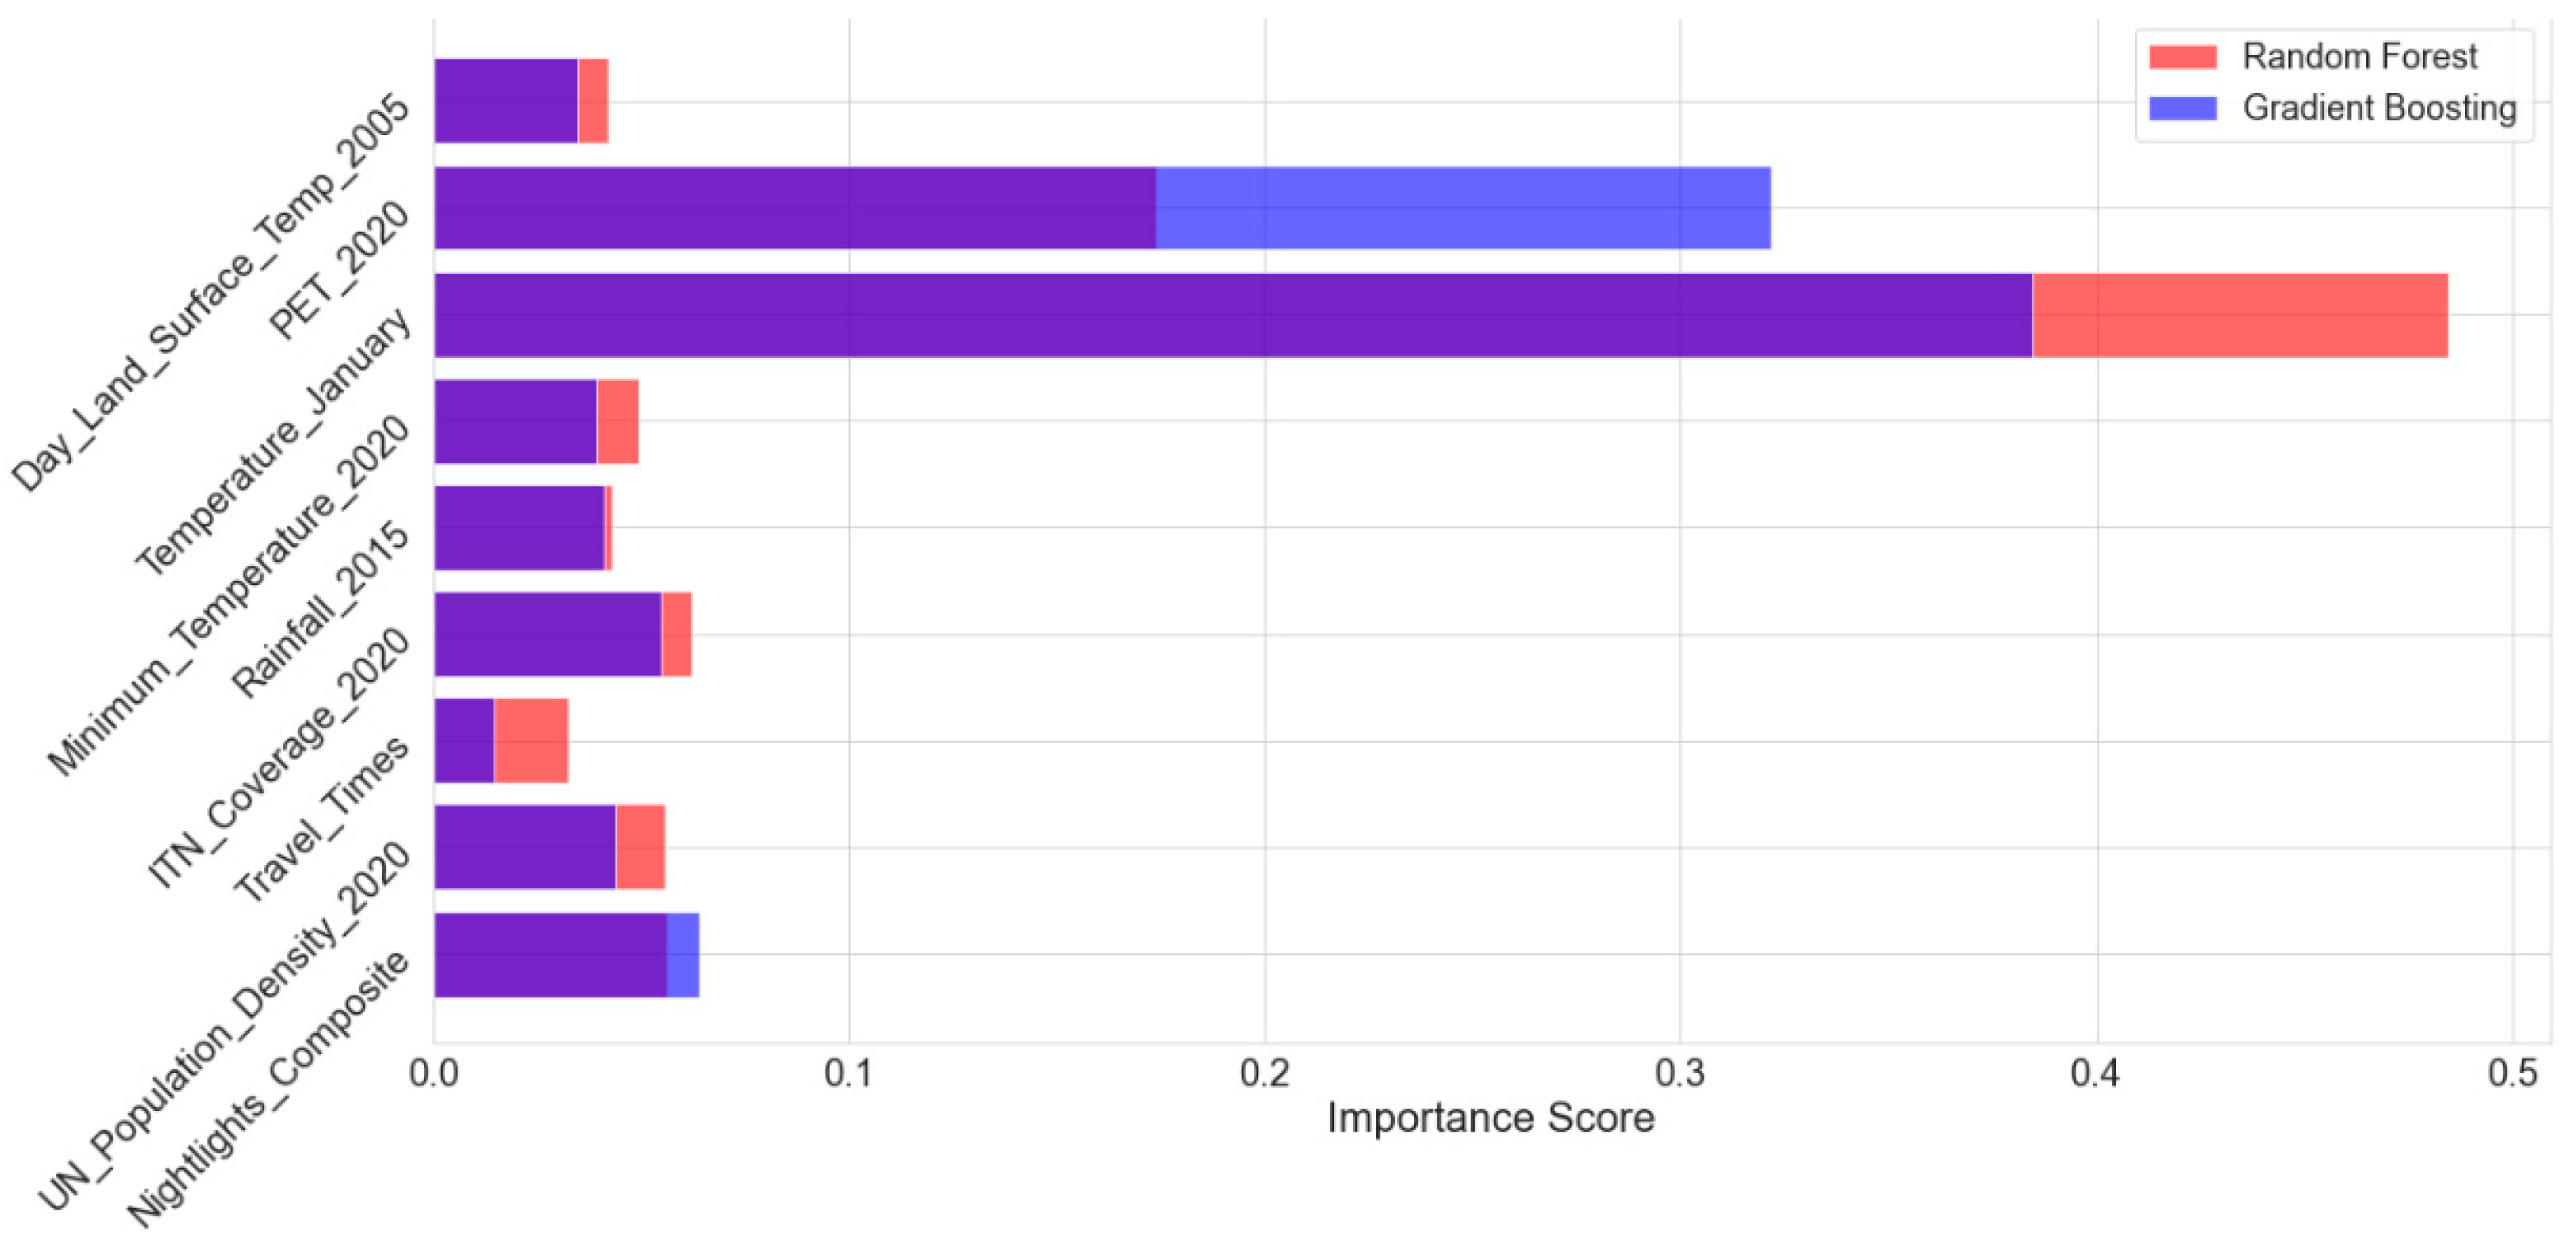
The feature importance analysis of the model was performed for RF and GB to provide insight into which features contribute most to the model predictions. A histogram was used to compare the feature importance for both models (RF and GB), and it also allows for direct comparison of which features have more influence on each model. From the histogram (Figure 1), the y-axis represents the feature importance for malaria risk prediction, while the x-axis represents the importance score (derived from the trained models).

3.3. Modelling Malaria Prevalence

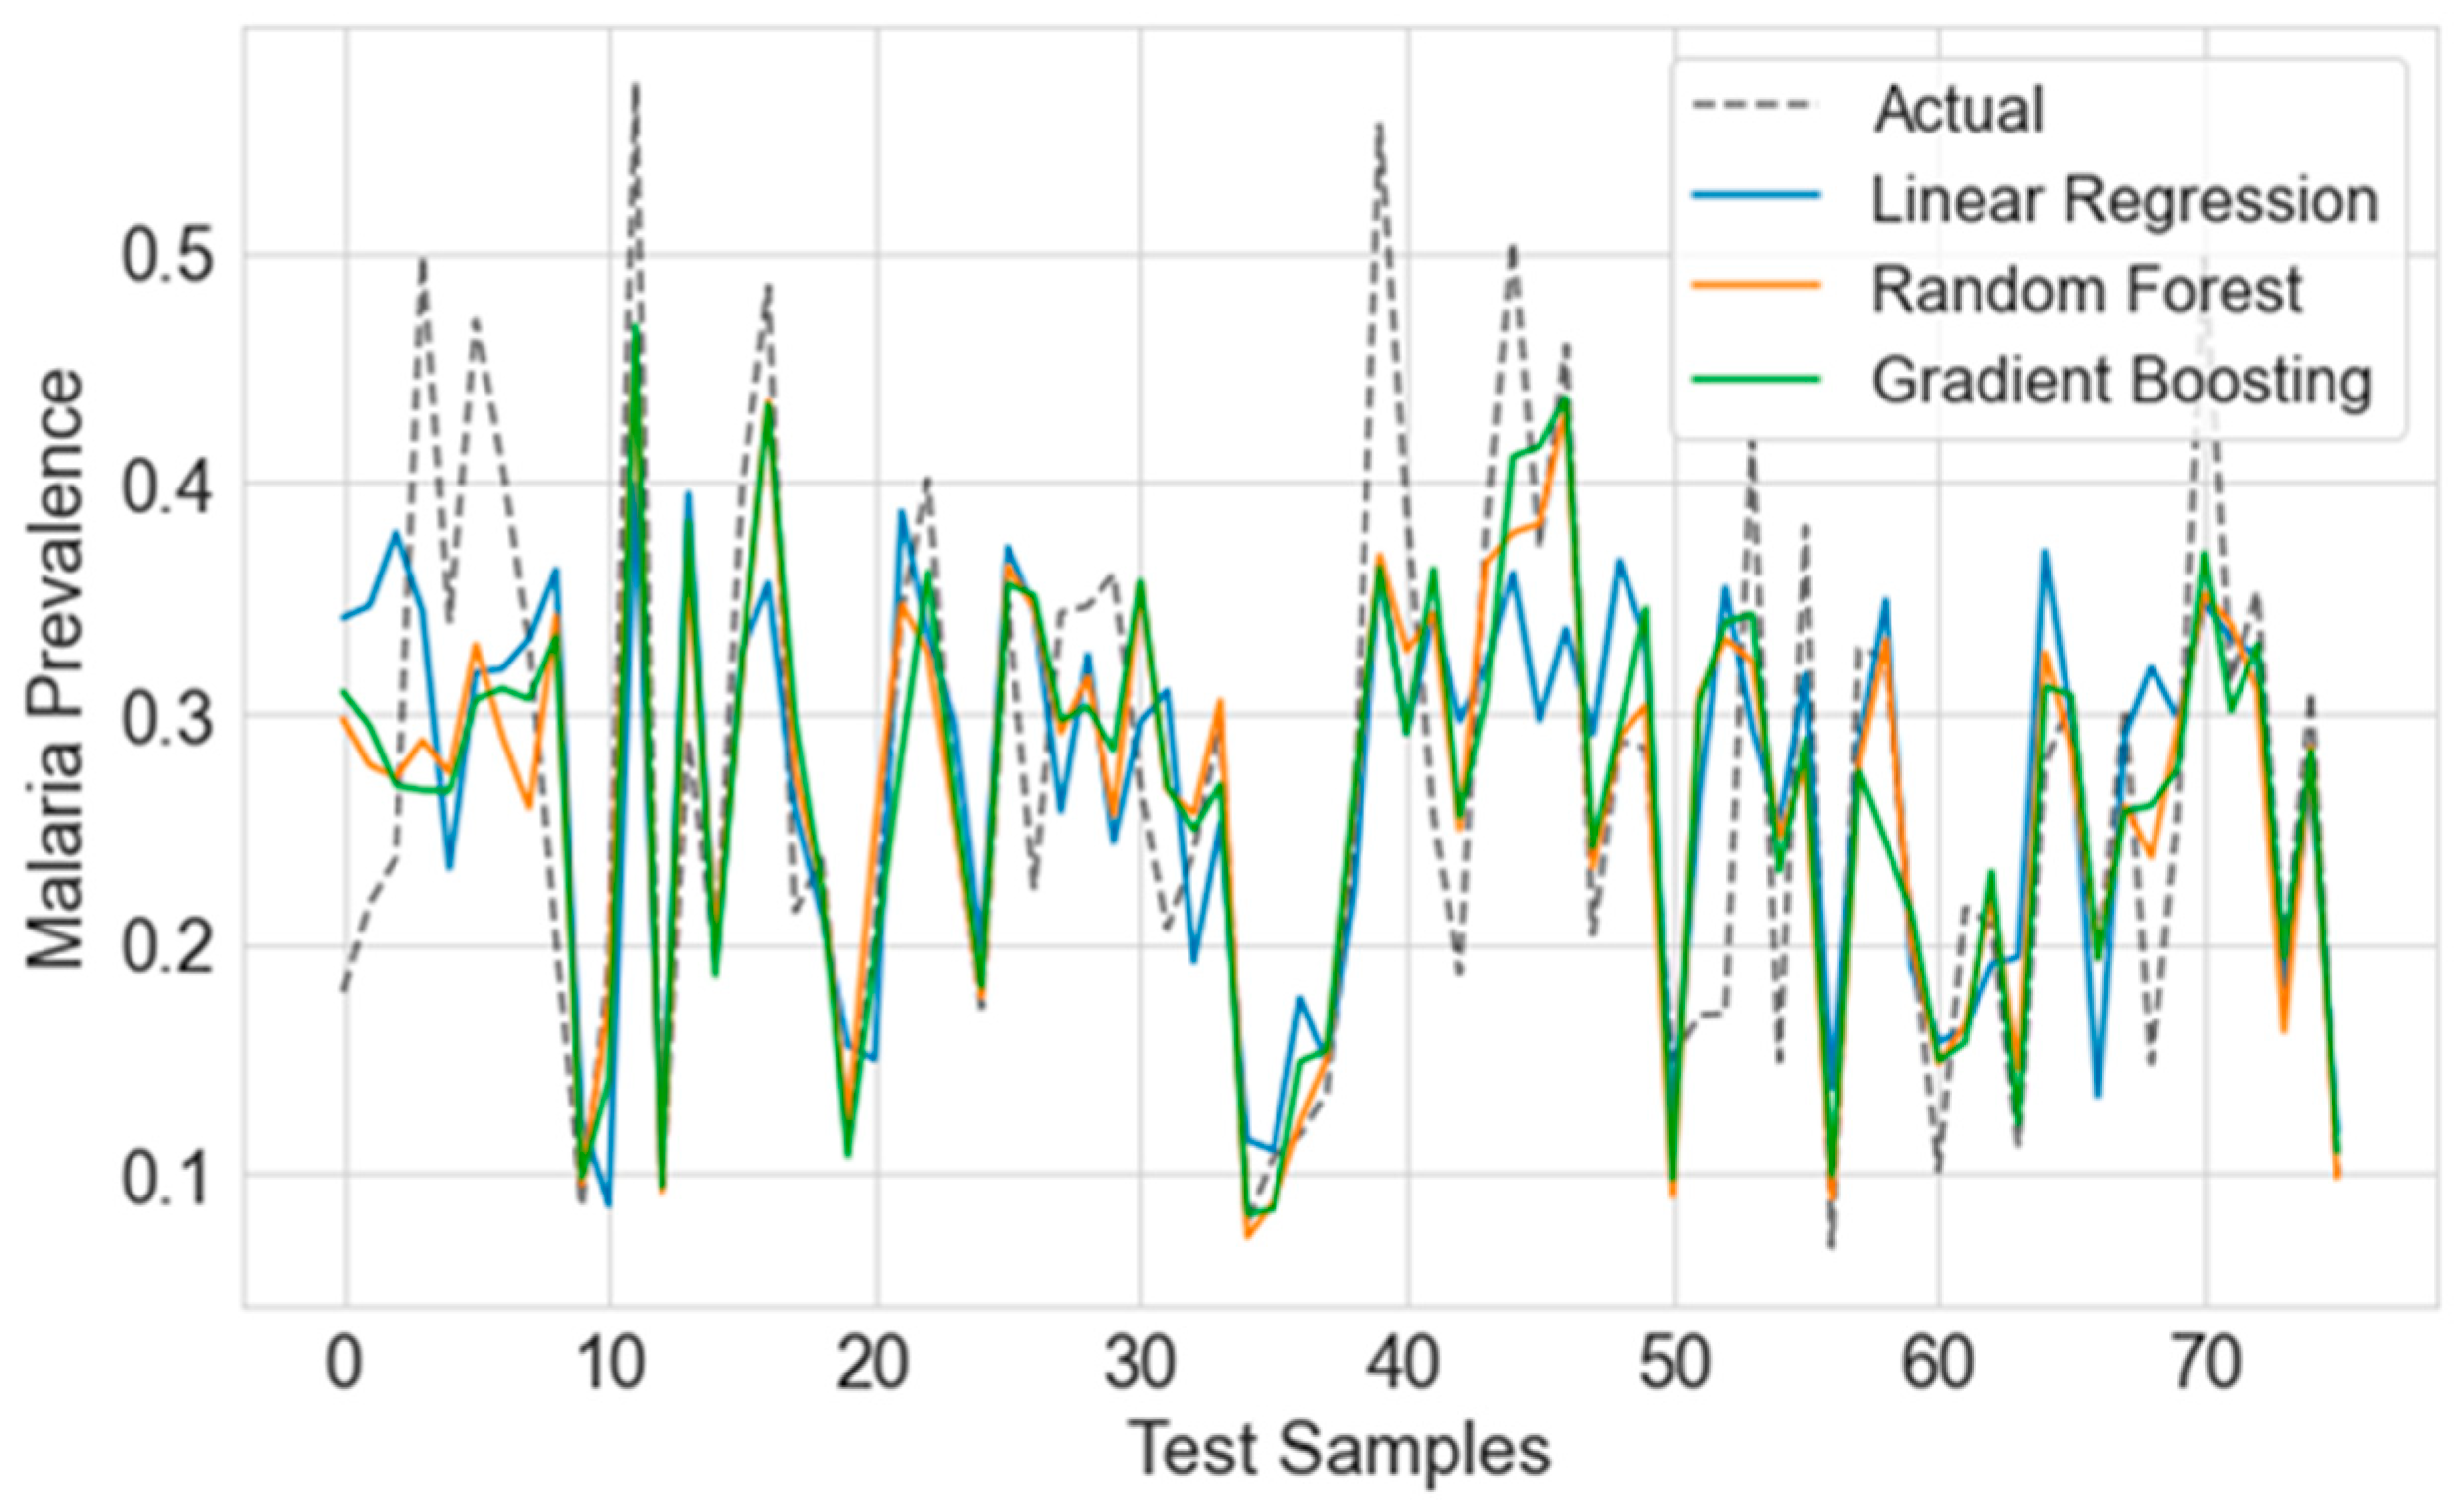
The Random Forest (RF), Gradient Boosting (GB) and Linear Regression (LR) algorithms were employed to predict malaria prevalence by considering the various environmental, demographic, and health factors. The data was divided into training and test sets, and the predictions against the actual values were plotted. This allowed the visualization of how accurate the models were and to pinpoint which predictive algorithm was the most effective for assessing malaria risk (Figure 2).

3.4. Model Evaluation

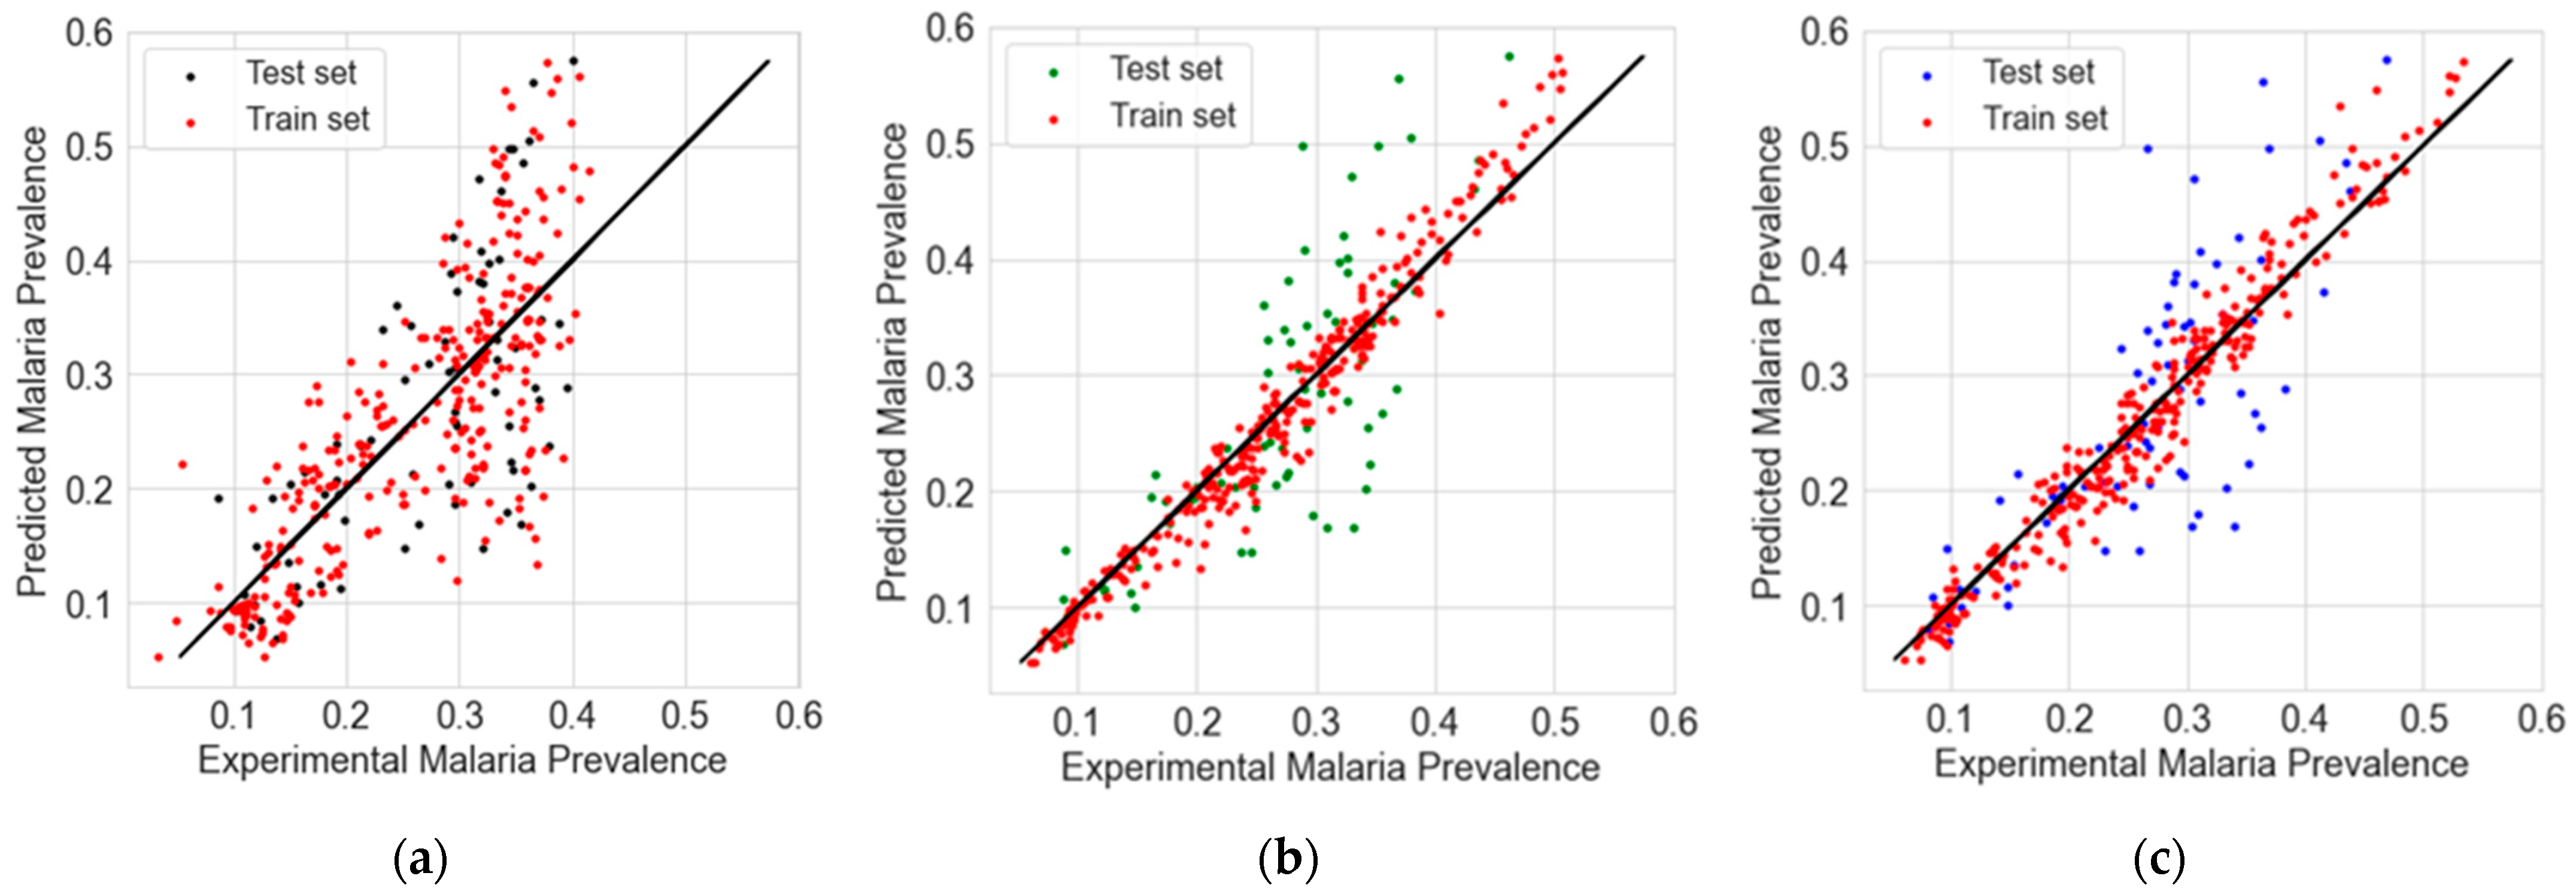
To build confidence in the predictions about malaria prevalence, both experimental and predicted values were plotted for the training and test sets across various machine learning models (Figure 3). The RF regression model stood out with the best alignment, showing points that were closely clustered around the regression line, which highlights its accuracy in predictions. A strong correlation between the predicted and actual values was also observed, reinforcing the model’s effectiveness.
The model was quantified using the regression equation derived from the LR model, as shown in Equation (1):
MalPre = 0.26 − 0.030 NC + 0.0141 PD + 0.0019 TT − 0.02 ITN − 0.0122 Rf + 0.0082 MT + 0.0265 TJ − 0.090 PET + 0.0368 DLS
where NC—nightlights composite, PD—population density, TT—travel time, ITN—insecticide-treated nets, RF—rainfall, MT—minimum temperature, TJ—temperature in January, PET—potential evapotranspiration, and DLS—dry lowland soil.
Positive coefficients, like PD = 0.0141, point to an increase in malaria prevalence, while negative coefficients, such as RF = −0.0122, indicate a decrease.

3.5. Model Comparison

The model performance was evaluated using Mean Squared Error (MSE) and R-Squared (R2) metrics. Linear Regression shows a slightly lower performance when compared with RF and Gradient Boosting, with an MSE of 0.00079 and an R2 of 0.4633 (Table 2). On the other hand, RF came out on top, boasting the lowest MSE at 0.0053 and the highest R2 at 0.6364. Gradient Boosting also outperformed LR, matching the MSE of RF with 0.0057 and achieving an R2 of 0.6140, which confirms its strong predictive accuracy.

4. Discussion

The analysis of the 2020 Nigerian DHS dataset highlights the complex factors that contribute to malaria transmission [3]. Key elements like population density, rainfall, temperature, and access to healthcare play a crucial role. Using OLS regression, this study identified several significant predictors, aligning with previous studies that emphasize the importance of demographic and environmental factors in understanding malaria epidemiology [9]. The model fit was impressive (R2 = 0.586, adjusted R2 = 0.576), showcasing the effectiveness of the regression method in capturing these relationships.
A triangular comparison of the machine learning models showed that RF stood out with the highest predictive accuracy (MSE = 0.0053, R2 = 0.6364), surpassing both LR and slightly edging out the GB regressor. This finding supports earlier research that highlights RF’s exceptional ability to manage complex, nonlinear relationships and interactions among variables in malaria prediction. Gradient Boosting also performed comparatively well (R2 = 0.6140), demonstrating its strength in refining predictions through iterative learning, as seen in malaria outbreak modelling in The Gambia [10].
The regression equation from this study further clarifies how different factors influence malaria prevalence. For example, population density (PD = 0.0141) shows a positive correlation with malaria cases, reinforcing the idea that densely populated rural areas can facilitate the spread of the disease [2]. On the other hand, rainfall (Rf = −0.0122) had a negative coefficient, which might reflect seasonal changes and the ecology of mosquito vectors, consistent with findings that too much rainfall can disrupt mosquito breeding habitats [11]. In addition, ITN and TJ showed negative and positive correlations, respectively. PET represents the evaporated and transpired amount of water, if sufficient water were available, and this creates different niches specific to the Anopheles mosquito [12]. Studies in India have shown that lower PET led to wetter conditions, supporting breeding sites for the Anopheles mosquito [12]. Our model revealed a similar pattern (PET = −0.090), supporting higher vector abundance. Anopheles mosquitoes exhibit optimal survival and reproductive activity at temperatures around 25 ± 5 °C, a range that corresponds closely to January climatic conditions across much of Nigeria [13]. The observed positive correlation (TJ = 0.0265) reinforces previous evidence highlighting the influence of January temperatures on elevated mosquito activity, optimal parasite development, regional thermal variation, and seasonal lag effects in Nigeria [14].

5. Conclusions

Machine learning is paramount in malaria surveillance and control. Combined demographic and environmental data, and predictive models with traditional epidemiological methods, can help direct targeted interventions, optimize resource use, and enhance early warning systems, as well as support Nigeria’s efforts in combating malaria.

Author Contributions

Conceptualization, C.O.N. and T.O.A.; methodology, C.O.N.; software, T.O.A.; validation, W.O.O., J.C.U. and T.O.A.; formal analysis, J.C.U.; investigation, J.C.U.; resources, T.O.A.; data curation, T.O.A.; writing—original draft preparation, J.C.U.; writing—review and editing, C.O.N.; visualization, T.O.A.; supervision, W.O.O.; project administration, C.O.N.; funding acquisition, C.O.N. All authors have read and agreed to the published version of the manuscript.

Funding

This research received no external funding.

Institutional Review Board Statement

Not applicable.

Informed Consent Statement

Not applicable.

Data Availability Statement

The MIS data is available with permission. https://dhsprogram.com/data/available-datasets.cfm (accessed on 15 June 2023).

Acknowledgments

The authors acknowledge Inner City Fund (ICF) International for granting access to DHS data to TOA and CON.

Conflicts of Interest

The authors declare no conflicts of interest.

Abbreviations

The following abbreviations are used in this manuscript:
WHOWorld Health Organization
GPSGlobal Positioning System
DHSDemographic and Health Survey
LRLogistic Regression
RFRandom Forest
GBGradient Boosting
MSEMean Squared Error
MISMalaria Indicator Survey
VIFVariance Inflation Factor
AICAkaike Information Criterion
BICBayesian Information Criterion
SEStandard Error
MalPreMalaria Prevalence
OLSOrdinary Least Squares
NCNightlights Composite
PDPopulation Density
TTTravel Time
ITNInsecticide-Treated Nets
RfRainfall
MTMinimum Temperature
TJTemperature in January
PETPotential Evapotranspiration
DLSDry Lowland Soil

References

  1. World Health Organization. World Malaria Report 2025: Addressing the Threat of Antimalarial Drug Resistance. World Health Organization 2025. Available online: https://www.who.int/teams/global-malaria-programme/reports/world-malaria-report-2025 (accessed on 29 December 2025).
  2. González-Sanz, M.; Berzosa, P.; Norman, F.F. Updates on malaria epidemiology and prevention strategies. Curr. Infect. Dis. Rep. 2023, 25, 131–139. [Google Scholar] [CrossRef] [Scilit] [PubMed]
  3. Ayoka, T.O.; Nnadi, C.O. Application of machine learning models in predicting malaria prevalence in Nigeria: An analysis of the 2015–2020 demographic and health surveys. J. Parasit. Dis. 2025. [Google Scholar] [CrossRef] [Scilit]
  4. Yitageasu, G.; Worede, E.A.; Alemu, E.A.; Tigabie, M.; Birhanu, A.; Angelo, A.A.; Aweke, M.N.; Demoze, L. Malaria prevalence and its determinants across 19 sub-Saharan African countries: A spatial and geographically weighted regression analysis. Malar. J. 2025, 24, 305. [Google Scholar] [CrossRef] [Scilit] [PubMed]
  5. Lakew, G.; Tareke, A.A.; Yigzaw, Z.A.; Getachew, D.; Getachew, E.; Yirsaw, A.N. Individual and community level factors of malaria among under-five children in Kenya: Based on the Kenya Demographic and Health Survey. PLoS ONE 2025, 20, e0335346. [Google Scholar] [CrossRef] [Scilit] [PubMed]
  6. Ayoka, T.O.; Upaganlawar, A.; Nnadi, C.O. Predictive modeling of malaria prevalence using socioeconomic, environmental, and demographic determinants across age and gender groups. Discov. Public Health 2025, 22, 874. [Google Scholar] [CrossRef] [Scilit]
  7. National Population Commission (NPC) [Nigeria] and Inner-City Fund (ICF) International. Nigeria Demographic and Health Survey 2000–2020 [Malaria Indicator Survey, Malaria Module and GPS Data]. The DHS Programme. 2021. Available online: https://dhsprogram.com/data/available-datasets.cfm (accessed on 15 June 2023).
  8. Apeh, I.S.; Ayoka, T.O.; Nnadi, C.O.; Obonga, W.O. Modeling the quantitative structure–activity relationships of 1,2,4-triazolo[1,5-a]pyrimidin-7-amine analogs in the inhibition of Plasmodium falciparum. Eng. Proc. 2025, 87, 52. [Google Scholar] [CrossRef] [Scilit]
  9. Chiziba, C.; Mercer, L.D.; Diallo, O.; Bertozzi-Villa, A.; Weiss, D.J.; Gerardin, J.; Ozodiegwu, I.D. Socioeconomic, demographic, and environmental factors may inform malaria intervention prioritization in urban Nigeria. Int. J. Environ. Res. Public Health 2024, 21, 78. [Google Scholar] [CrossRef] [Scilit] [PubMed]
  10. Khan, O.; Ajadi, J.O.; Hossain, M.P. Predicting malaria outbreak in The Gambia using machine learning techniques. PLoS ONE 2024, 19, e0299386. [Google Scholar] [CrossRef] [Scilit] [PubMed]
  11. Alberta, J.N. The role of climate and environmental factors in malaria transmission in Nigeria: Challenges and prospects. INOSR Appl. Sci. 2024, 12, 6–10. [Google Scholar] [CrossRef] [Scilit]
  12. Lee, E.; Burkhart, J.; Olson, S.; Billings, A.A.; Patz, J.A.; Harner, E.J. Relationships of climate and irrigation factors with malaria parasite incidences in two climatically dissimilar regions in India. J. Arid Environ. 2016, 124, 214–224. [Google Scholar] [CrossRef] [Scilit]
  13. Adewoyin, Y.; Adeboyejo, A.T. Aspects of climatic and socioeconomic parameters and malaria prevalence. Evidence from Nigeria. Int. J. Trop. Dis. Health 2017, 28, 1–9. [Google Scholar] [CrossRef] [Scilit]
  14. Akinbobola, A.; Hamisu, S. Malaria and climate variability in two northern stations of Nigeria. Am. J. Clim. Change 2022, 11, 59–78. [Google Scholar] [CrossRef]
Figure 1. Histogram of feature importance for malaria risk prediction; the colored bars represent the superimposed color between red (RF) and blue (GB). The indigo-colored bar is a superimposed color mix of blue and red.
Engproc 124 00098 g001
Figure 2. Malaria predictions versus actual values.
Engproc 124 00098 g002
Figure 3. Correlation of predicted and experimental malaria prevalence. (a) LR; (b) RF; (c) GB.
Engproc 124 00098 g003
Table 1. Statistically significant covariates.
CovariatesCoefficientSETp > |t|[0.025 0.975]
Constant0.26200.00465.570.0000.254 0.270
x1−0.02630.004−5.9520.000−0.035 −0.018
x20.01270.0052.4390.0150.002 0.023
x30.00060.0050.1320.895−0.009 0.010
x4−0.01590.005−3.0010.003−0.026 −0.005
x5−0.01400.009−1.6180.107−0.031 0.003
x60.00190.0080.2330.817−0.014 0.018
x70.03120.0122.5630.0110.007 0.055
x8−0.08940.018−5.1030.000−0.124 −0.055
x9−0.08940.018−5.1030.000−0.124 −0.055
x1 = Nightlights composite, x2 = UN_Population_Density_2020, x3 = Travel times, x4 = ITN_Coverage_2020, x5 = Rainfall_2015, x6 = Minimum_Temperature_2020, x7 = Temperature_January, x8 = potential evapotranspiration _2020, x9 = Day_Land_Surface_Temp_2005, SE = Standard error, Number of observation = 380, Df residuals = 370, Df model = 9, Covariance type = non robust, R-squared = 0.586, Adjusted R-squared = 0.576, Omnibus = 1.101, Prob(Omnibus) = 0.577, Skew = 0.023, Kurtosis = 3.231, Durbin–Watson = 0.994, Jarque–Bera (JB) = 0.880, Prob(JB) = 0.644, Cond. No. = 12.4.
Table 2. Statistical model comparison.
ML AlgorithmsTrain SetTest Set
MSER2Adj R2MSER2Adj R2
RF0.00050.96320.96210.00530.63640.5868
GB0.00060.95770.95660.00570.61400.5613
LR0.00540.61590.60410.00790.46330.3901
Disclaimer/Publisher’s Note: The statements, opinions and data contained in all publications are solely those of the individual author(s) and contributor(s) and not of MDPI and/or the editor(s). MDPI and/or the editor(s) disclaim responsibility for any injury to people or property resulting from any ideas, methods, instructions or products referred to in the content.