Proceeding Paper

Cross-Regional Synchronization of Northern-Hemisphere Heatwaves Using Dynamic Event Synchronization and Frequent Pattern Growth †
1
Department of Computer Science, University of Taipei, Taipei 100234, Taiwan
2
Department of Earth and Life, University of Taipei, Taipei 100234, Taiwan
*
Author to whom correspondence should be addressed.
Presented at 8th International Conference on Knowledge Innovation and Invention 2025 (ICKII 2025), Fukuoka, Japan, 22–24 August 2025.
Eng. Proc. 2025, 120(1), 18; https://doi.org/10.3390/engproc2025120018
Published: 2 February 2026
(This article belongs to the Proceedings of 8th International Conference on Knowledge Innovation and Invention)

Abstract

We integrate the dynamic event synchronization (DES) method to analyze temporal synchronization between regions with the frequent pattern growth (FP-Growth) pattern to extract significant spatial associations. The European Centre for Medium-Range Weather Forecasts ECMWF Reanalysis version 5 reanalysis data were partitioned into two 30-year intervals (1965–1994 and 1995–2024). First, inter-regional heatwave synchrony was measured using DES, and prevalent spatial associations were derived through the FP-Growth pattern. Comparative results show that the later interval yields twice as many association rules, a 34% decline in short-range linkages, and an 8% increase in long-range teleconnections—evidence of a transition from localized clustering toward transcontinental-scale heatwave synchronization.

1. Introduction

We investigated the spatiotemporal synchrony and cross-regional transmission patterns of heatwaves by integrating dynamic event synchronization (DES) with the frequent pattern growth (FP-Growth) algorithm. Since the 1950s, extreme heat events have become more frequent and intense across most land regions. According to the Intergovernmental Panel on Climate Change Sixth Assessment Report, heatwaves have not only increased in frequency and intensity but also exhibited simultaneous occurrences across regions, with North America, Europe, and parts of Asia often experiencing heatwave events concurrently [1,2]. To analyze such cross-regional synchrony of heatwaves, studies have commonly employed fixed time-window approaches to assess the co-occurrence of events in different areas. However, such approaches may fail to accurately capture the actual time differences between events, especially during periods with irregular occurrence frequencies, making it difficult to detect true synchrony [3]. In contrast, dynamic event windows can adjust the window length based on the actual time difference between events, offering more precise representation of synchrony across regions [4,5,6].
Heatwaves that occur across geographically distant regions may lead to cascading impacts, emphasizing the importance of understanding their synchronous characteristics for climate risk assessment [7]. Understanding whether heatwaves exhibit synchronous characteristics has therefore become a critical issue in climate risk assessment. While most studies focus on detecting synchrony by observing whether multiple regions experience heatwaves within a similar timeframe [8], statistical methods are employed to evaluate the spatial correlation of climate variables across geographic locations, helping to elucidate the climatic mechanisms behind heatwave synchrony [9]. Moreover, a nonlinear relationship between the probability of extreme climate event synchrony and geographic distance is observed, with a turning point around 2500 km [10]. Considering that heatwaves are also driven by large-scale atmospheric circulation patterns, we adopted this distance threshold as the basis for distinguishing between long-range and short-range heatwave connections. Regarding spatial characteristics, adaptive filter techniques have been applied in some studies to explore short-range spatial synchrony [11].
Distinct from earlier approaches, we applied the DES method in combination with the FP-Growth algorithm, which is well-suited for efficient association rule mining and avoids candidate set generation [12]. This integrated framework captures nonlinear temporal relationships and extracts representative cross-regional transmission patterns of extreme events.

2. Materials and Methods

2.1. Definition of Heatwave Events

We defined heatwave-related events based on the following two criteria. The first type considers a heatwave event to occur at a grid point on a given day when the daily mean temperature exceeds the 95th percentile of historical summer daily means at that location. The second type, defined as an intense heatwave event, refers to a case where the temperature anomaly at a location (relative to the climatological mean for the same calendar day) exceeds 5 °C for five consecutive days starting from the initial day. The first criterion is expressed as follows [13]:
T ( x , y , t ) > P e r c e n t i l e 95 { T ( x , y , t ) }
where T ( x , y , t ) denotes the daily mean temperature at grid point ( x , y ) on day t , and P e r c e n t 95 { T ( x , y , t ) } is the 95th percentile of daily mean temperatures at that location during the historical period for calendar day t (e.g., 1 July of each year). The second criterion is expressed as follows [14]:
A ( x , y , t ) = T ( x , y , t ) T ( x , y , t )
A ( x , y , t + i ) > 5 , i = 0,1 , , 4
where T ( x , y , t ) represents the climatological mean daily temperature for calendar day t (e.g., 1 July) at location ( x , y ) , computed over the historical reference period. If the temperature anomaly A ( x , y , t + i ) exceeds 5 °C for five consecutive days ( i = 0,1,2,3,4 ) starting on day t , then day t is marked as the occurrence of an intense heatwave event at ( x , y ) . Based on this criterion, the frequency and spatial distribution of intense heatwave onsets and their spatial distribution across all grid points can be further analyzed.

2.2. DES

We adopted the DES method that considers two regions to be synchronized if their event time difference falls within a permissible maximum delay window. The method dynamically adjusts the tolerance window based on the actual time differences between events, enabling a more precise identification of synchronized occurrences. Considering the potential lagged response of heatwave events, an appropriate maximum delay is applied in order to capture possible cross-regional propagation characteristics. Unlike the original DES approach that calculates synchronization strength, we retained all pairs of synchronized events and organized them into daily events for subsequent analysis. Specifically, the events are defined as follows [15]:
g r i d i , j ( t ) = 1 , if   t a , i , t b , j s . t . t a , i t b , j Δ t m a x 0 , otherwise
e v e n t s ( t ) = { g r i d 1 ( t ) , g r i d 2 ( t ) , , g r i d k ( t ) }
where g r i d i , j ( t ) is an indicator function that specifies whether the i -th and j -th grid location experiences synchronized heatwave events at time t . t a , i and t b , j is the occurrence time of the a -th and b -th heatwave events in grid i and j , respectively. Δ t m a x represents the dynamically adjusted tolerance window, set to 10 days in this study. E v e n t s ( t ) represents the set of all grid points with synchronized heatwave events on day t . k is the total number of such grid locations. This event set serves as the input for the FP-Growth algorithm to extract cross-regional association rules of heatwave events.

2.3. Association Rule Mining of Heatwave Events (FP-Growth)

FP-Growth is an efficient frequent itemset mining algorithm designed to avoid the generation of a large number of candidate sets by constructing a tree-based data structure of frequent events [16]. In this study, each record represents the set of grid cells where synchronized heatwaves occurred on a given day, and the daily data are transformed into a Boolean format (1 indicating the presence of a heatwave in the grid cell). The procedure is as follows:
  • Building the tree structure
First, the occurrence frequency of each grid cell with heatwaves is counted across all records, and grid cells exceeding the minimum support threshold are selected as frequent events. For each record, only these frequent events are retained and inserted into the FP-Tree in descending order of their global frequencies. The FP-Tree, a type of prefix tree, efficiently compresses common patterns across multiple records and maintains the structural relationships of event occurrences through linked nodes.
2.
Recursive pattern growth
For each frequent event, a conditional pattern base and corresponding conditional FP-Tree are constructed to recursively mine all event combinations that meet the threshold.
3.
The resulting frequent itemsets are used to generate association rules, with support and confidence calculated as follows:
S u p p o r t ( g r i d i , g r i d j ) = C o u n t ( g r i d i g r i d j ) N
C o n f i d e n c e ( g r i d i g r i d j ) = C o u n t ( g r i d i g r i d j ) C o u n t ( g r i d i )
where S u p p o r t represents the proportion of days both g r i d i and g r i d j experience heatwaves, C o n f i d e n c e indicates the conditional probability of g r i d j having a heatwave given that g r i d i does, C o u n t denotes the total number of days, ( g r i d i g r i d j ) is the intersection of heatwave occurrences in g r i d i and g r i d j , and N is the total number of days considered.

3. Results

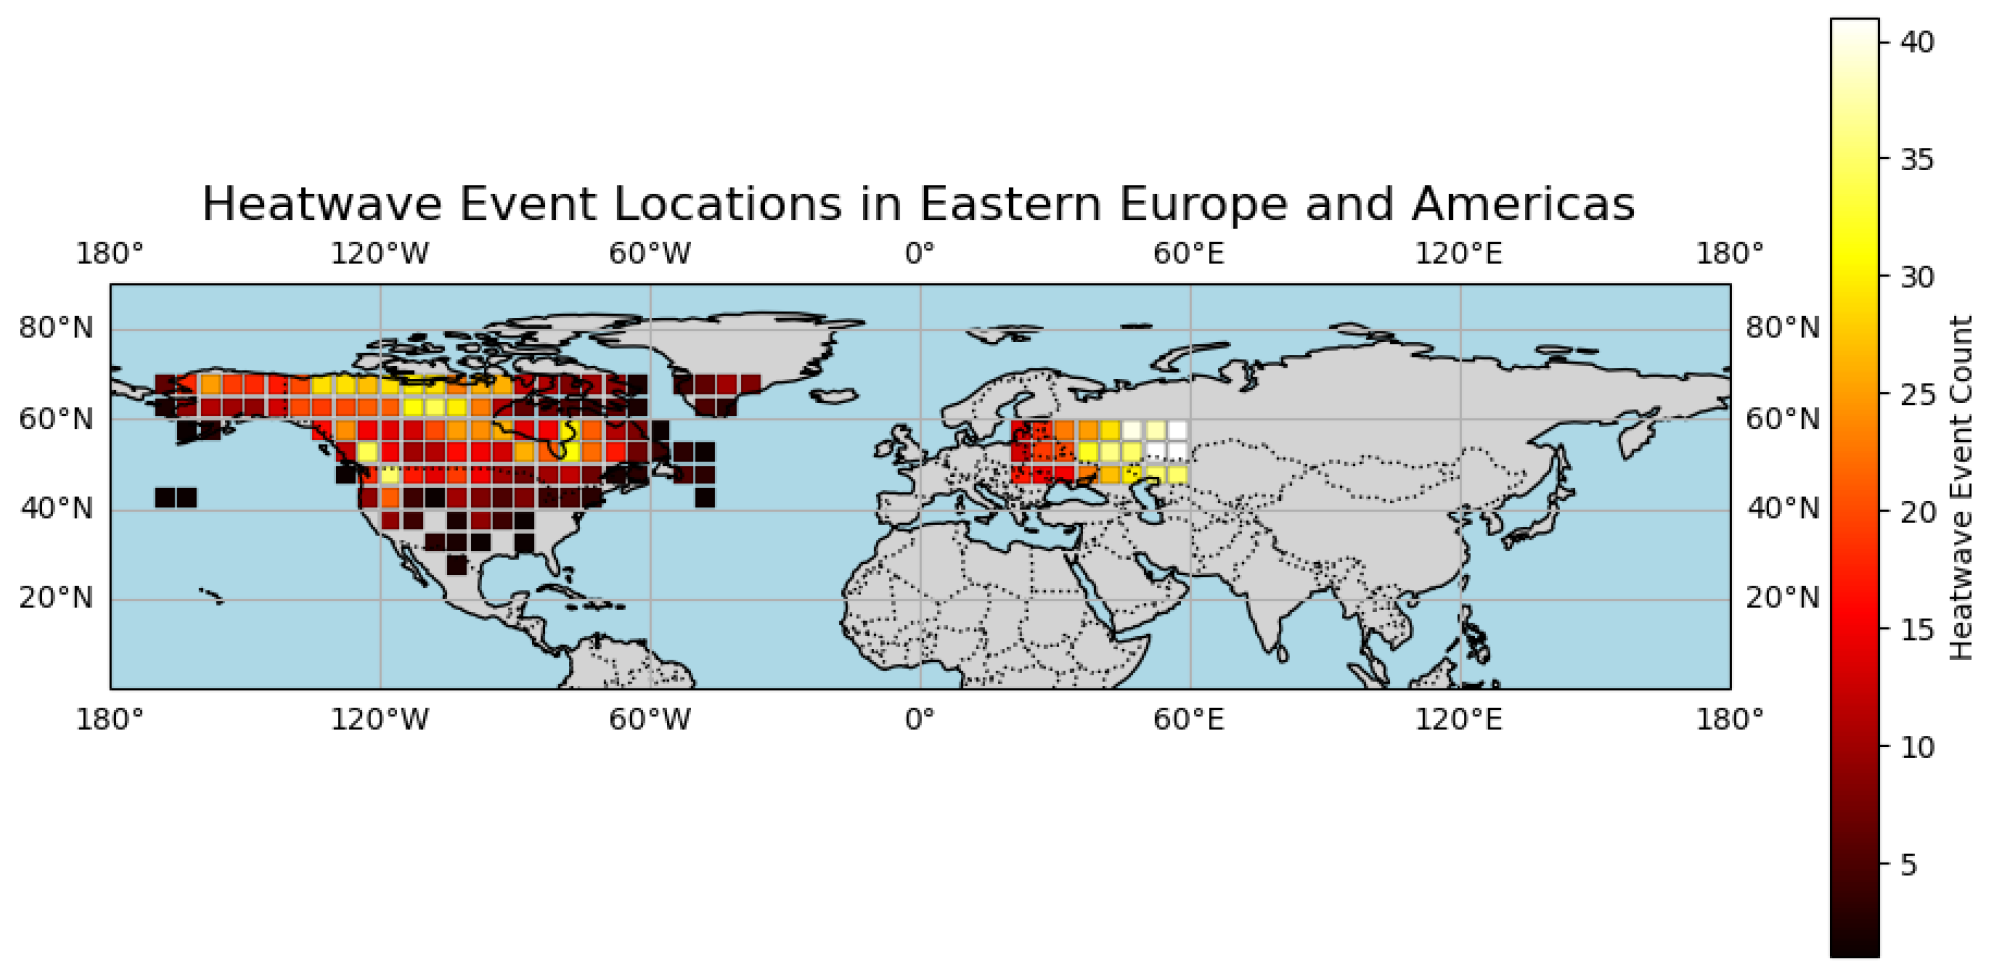
We used ECMWF Reanalysis version 5 (ERA5) hourly temperature reanalysis data (summer, 1965–2024) for the Northern Hemisphere (20–80° N). The original 0.25° resolution data were resampled to a 5° × 5° grid, and the daily maximum temperature was extracted to focus on large-scale heatwaves and improve computational efficiency [17,18]. Figure 1 illustrates the spatial distribution of strong heatwave event onset days, identifying hotspot regions such as Eastern Europe and North America as the basis for subsequent analyses of heatwave propagation.
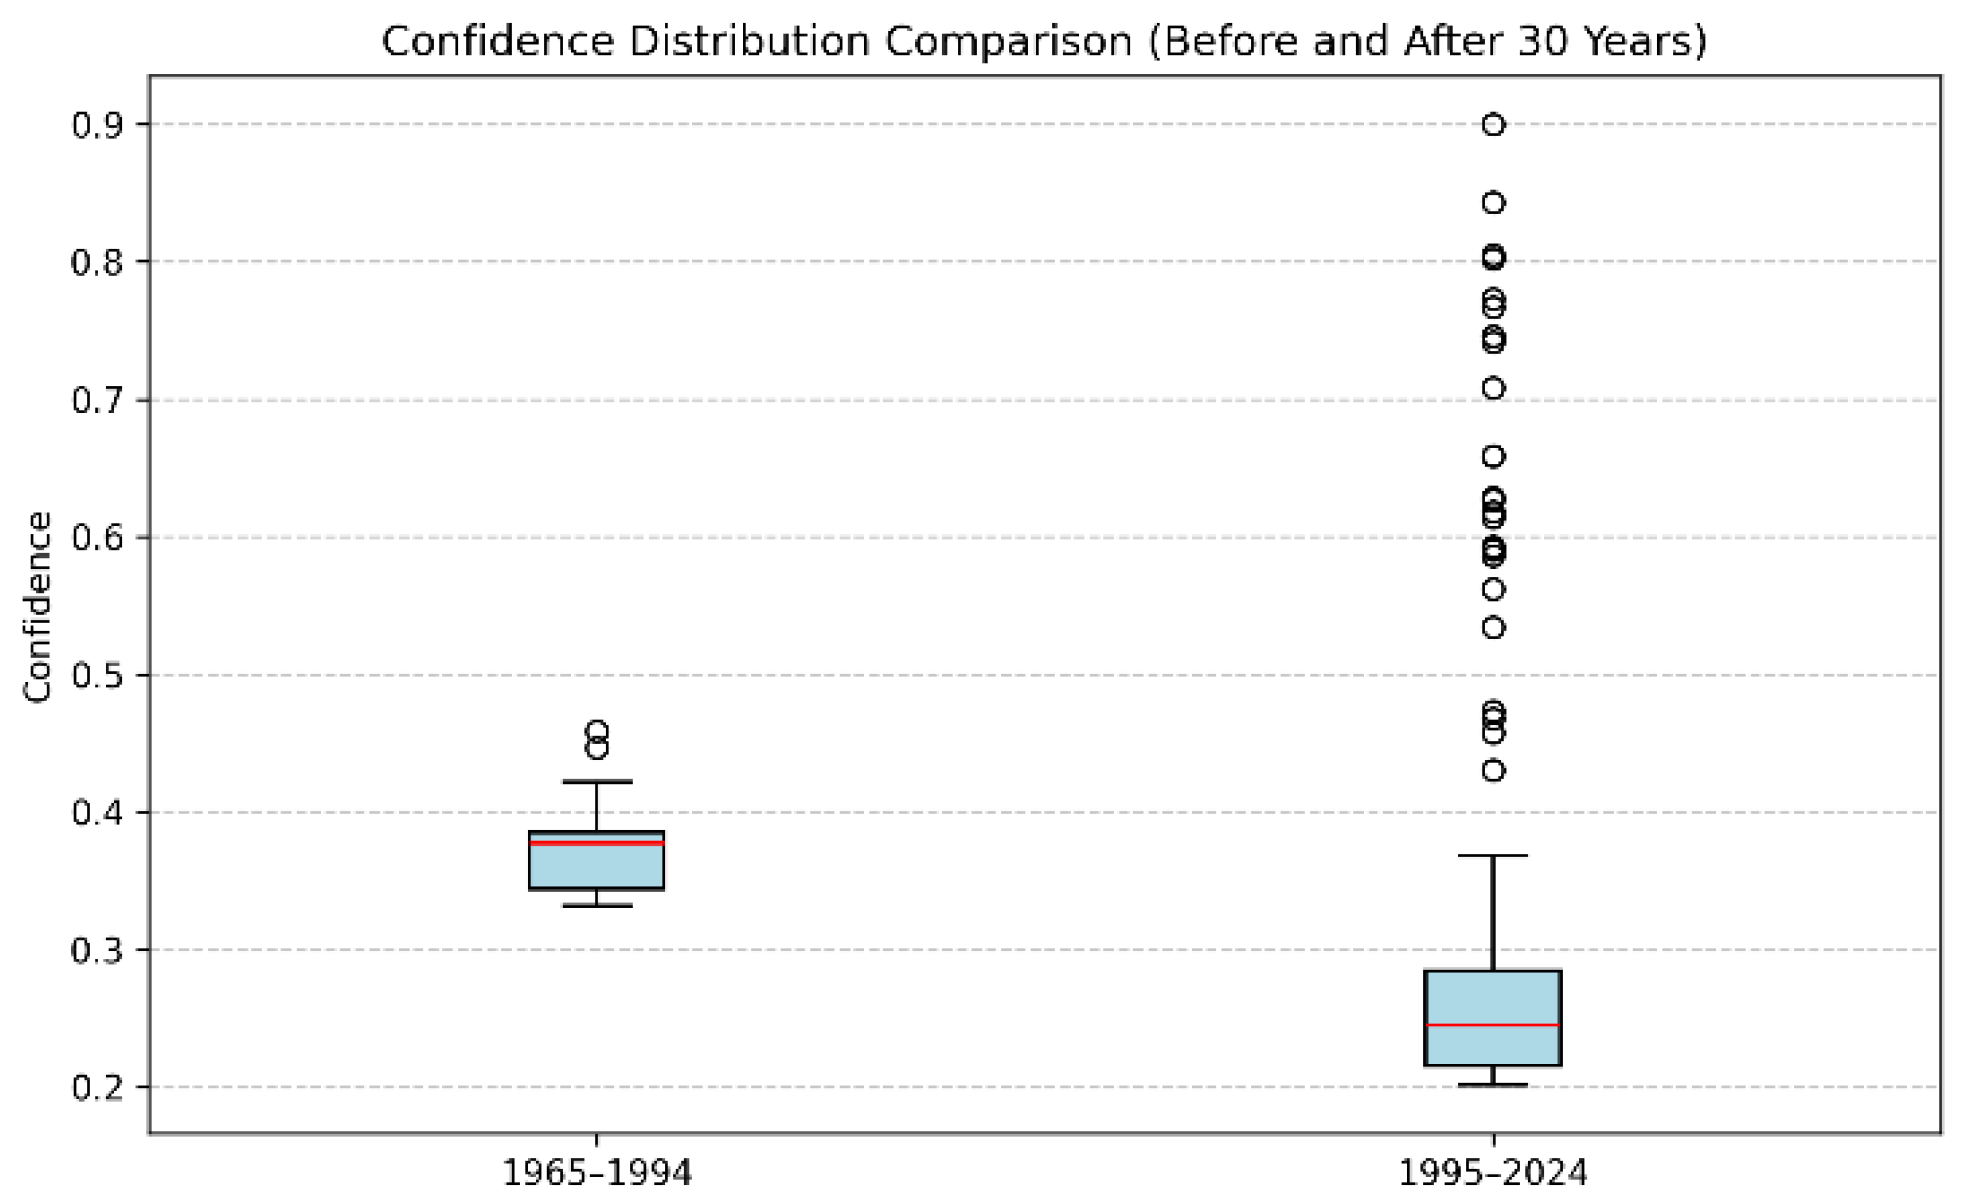
After applying the DES method, heatwave events were transformed into daily event data, and the FP-Growth algorithm was used to mine cross-regional association rules. The minimum support and confidence thresholds were set at 0.03 and 0.2, respectively, to preserve more potential propagation patterns. The analysis focused on heatwave onset hotspots in Eastern Europe and North America, with the dataset divided into two periods (1965–1994 and 1995–2024) to examine temporal changes in the spatial extent of heatwaves. Figure 2 shows the confidence distribution when 52.625° N, 57.375° E is used as the heatwave onset point. Our results indicate that during the earlier period, the confidence distribution had a higher median and smaller overall variability. In contrast, the later period exhibited a lower median, yet displayed a pronounced increase in high-confidence outliers, indicating that heatwave propagation patterns have become more spatially dispersed, which may be attributable to climate change.

3.1. Eastern Europe

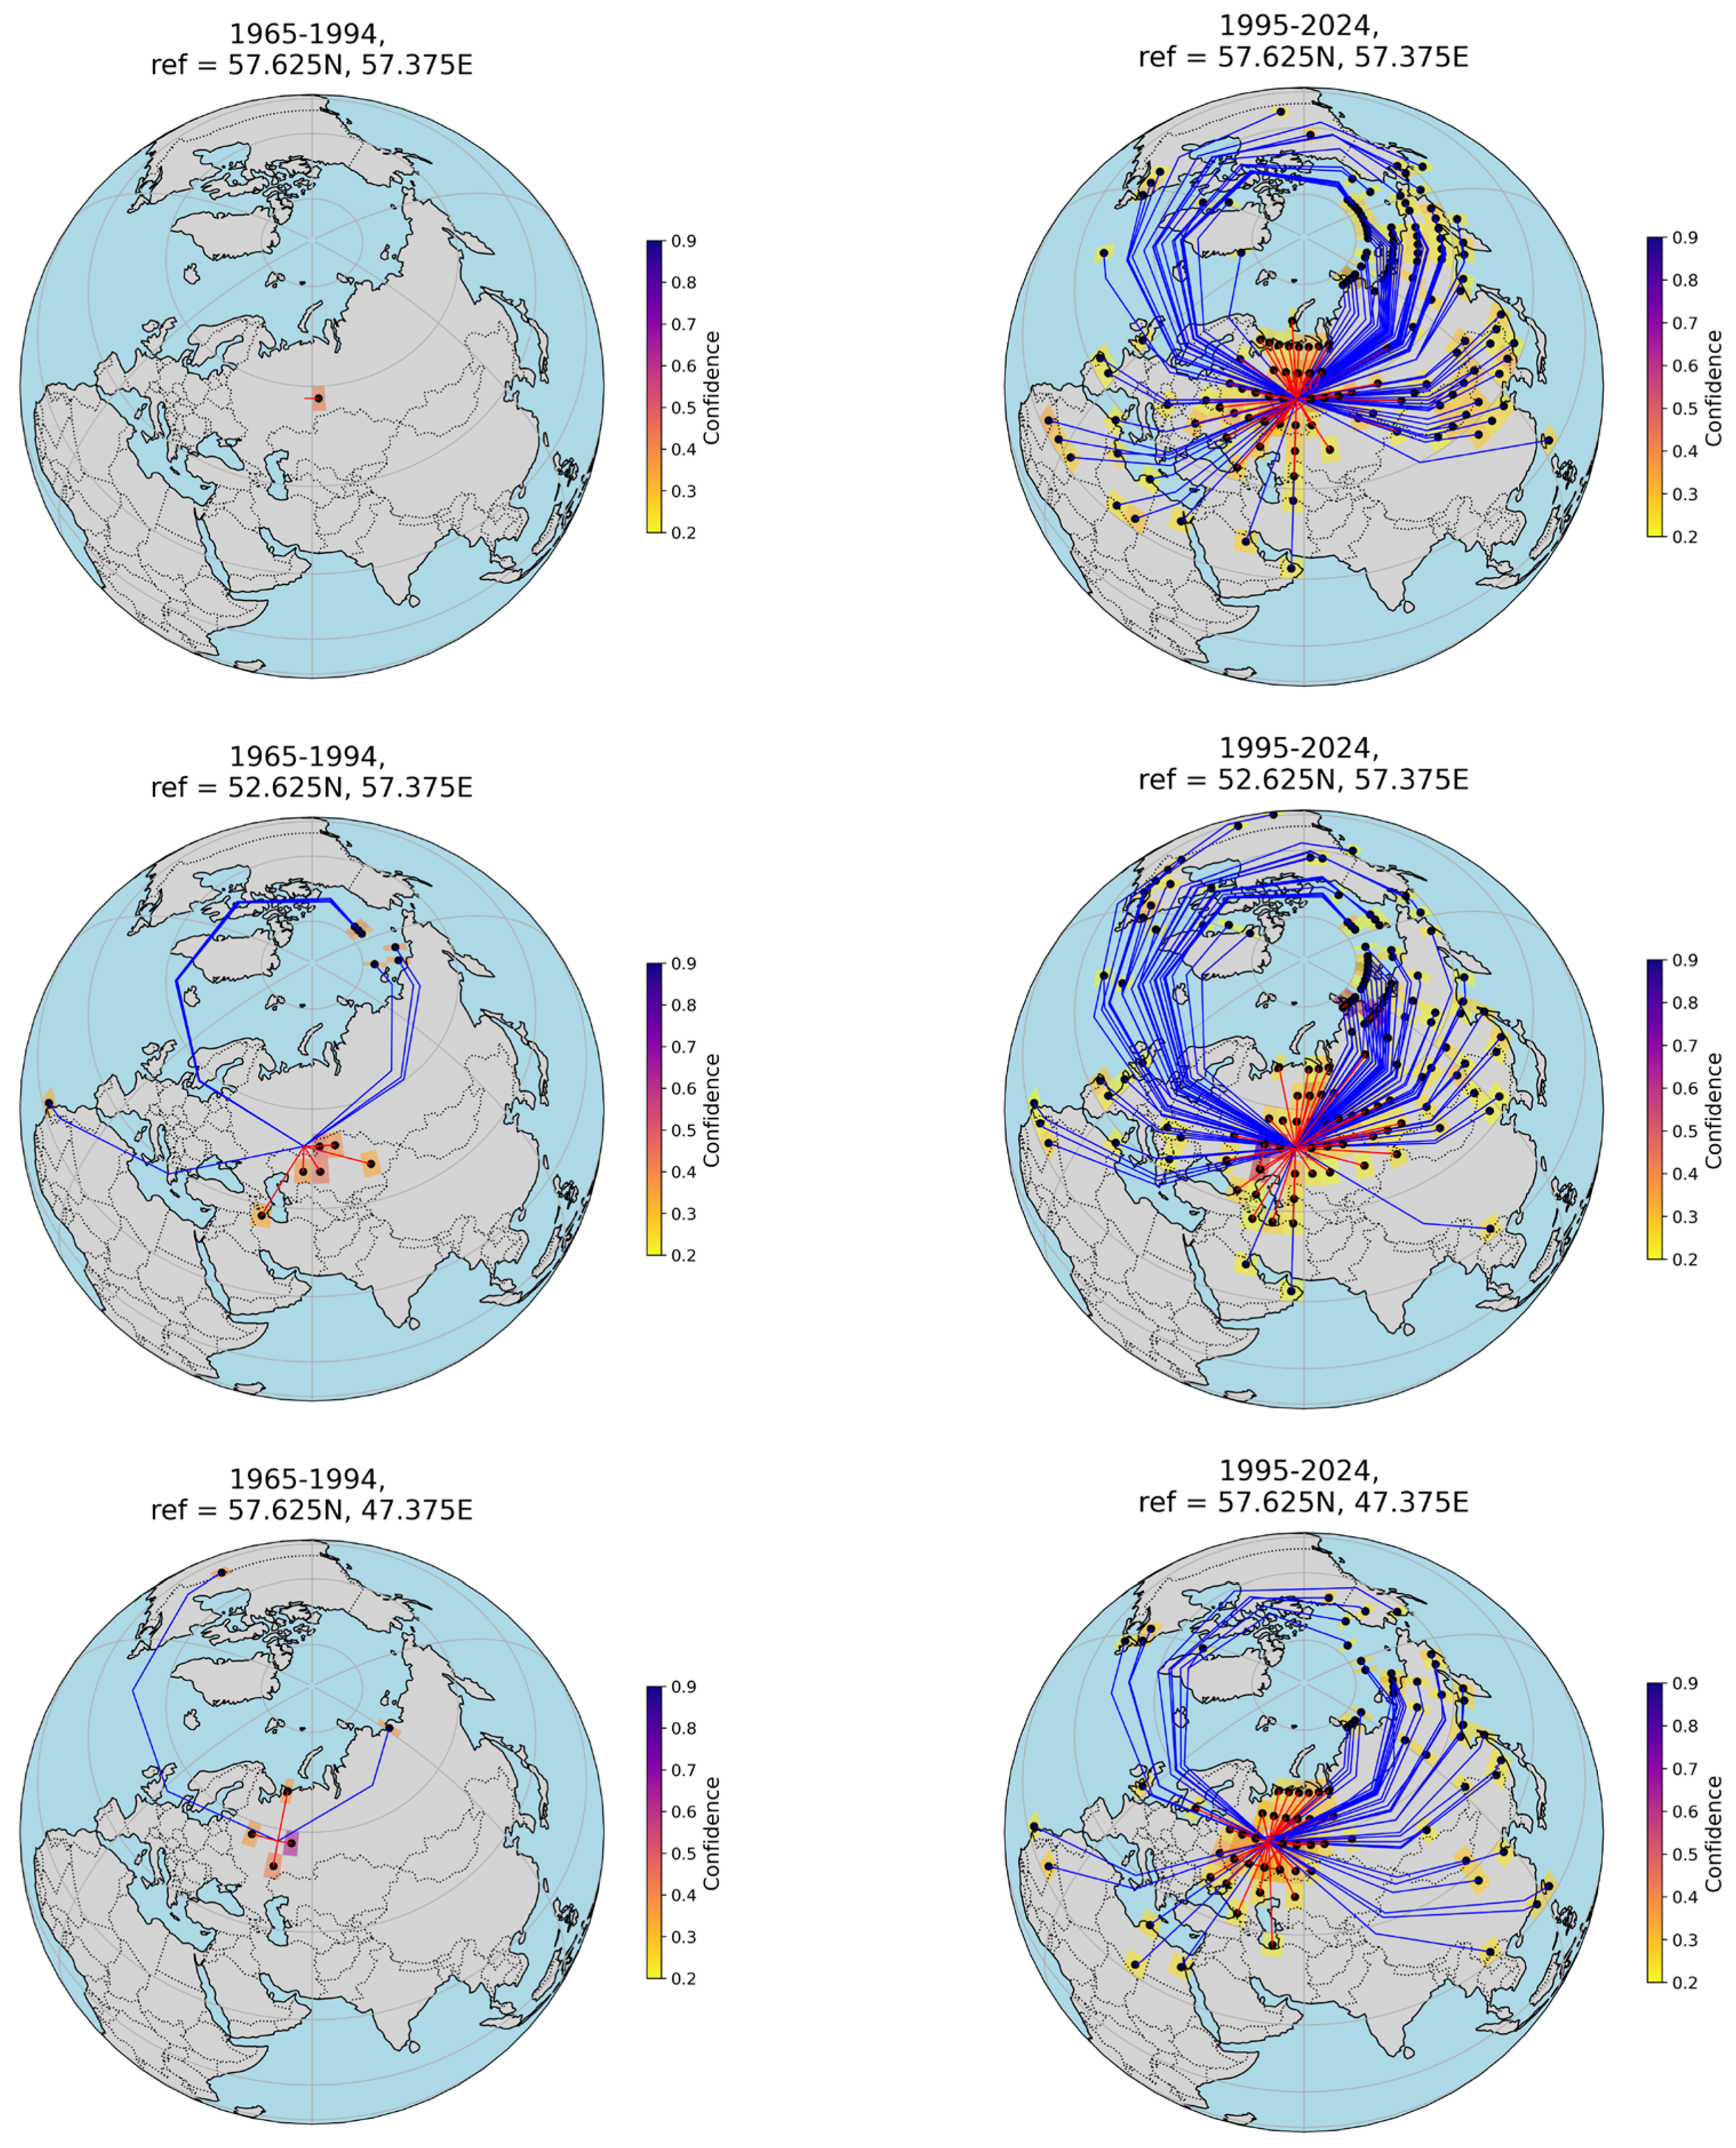
Based on the statistics of three major heatwave initiation points in Eastern Europe, heatwaves in the earlier period were mostly confined to neighboring regions, with a limited number of associations. In contrast, the later period shows a significant expansion of heatwave propagation, covering vast areas and exhibiting long-distance transmission. The propagation extends eastward to Siberia and the Far East, northward to the Arctic coastline, and spans across Eurasia to include Canada, Greenland, and the Mediterranean region. Figure 3 illustrates the heatwave propagation paths and confidence distributions, further confirming this expansion trend. This phenomenon suggests that synchronous heatwave events may be influenced by larger-scale climate mechanisms, such as global warming, with the increase in confidence values further supporting this conclusion.

3.2. North America

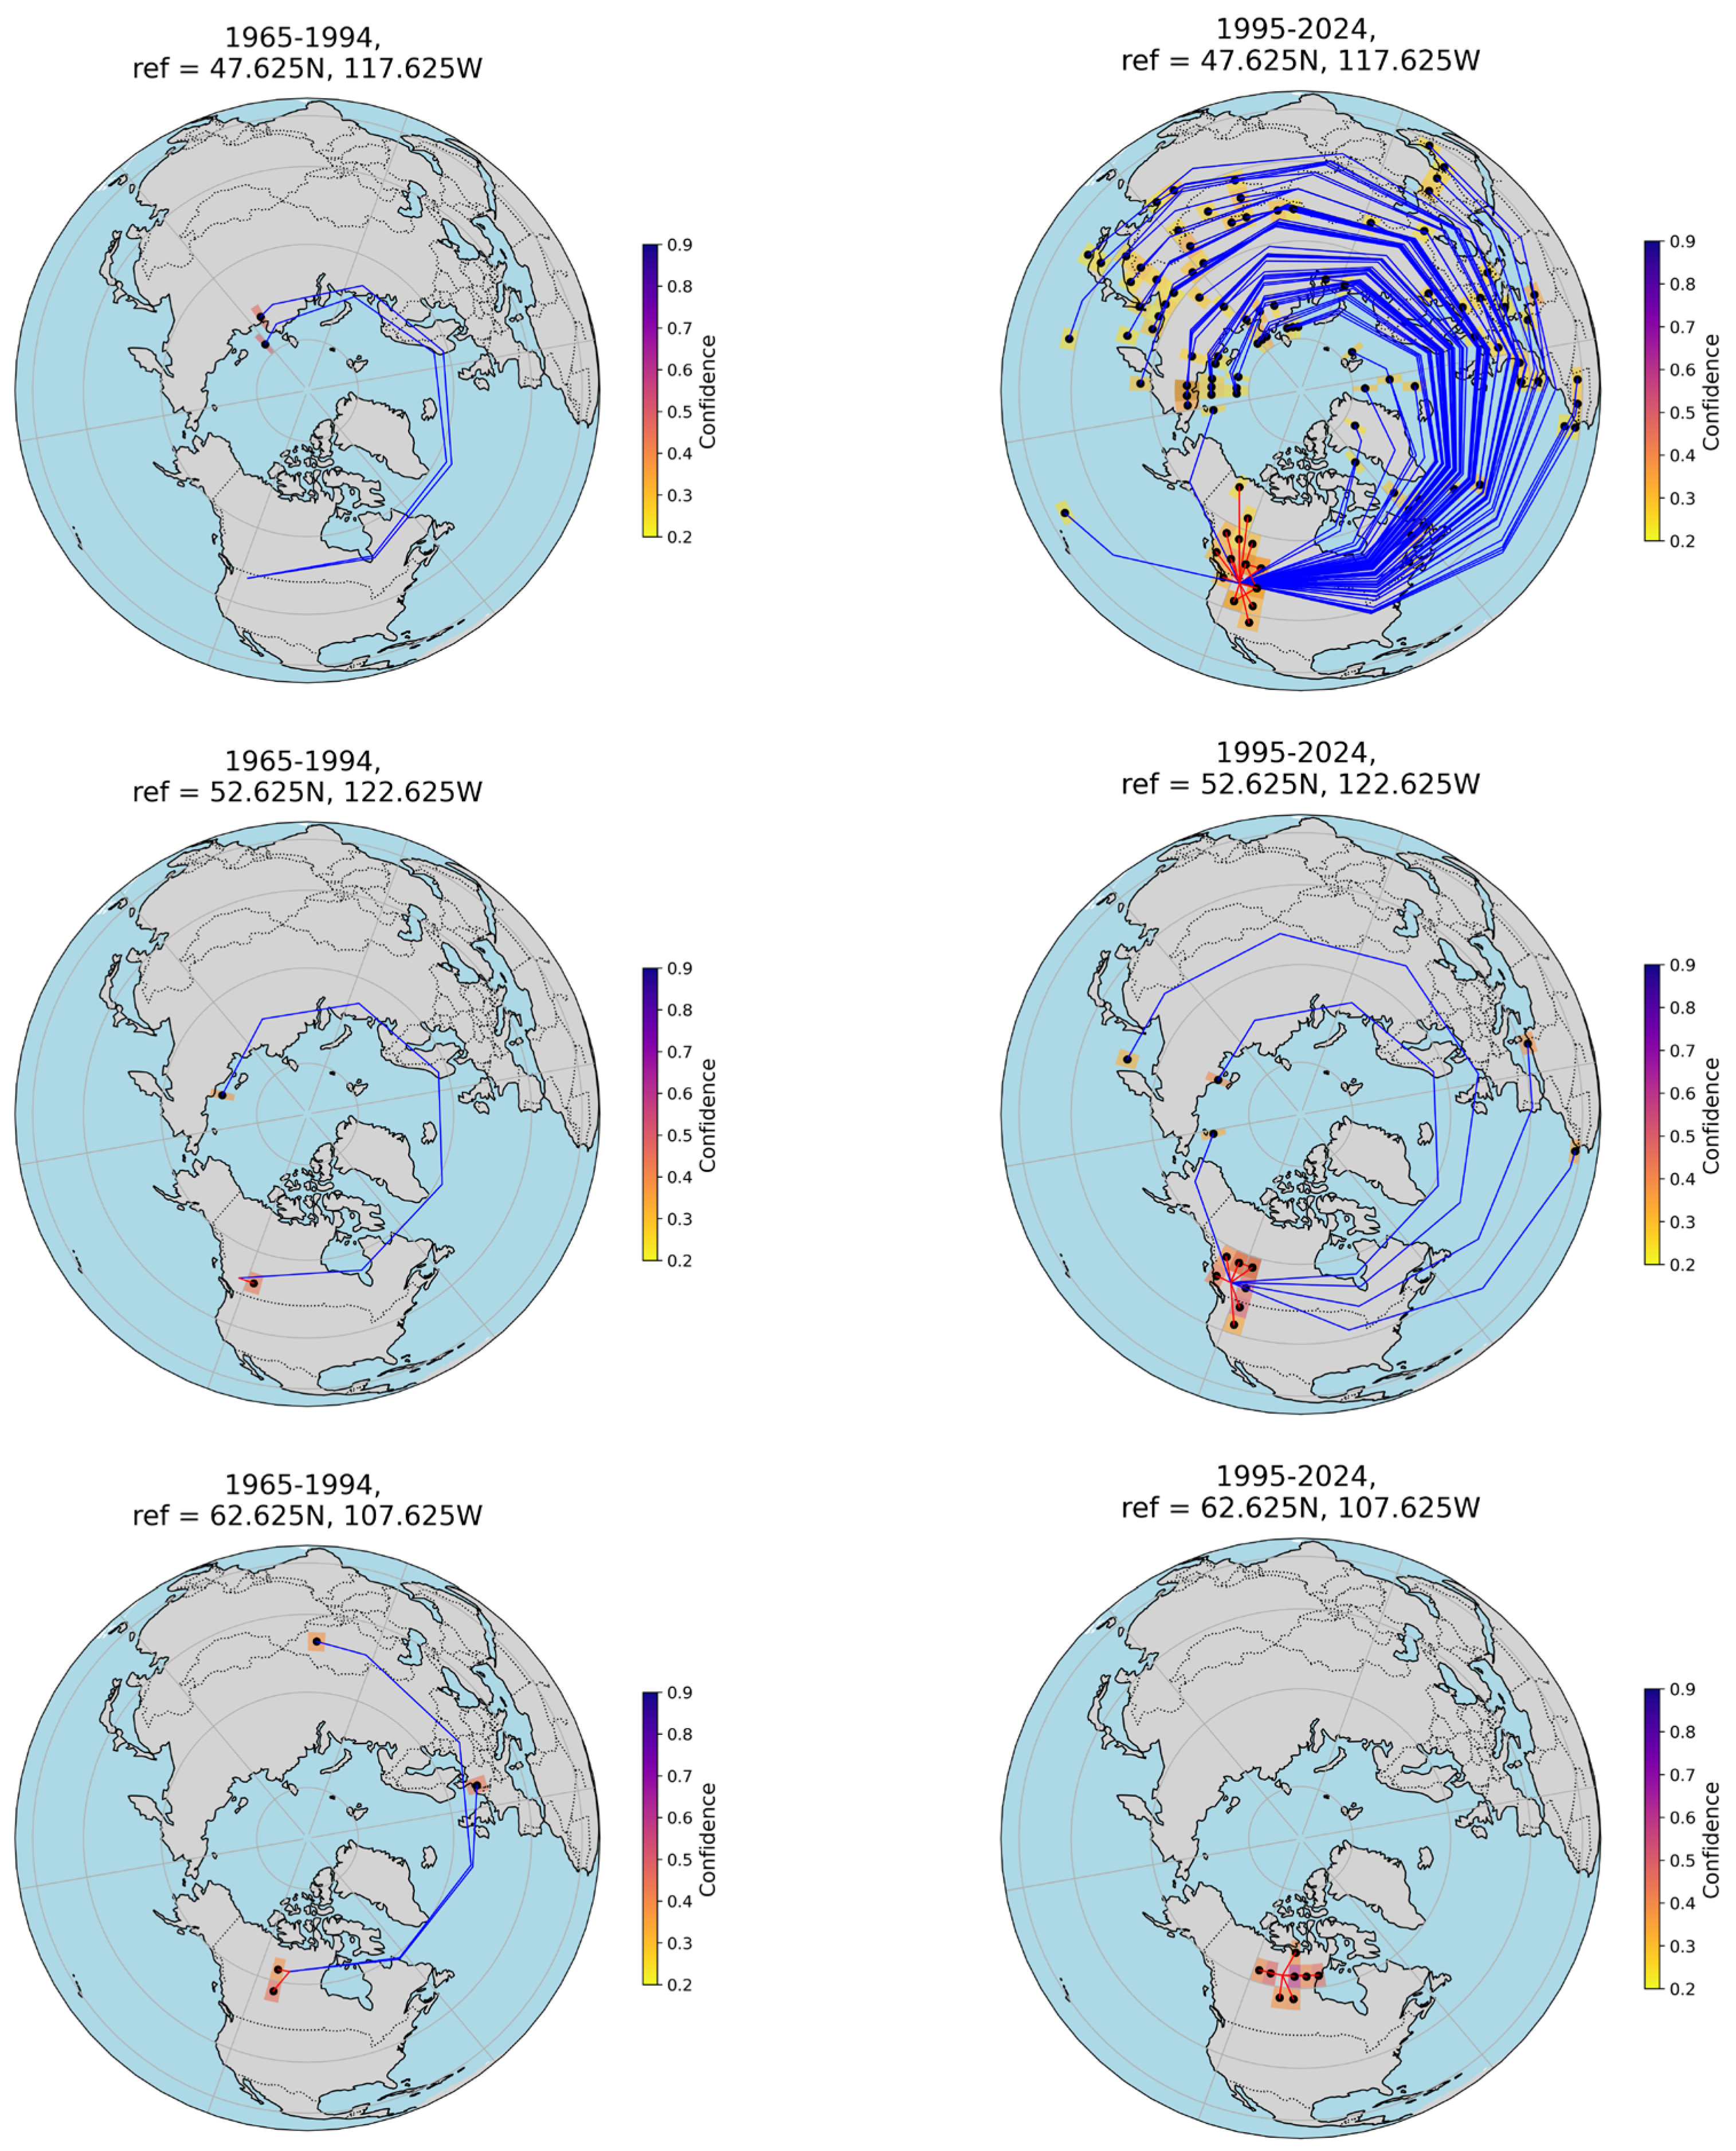
Based on the statistics of three major heatwave initiation points in North America, heatwaves in the earlier period were mostly confined to nearby regions, with fewer associations. In the later period, the propagation range expanded to include central North America, eastern Canada, and the Arctic. The transmission extended northward to the Arctic and southeastward to central Canada. Figure 4 illustrates the heatwave propagation paths and confidence distributions, further confirming this expansion trend. These results indicate that climate warming may be amplifying the impacts of heatwaves.

4. Discussion and Conclusions

We integrated DES with association rule mining (FP-Growth) to analyze the transregional propagation characteristics of summer heatwave events across the Northern Hemisphere during 1965–2024. The data were divided into an earlier period (1965–1994) and a later period (1995–2024), focusing on three major heatwave initiation points in Eastern Europe and North America for comparative analysis.
The results showed that the number of heatwave association rules in the later period increased by 198.4% compared with that of the earlier period. The proportion of long-distance associations rose by 8%, while short-distance associations decreased by 34%, indicating a shift from regional propagation patterns to more extensive transcontinental synchronization. This change reflects the enhanced large-scale climatic connectivity, likely driven by climate variability associated with global warming.
In the later period, heatwave initiation points in Eastern Europe exhibited propagation paths spanning Eurasia to the Arctic. Similarly, initiation points in North America expanded from being confined to surrounding regions to reaching central Canada and the Arctic. These findings suggest that the range and stability of synchronized heatwave events have simultaneously expanded.
Overall, heatwave events are no longer confined to local regions but exhibit broader and more stable transregional propagation patterns.

Author Contributions

Conceptualization, J.-C.H. and C.-C.H.; methodology, J.-C.H. and C.-C.H.; software, Y.-K.Y.; supervision, J.-C.H. and C.-C.H. All authors have read and agreed to the published version of the manuscript.

Funding

This research was supported by the National Science and Technology Council (Project number NSTC 113-2625-M-845-002, NSTC 114-2625-M-845-002, NSTC 114-2625-M-845-003, NSTC 114-2111-M-003-007.)

Institutional Review Board Statement

Not applicable.

Informed Consent Statement

Not applicable.

Data Availability Statement

Publicly available datasets were analyzed in this study. The ERA5 data can be found at the Copernicus Climate Change Service (C3S) Climate Data Store (https://cds.climate.copernicus.eu/), accessed on 25 January 2026.

Acknowledgments

The author is grateful to the anonymous referees, whose constructive and helpful comments led to significant improvements in the manuscript.

Conflicts of Interest

The authors declare no conflict of interest.

References

  1. IPCC. Climate Change 2021: The Physical Science Basis; IPCC: Geneva, Switzerland, 2021.
  2. Rogers, C.D.; Kornhuber, K.; Perkins-Kirkpatrick, S.E.; Loikith, P.C.; Singh, D. Sixfold Increase in Historical Northern Hemisphere Concurrent Large Heatwaves Driven by Warming and Changing Atmospheric Circulations. J. Clim. 2022, 35, 1063–1078. [Google Scholar] [CrossRef]
  3. Wolf, F.; Donner, R.V.; Wolf, F.; Donner, R.V. Spatial organization of connectivity in functional climate networks describing event synchrony of heavy precipitation. Eur. Phys. J. Spec. Top. 2021, 230, 3045–3063. [Google Scholar] [CrossRef]
  4. Odenweller, A.; Donner, R.V. Disentangling synchrony from serial dependency in paired-event time series. Phys. Rev. E 2020, 101, 052213. [Google Scholar] [CrossRef] [PubMed]
  5. Quiroga, R.Q.; Kreuz, T.; Grassberger, P. Event synchronization: A simple and fast method to measure synchronicity and time delay patterns. Phys. Rev. E 2002, 66, 041904. [Google Scholar] [CrossRef] [PubMed]
  6. Tang, Y.; Luo, M.; Wu, S.; Li, X. Increasing Synchrony of Extreme Heat and Precipitation Events Under Climate Warming. Geophys. Res. Lett. 2025, 52, e2024GL113021. [Google Scholar] [CrossRef]
  7. Zscheischler, J.; Martius, O.; Westra, S.; Bevacqua, E.; Raymond, C.; Horton, R.M.; van den Hurk, B.; AghaKouchak, A.; Jézéquel, A.; Mahecha, M.D.; et al. A typology of compound weather and climate events. Nat. Rev. Earth Environ. 2020, 1, 333–347. [Google Scholar] [CrossRef]
  8. Blanchet, J.; Creutin, J.-D. Co-Occurrence of Extreme Daily Rainfall in the French Mediterranean Region. Water Resour. Res. 2017, 53, 9330–9349. [Google Scholar] [CrossRef]
  9. Li, Y.; Luo, X.; Wang, M.; Di, B.; Li, Y.; Tan, C.; Pan, Y. Spatiotemporal variations and influencing factors of heatwaves in Chengdu, China. Ecol. Inform. 2024, 84, 102924. [Google Scholar] [CrossRef]
  10. Boers, N.; Goswami, B.; Rheinwalt, A.; Bookhagen, B.; Hoskins, B.; Kurths, J.; Boers, N.; Goswami, B.; Rheinwalt, A.; Bookhagen, B.; et al. Complex networks reveal global pattern of extreme-rainfall teleconnections. Nature 2019, 566, 373–377. [Google Scholar] [CrossRef] [PubMed]
  11. Cai, F.; Chen, J.; Chen, T.; Zhang, B.; Fan, W. Mining significant local spatial association rules for multi-category point data. Heliyon 2024, 10, e25047. [Google Scholar] [CrossRef] [PubMed]
  12. Rashid, R.A.; Nohuddin, P.N.E.; Zainol, Z. Association Rule Mining Using Time Series Data for Malaysia Climate variability prediction. In Proceedings of the International Visual Informatics Conference, Bangi, Malaysia, 28–30 November 2017. [Google Scholar]
  13. Kueh, M.-T.; Lin, C.-Y.; Chuang, Y.-J.; Sheng, Y.-F.; Chien, Y.-Y. Climate variability of heat waves and their associated diurnal temperature range variations in Taiwan. Environ. Res. Lett. 2017, 12, 074017. [Google Scholar] [CrossRef]
  14. Awasthi, A.; Vishwakarma, K.; Pattnayak, K.C. Retrospection of heatwave and heat index. Theor. Appl. Clim. 2021, 147, 589–604. [Google Scholar] [CrossRef] [PubMed]
  15. Su, Z.; Meyerhenke, H.; Kurths, J. The climatic interdependence of extreme-rainfall events around the globe. Chaos Interdiscip. J. Nonlinear Sci. 2022, 32, 043126. [Google Scholar] [CrossRef] [PubMed]
  16. Han, J.; Pei, J.; Yin, Y. Mining frequent patterns without candidate generation. ACM SIGMOD Rec. 2000, 29, 1–12. [Google Scholar] [CrossRef]
  17. Gough, W.A.; Žaknić-Ćatović, A.; Zajch, A. Sampling frequency of climate data for the determination of daily temperature and daily temperature extrema. Int. J. Clim. 2020, 40, 5451–5463. [Google Scholar] [CrossRef]
  18. Hersbach, H.B.; Berrisford, P.; Biavati, G.; Horányi, A.; Muñoz Sabater, J.; Nicolas, J.; Peubey, C.; Radu, R.; Rozum, I.; Schepers, D.; et al. ERA5 Hourly Data on Pressure Levels from 1940 to Present; Copernicus Climate Change Service (C3S) Climate Data Store (CDS): Online, 2023. [Google Scholar]
Figure 1. Heatwave event locations in Eastern Europe and North America.
Engproc 120 00018 g001
Figure 2. Confidence distribution comparison (before and after 30 years).
Engproc 120 00018 g002
Figure 3. Data from Eastern Europe Heatwave Associations from 1965–1994 to 1995–2024.
Engproc 120 00018 g003
Figure 4. Data from North America Heatwave Associations from 1965–1994 to 1995–2024.
Engproc 120 00018 g004
Disclaimer/Publisher’s Note: The statements, opinions and data contained in all publications are solely those of the individual author(s) and contributor(s) and not of MDPI and/or the editor(s). MDPI and/or the editor(s) disclaim responsibility for any injury to people or property resulting from any ideas, methods, instructions or products referred to in the content.