1. Introduction
The increasing integration of Distributed Generation (DG) into medium-voltage distribution networks has introduced both opportunities and operational challenges. In many regulatory frameworks, active power (P) from DG units enjoys priority dispatch, with limited or no requirements for reactive power (Q) support. This practice, while beneficial for maximizing energy yield from renewable sources, can lead to voltage profile violations, especially in long radial feeders or weak networks. Such violations often result in a curtailment of active power output, reducing the economic attractiveness of DG investments. In countries such as Ecuador, for instance, current regulations permit DG units of up to 1 MW to operate with priority active power dispatch, but without mandatory Q support, potentially exacerbating overvoltage or undervoltage issues depending on the connection point.
The academic literature has addressed voltage control in distribution networks from various perspectives, including optimal power flow (OPF) formulations that incorporate Q dispatch from DG to maintain voltages within permissible limits [
1,
2]. Several studies have demonstrated that reactive power capability can be leveraged to improve hosting capacity and minimize curtailment [
3,
4]. Other works focus on coordinated voltage control strategies involving DG, capacitor banks, and on-load tap changers [
5,
6]. However, the majority of existing approaches either assume continuous Q availability or address multi-phase unbalanced models, leaving a gap in the simplified yet insightful analysis of how targeted Q dispatch impacts voltage compliance in radial feeders under fixed P injection constraints.
Recent research has further analyzed voltage regulation in active distribution networks, emphasizing the role of coordinated control strategies that combine distributed generators, capacitor banks, and on-load tap changers [
3,
5]. Other works have explored optimal reactive power dispatch from PV inverters to enhance hosting capacity and maintain voltage profiles within permissible limits [
1,
4]. Despite these advances, there remains a lack of benchmark studies that isolate the intrinsic contribution of DG reactive flexibility under passive feeder conditions. This work aims to fill that gap by quantifying the minimum reactive capability required to maintain voltage compliance and maximize active power injection without relying on external voltage support devices.
This study addresses the problem of maximizing the active power injection from DG units—fixed at their nominal 1 MW output—while ensuring that all bus voltages remain within standard operational limits (0.95–1.05 pu) by allowing the controlled injection or absorption of reactive power. The hypothesis is that enabling Q support within the DG’s apparent power limit can significantly increase the number of feasible connection points for full P dispatch, while minimizing unnecessary Q exchange.
To investigate this, the IEEE 34-Node Test Feeder was adapted into a simplified single-phase equivalent model, focusing on phase A and excluding voltage regulators, shunt capacitors, and step-down transformers, thus representing a typical radial distribution feeder. An OPF model was formulated in Pyomo (Version 6.5, Sandia National Laboratories, Albuquerque, NM, USA) and solved using IPOPT (Version 3.14.5, COIN-OR Foundation, Pittsburgh, PA, USA), incorporating active and reactive power generation limits, voltage magnitude bounds, power flow equations, and apparent power constraints. Two scenarios were analyzed: (i) DG injecting only P with Q fixed at zero, and (ii) DG injecting P and optimally dispatching Q within MVAr.
Unlike previous studies that combine distributed generators with external voltage control devices or stochastic scenarios, this work deliberately isolates the sole contribution of DG reactive power flexibility under passive feeder conditions. This approach provides a benchmark to quantify the minimum reactive capability required to maintain voltage compliance and maximize active power injection without network reinforcement.
Preliminary results indicate that allowing Q support from the DG improves the minimum bus voltages across the feeder, reduces the number of voltage violations, and expands the set of buses in which 1 MW can be injected without breaching operational limits. These findings highlight the potential of reactive power flexibility as a cost-effective measure to enhance the hosting capacity of distribution feeders without extensive infrastructure upgrades.
2. System Modeling
The test system employed in this study is based on the IEEE 34-Node Test Feeder, a benchmark radial distribution network widely used for validating power flow and optimization algorithms [
7,
8]. The original system operates at a nominal voltage of 24.9 kV and includes various devices such as voltage regulators, shunt capacitors, and a step-down transformer to a 4.16 kV section. For the purposes of this work, a simplified single-phase equivalent of the feeder was developed, focusing exclusively on phase A. This approach allows for a reduced computational burden while preserving the essential electrical characteristics of the feeder [
1].
Although the IEEE 34-node feeder is inherently unbalanced, the single-phase equivalent developed in this study reproduces the average voltage profile of phase A, which dominates the feeder’s behavior under balanced loading assumptions. The original IEEE dataset indicates moderate phase unbalance (approximately 2–4%), and several prior studies have shown that single-phase abstractions can adequately capture the qualitative effects of reactive power flexibility on voltage profiles. This approach thus provides a simplified yet representative framework for benchmarking OPF-based analyses, while future work will extend the methodology to full three-phase unbalanced models.
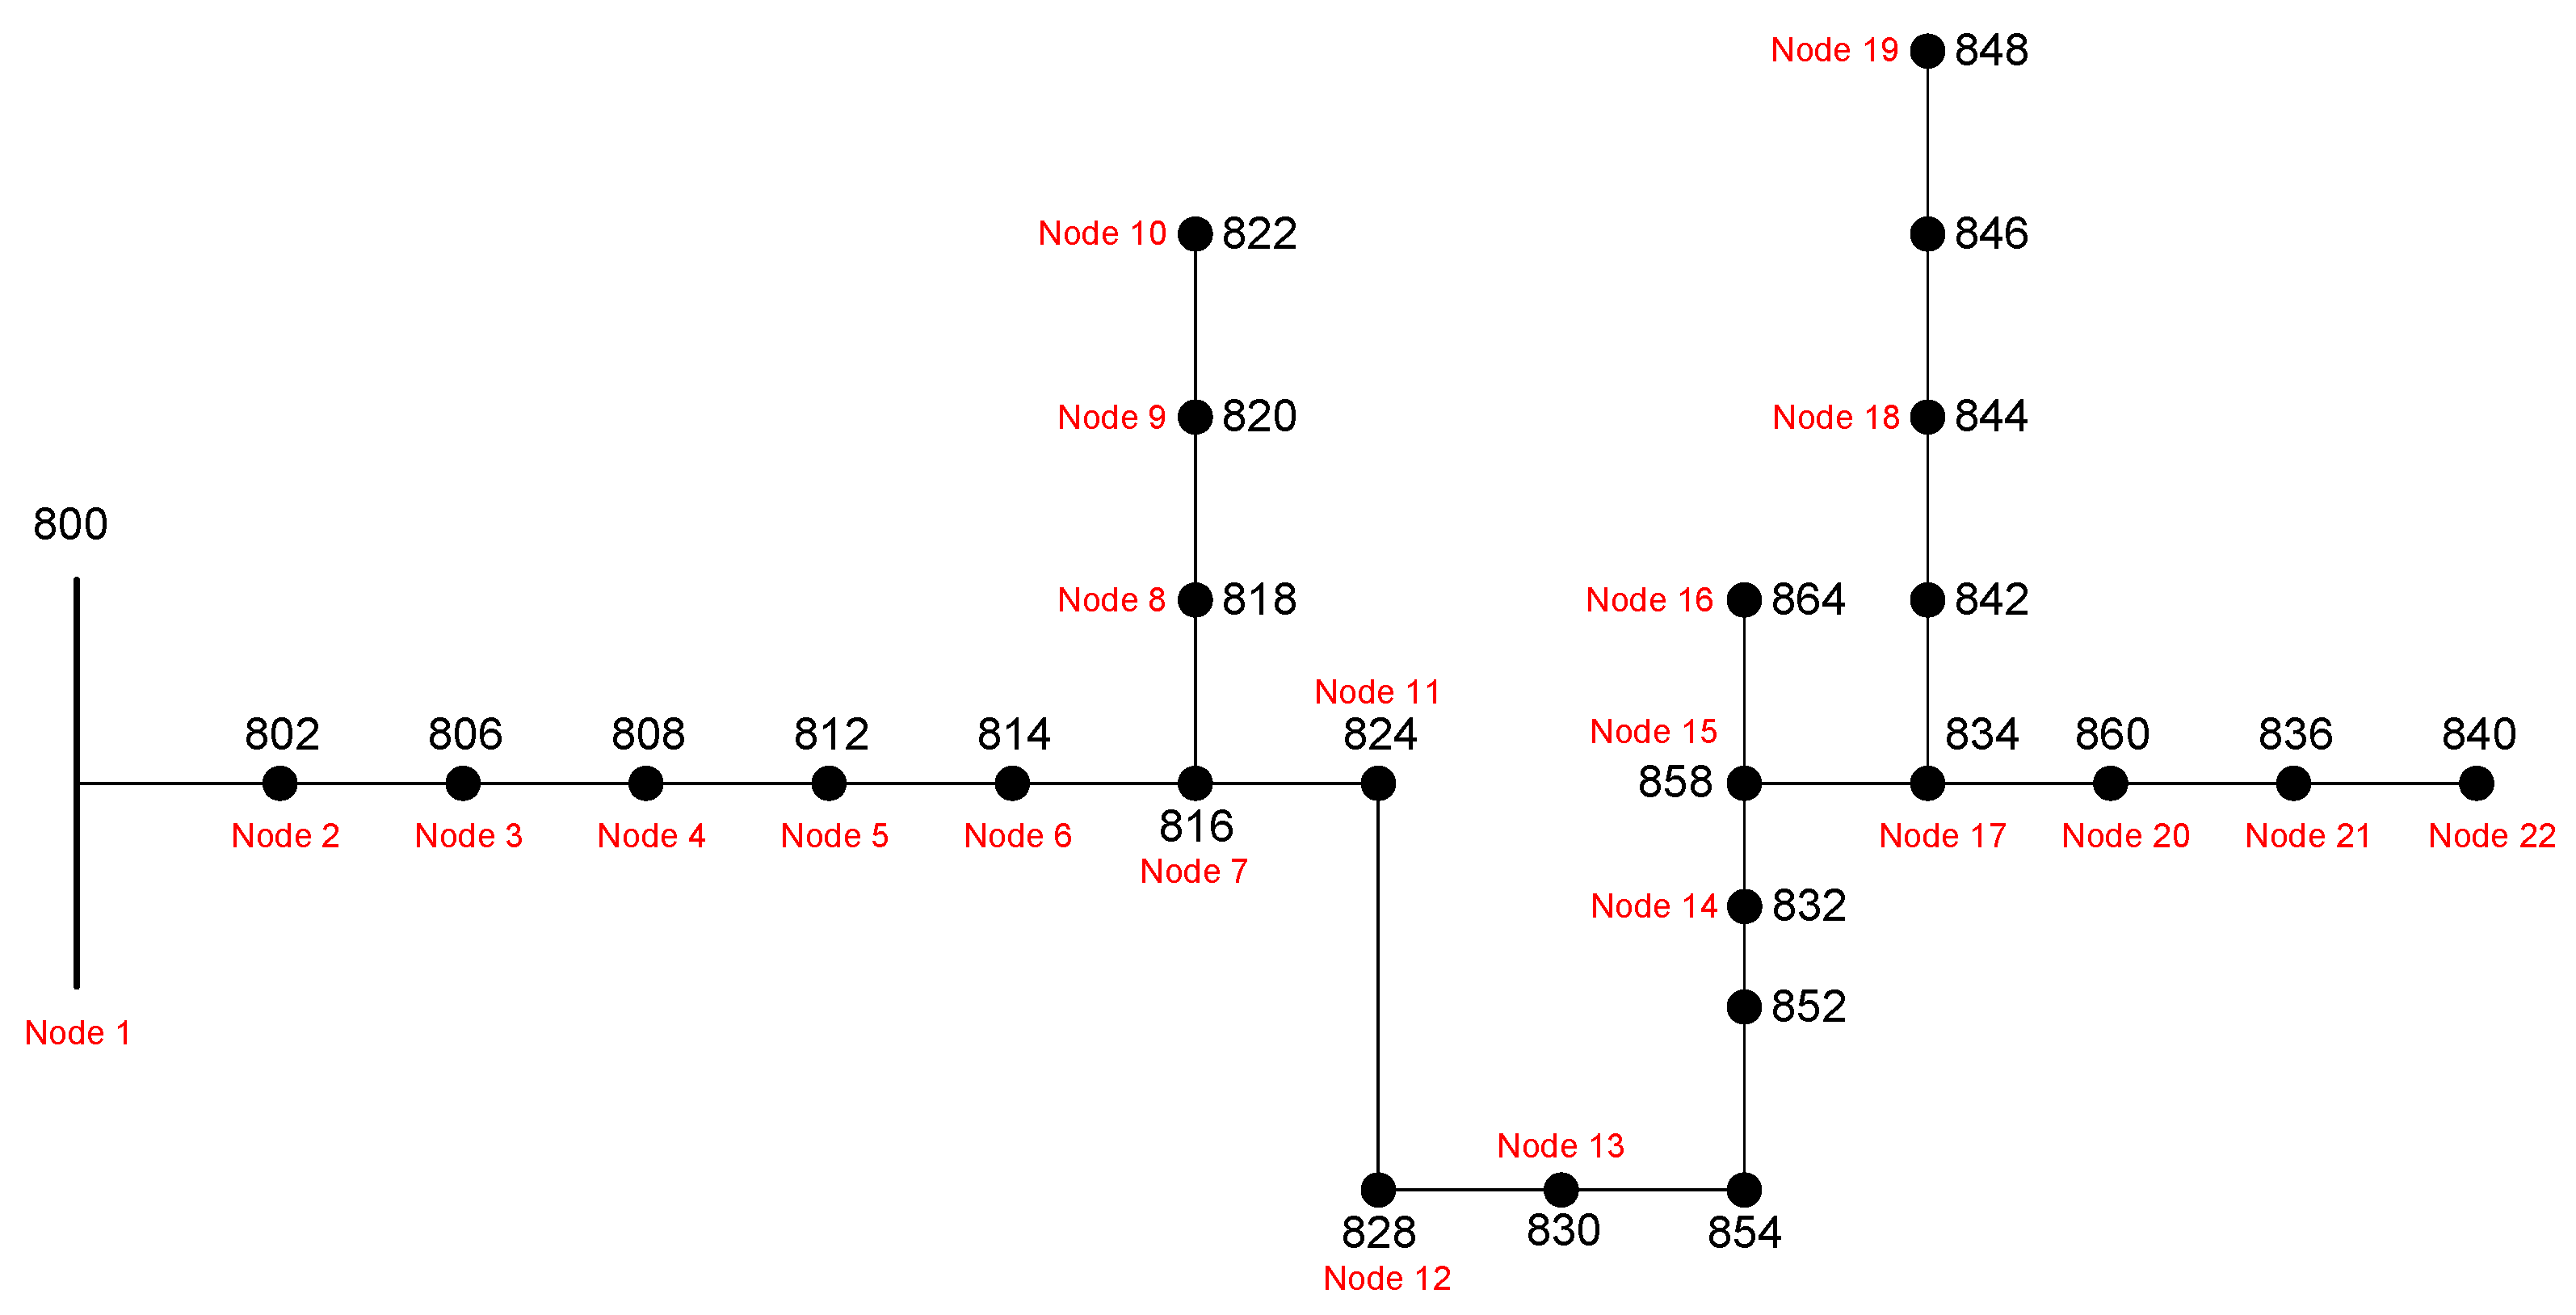
This simplification was intentionally adopted to isolate the intrinsic voltage–power coupling of the feeder under purely passive conditions, thus allowing a transparent analysis of the effect of DG reactive power flexibility. In practical feeders, voltage regulators and capacitor banks mitigate such effects, but their exclusion here provides a lower-bound estimate of voltage compliance, representing a conservative hosting-capacity benchmark. Future work will extend the model to reintroduce these devices and evaluate coordinated Volt/VAR control strategies under realistic operating conditions. The resulting topology is shown in
Figure 1, where the node numbering follows the IEEE standard but only the phase A connections are represented.
Line parameters were derived from the conductor configuration data provided in the IEEE dataset [
8]. The positive-sequence resistance and reactance per mile for each configuration were used, and line lengths were converted from feet to miles to compute the series impedance of each segment:
where
and
are the resistance and reactance per mile for the conductor configuration used by line
i-
j.
The series admittance for each line segment was then obtained as
Using these admittances, the network bus admittance matrix
was assembled following the standard nodal admittance formulation [
9]
where
denotes the set of nodes directly connected to node
i. The resulting
is symmetric due to the passive nature of the network elements. Verification procedures were implemented to ensure matrix symmetry and the equality between each diagonal element and the negative sum of its corresponding off-diagonal entries.
The real and imaginary parts of (conductance G and susceptance B matrices, respectively) were exported to Excel for subsequent use in the OPF formulation. The final single-phase model comprises 22 buses after node renumbering, with node 1 corresponding to the original IEEE bus 800, which serves as the slack bus in the OPF simulations.
3. Optimal Power Flow Formulation
The proposed Optimal Power Flow (OPF) model aims to determine the optimal dispatch of active (
) and reactive (
) power from a single Distributed Generation (DG) unit connected at different buses of the simplified IEEE 34-Node Test Feeder, while ensuring that all voltage magnitudes remain within the permissible range of 0.95–1.05 pu. Two operational scenarios are analyzed: (i) DG injecting fixed active power (1 MW) with
, and (ii) DG injecting fixed active power (1 MW) with optimized
within its apparent power capability. The formulation follows the classical AC OPF structure [
10,
11], adapted for a single-phase equivalent network.
3.1. Decision Variables
: Active power generation at bus i [MW];
: Reactive power generation at bus i [MVAr];
: Voltage magnitude at bus i [kV];
: Voltage angle at bus i [rad].
3.2. Objective Function
The objective is to minimize the operational cost associated with active and reactive power generation:
where
and
are the marginal costs of active and reactive power, respectively. In this work, only the slack bus (node 1) is assigned non-zero generation costs, while the DG operates at zero marginal cost to emulate priority dispatch.
3.3. Constraints
3.3.1. Active Power Balance
For each bus
i,
where
is the active power demand at bus
i, and
and
are the elements of the conductance and susceptance matrices obtained from
.
3.3.2. Reactive Power Balance
where
is the reactive power demand at bus
i.
3.3.3. Voltage Magnitude Limits
In this work,
pu and
pu, consistent with ANSI C84.1 standards [
12].
3.3.4. Generator Capacity Limits
3.3.5. Apparent Power Capability
where
is the apparent power rating of the generator at bus
i.
3.4. Solution Approach
The above formulation represents a non-linear programming (NLP) problem due to the trigonometric terms in the power flow equations. The model was implemented in Pyomo [
13] and solved using IPOPT [
14], an interior-point optimizer suitable for large-scale NLPs. The slack bus voltage magnitude and angle were fixed, and all other buses were initialized with nominal voltage and zero angle to improve convergence. For each scenario, the OPF was solved iteratively by placing the DG at each candidate bus in the feeder and recording the resulting bus voltages, power flows, and constraint violations. Although the mathematical structure of the proposed AC OPF follows conventional formulations, the originality of this work lies in its analytical use. The model is employed to quantify the incremental hosting-capacity benefit provided solely by DG reactive power flexibility in a passive feeder. Implemented in the open-source Pyomo framework, the formulation enables transparent, reproducible analysis and a systematic bus-by-bus evaluation of feasible DG connection points, establishing a methodological benchmark for future coordinated voltage-control studies.
4. Case Studies
Two operational scenarios were defined to assess the impact of reactive power support from Distributed Generation (DG) on the hosting capacity of the IEEE 34-Node Test Feeder. In both scenarios, the DG nominal active power output was fixed at
MW, consistent with the maximum capacity allowed for priority dispatch in several regulatory frameworks [
1]. The difference between scenarios lies in the treatment of reactive power dispatch. The analysis intentionally fixes the DG output at 1 MW, which represents the maximum rating allowed for priority dispatch under Ecuadorian and other Latin American regulations. This simplification enables a clear benchmark assessment of reactive power flexibility under deterministic conditions, without the added complexity of stochastic load or voltage-control interactions.
4.1. Scenario Definitions
4.1.1. Scenario 1: Fixed Active Power, No Reactive Power Support
In this scenario, the DG injects
MW and operates at unity power factor:
Reactive power support is provided exclusively by the slack bus, which also balances system losses.
4.1.2. Scenario 2: Fixed Active Power, Optimized Reactive Power Support
Here, the DG injects
MW but can also inject or absorb reactive power within
MVAr, subject to its apparent power capability:
where
MVA in this study.
4.2. Simulation Procedure
The OPF formulation described in
Section 3 was solved for each candidate bus connection of the DG, excluding the slack bus. The set of candidate buses is
For each bus
, the OPF problem was configured with the DG located at
b, and all other buses without generation except for the slack. Voltage magnitude limits were enforced as
consistent with ANSI C84.1 [
12].
Generation cost coefficients were set as
The cost structure described above prioritizes the dispatch from DG and minimizes unnecessary reactive power exchange from the slack bus.
4.3. Summary of Parameters
Table 1 summarizes the main parameters used in both scenarios.
For each scenario and each DG location, the simulation process generates the complete set of OPF outputs, including nodal voltages (in kV and pu), phase angles, and , dispatch values for all buses. These outputs are then post-processed to count voltage violations and to determine the buses where the DG can operate at full capacity without breaching voltage limits.
5. Results and Discussion
This section presents the results obtained from the OPF simulations for the two scenarios defined in
Section 4. The analysis focuses on voltage compliance, reactive power utilization, and the impact of
Q support on the number of feasible DG connection points.
5.1. Voltage Profile Comparison
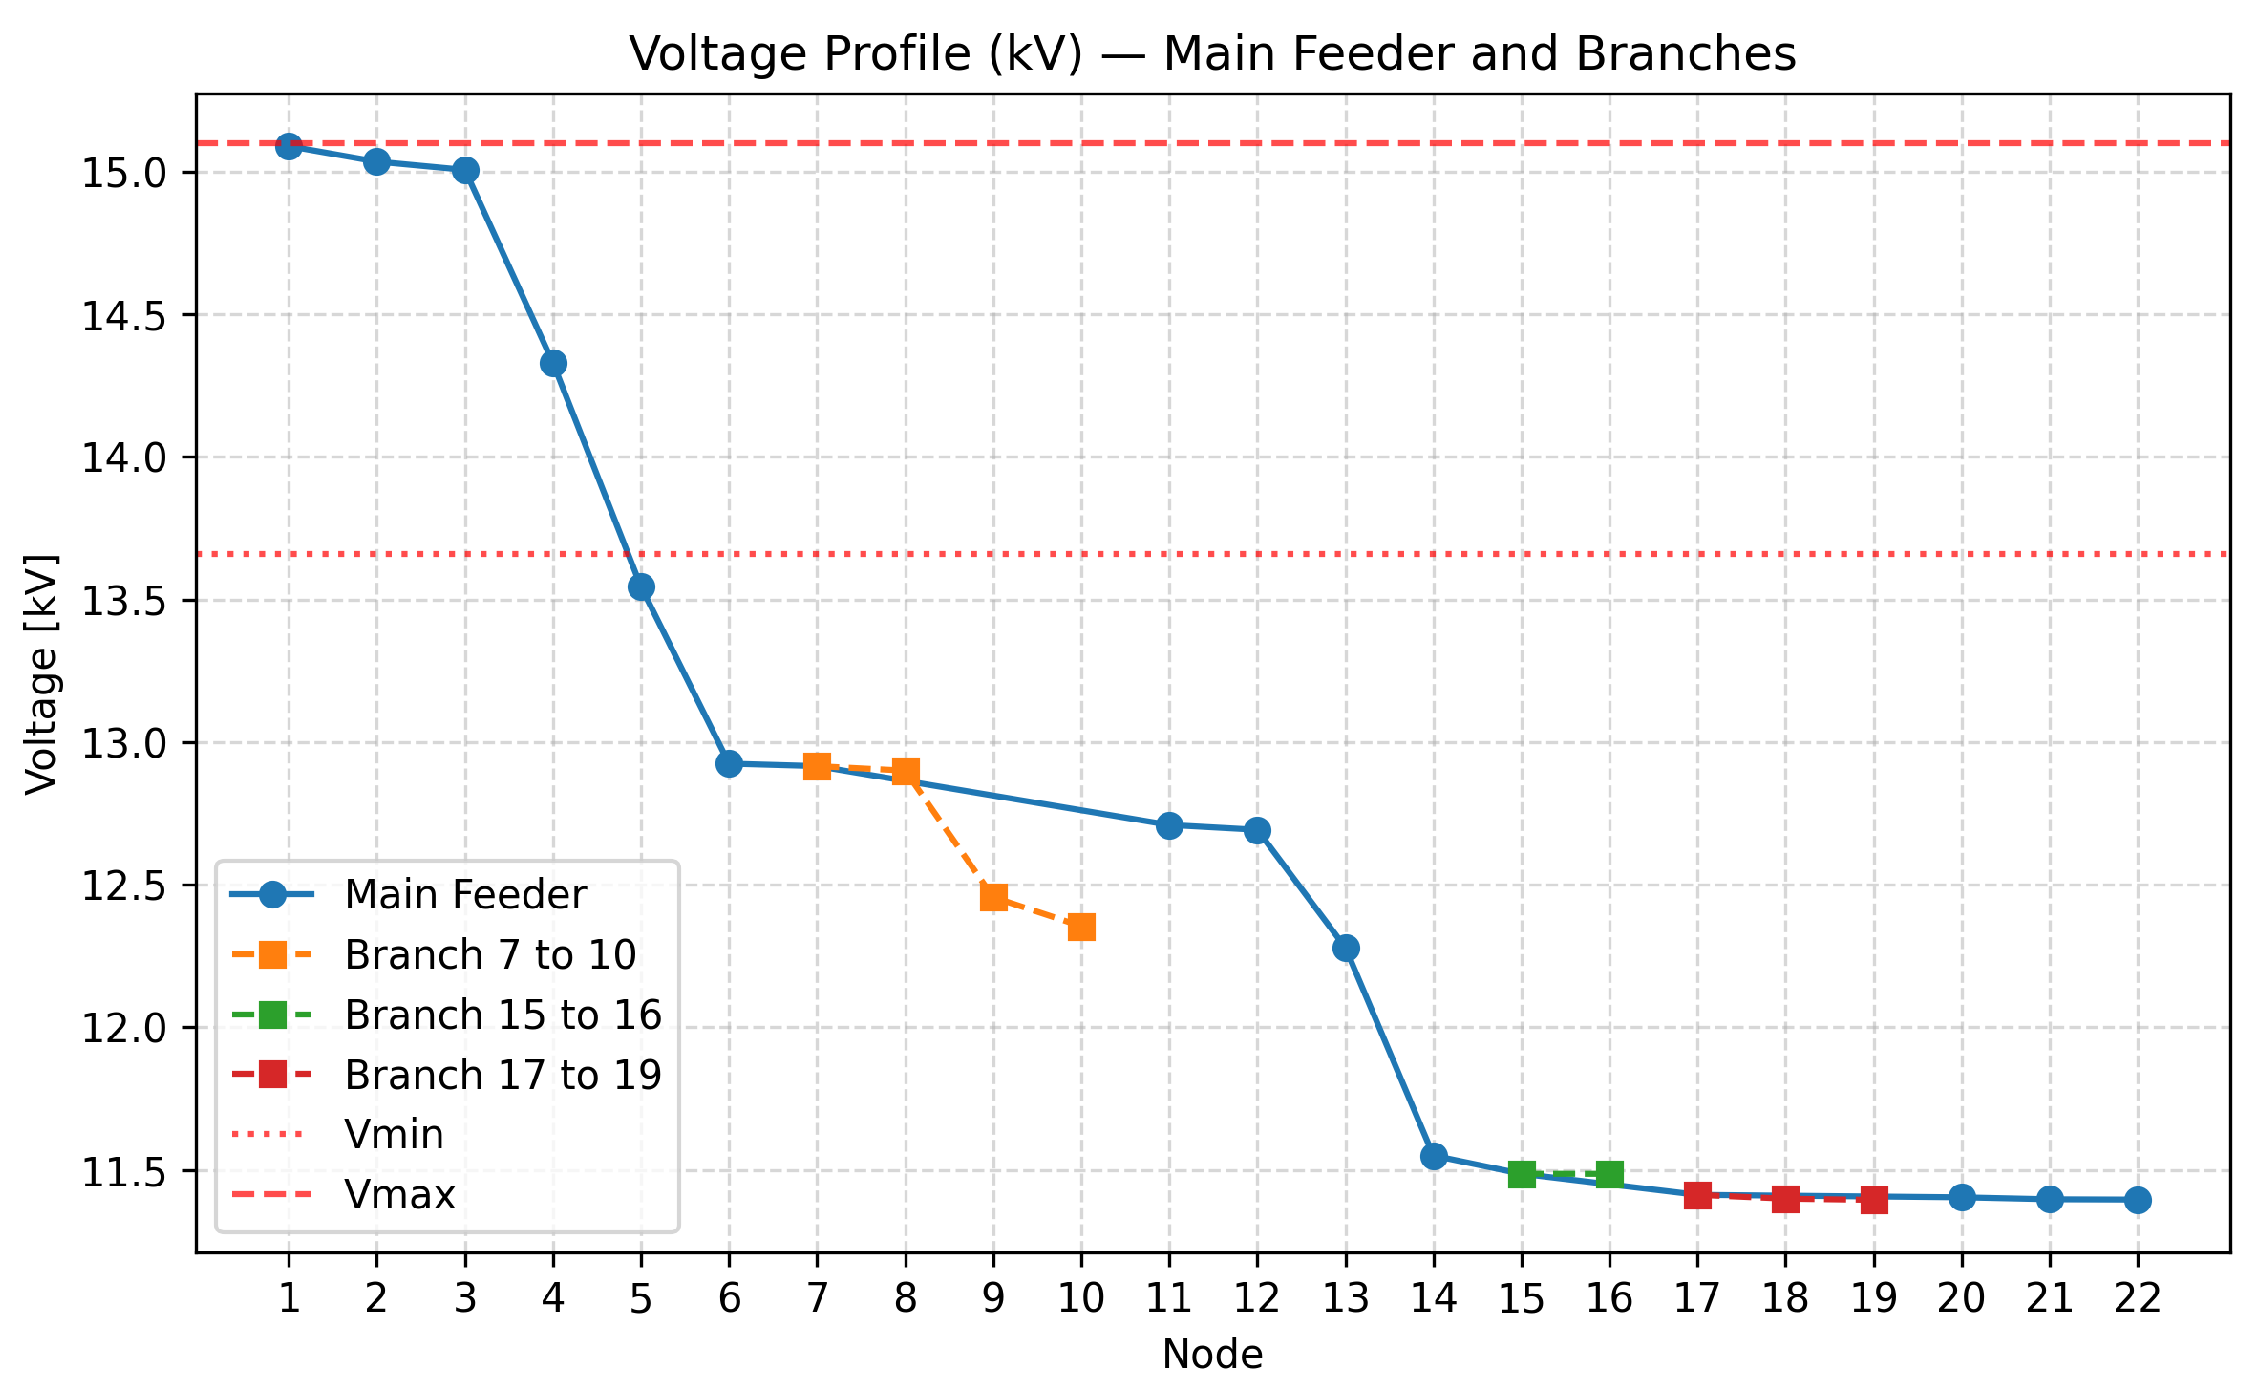
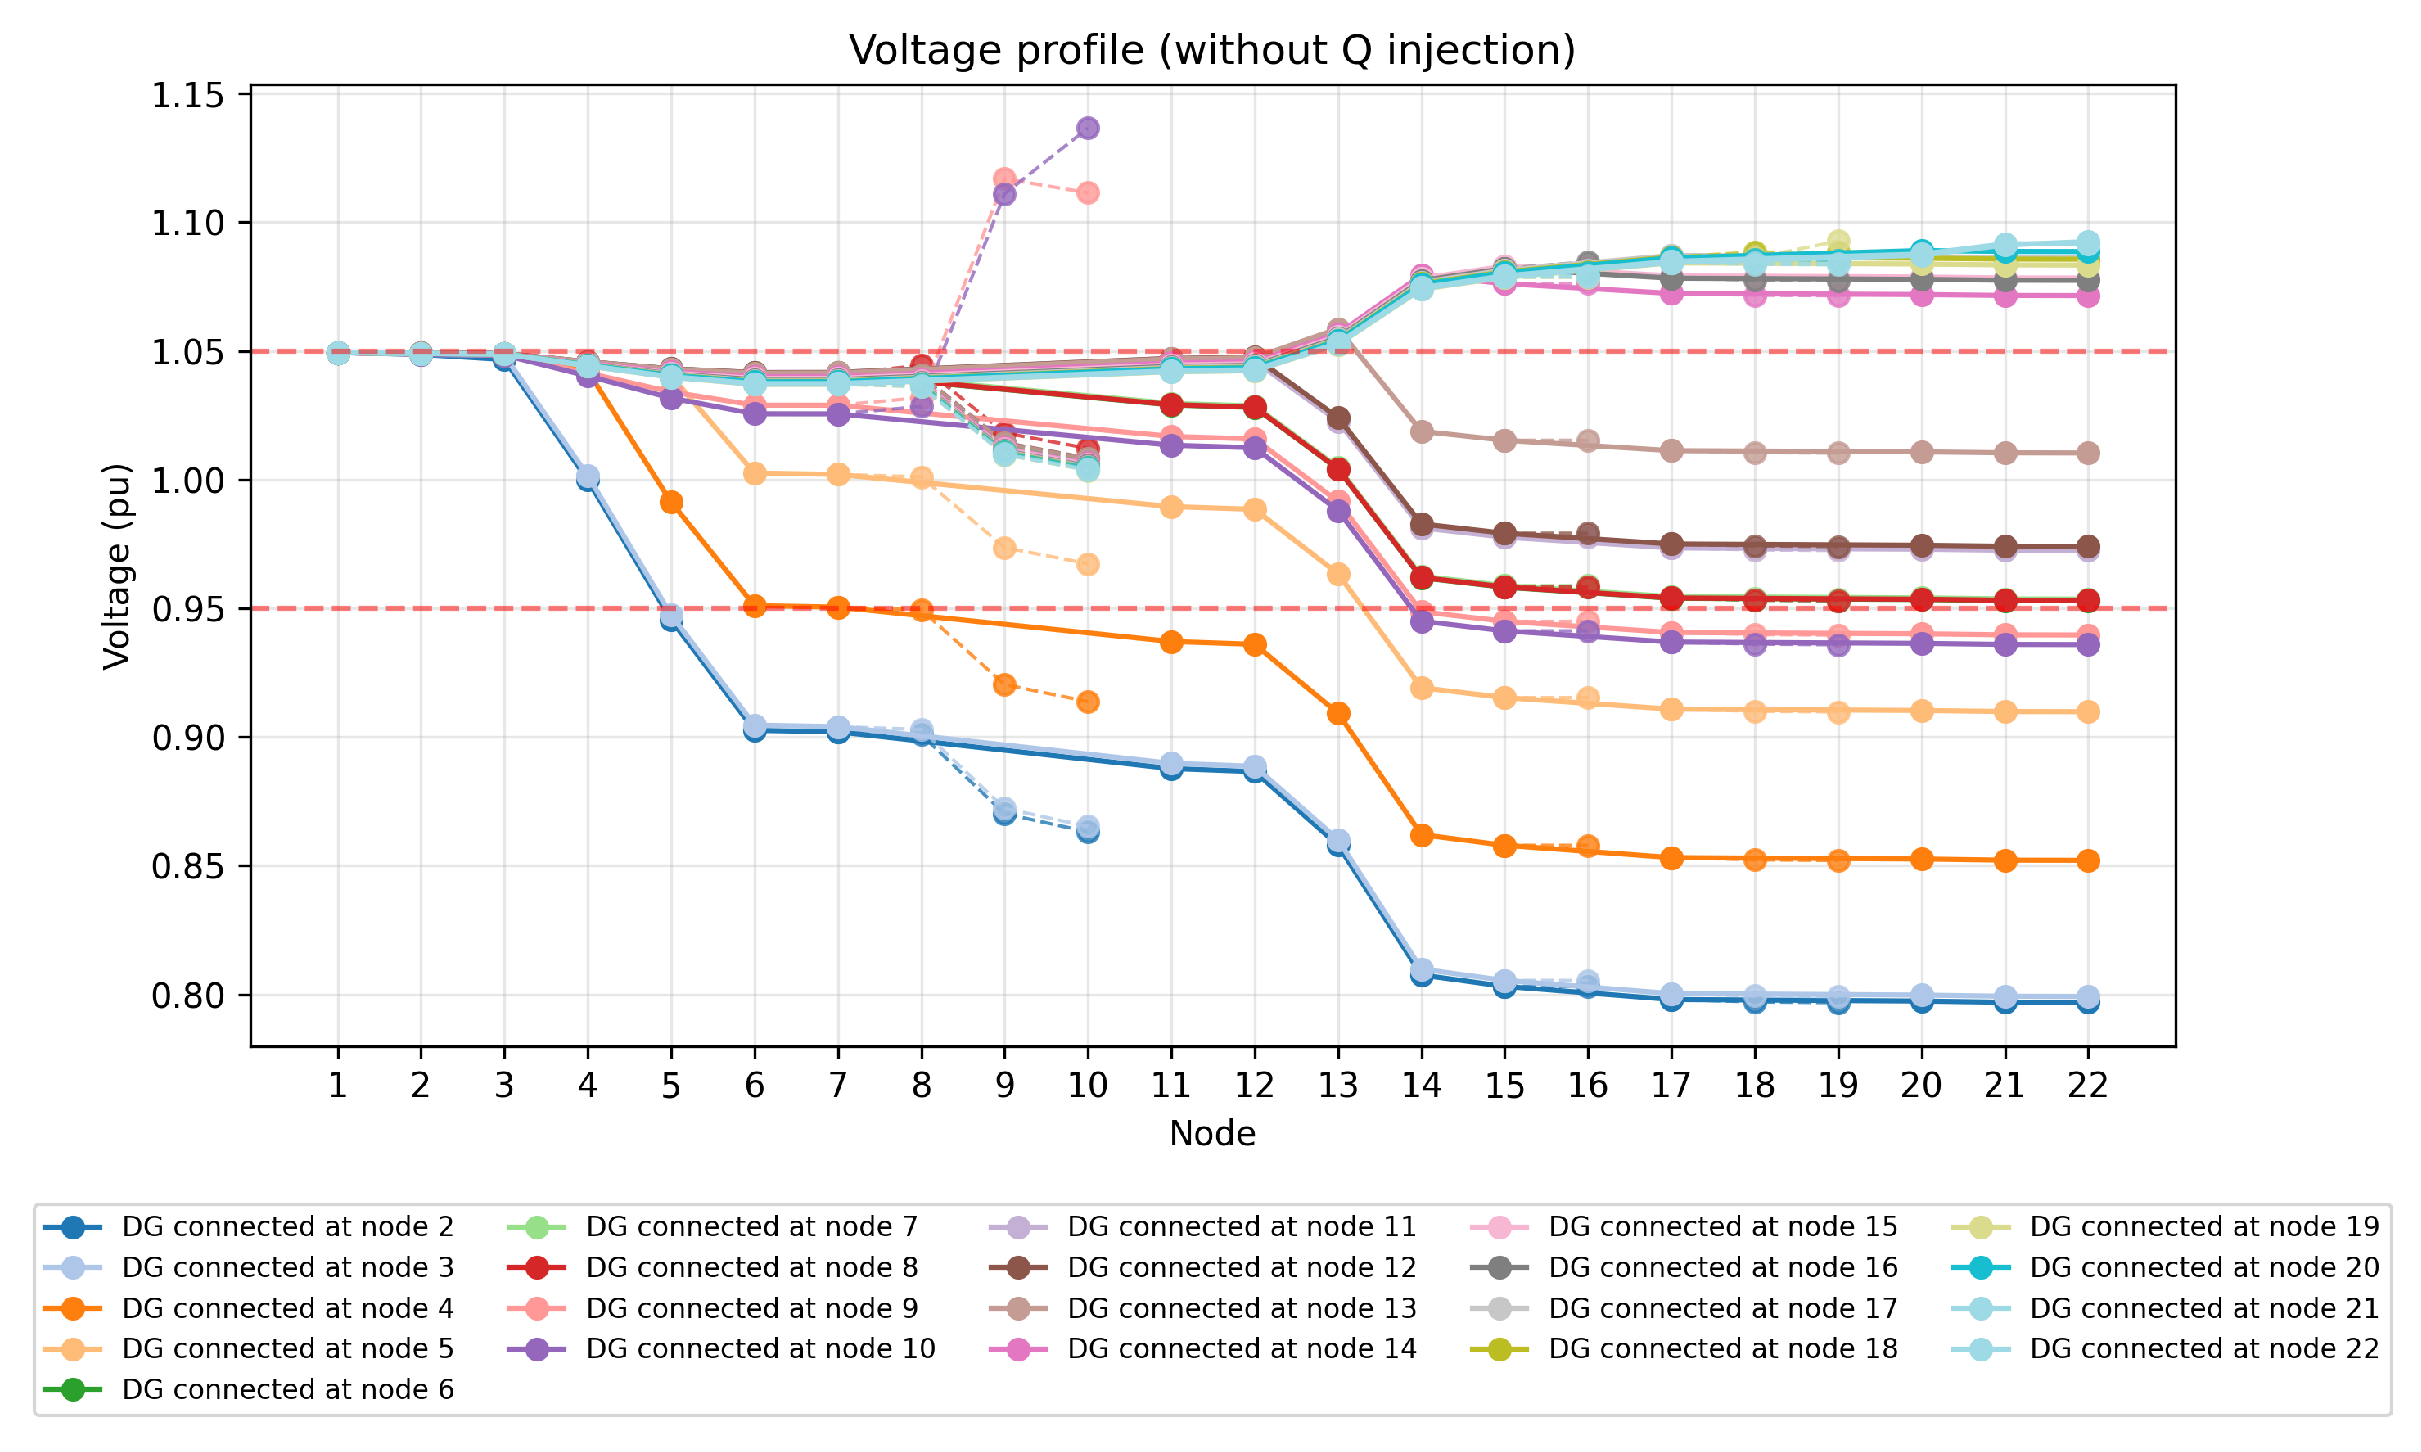
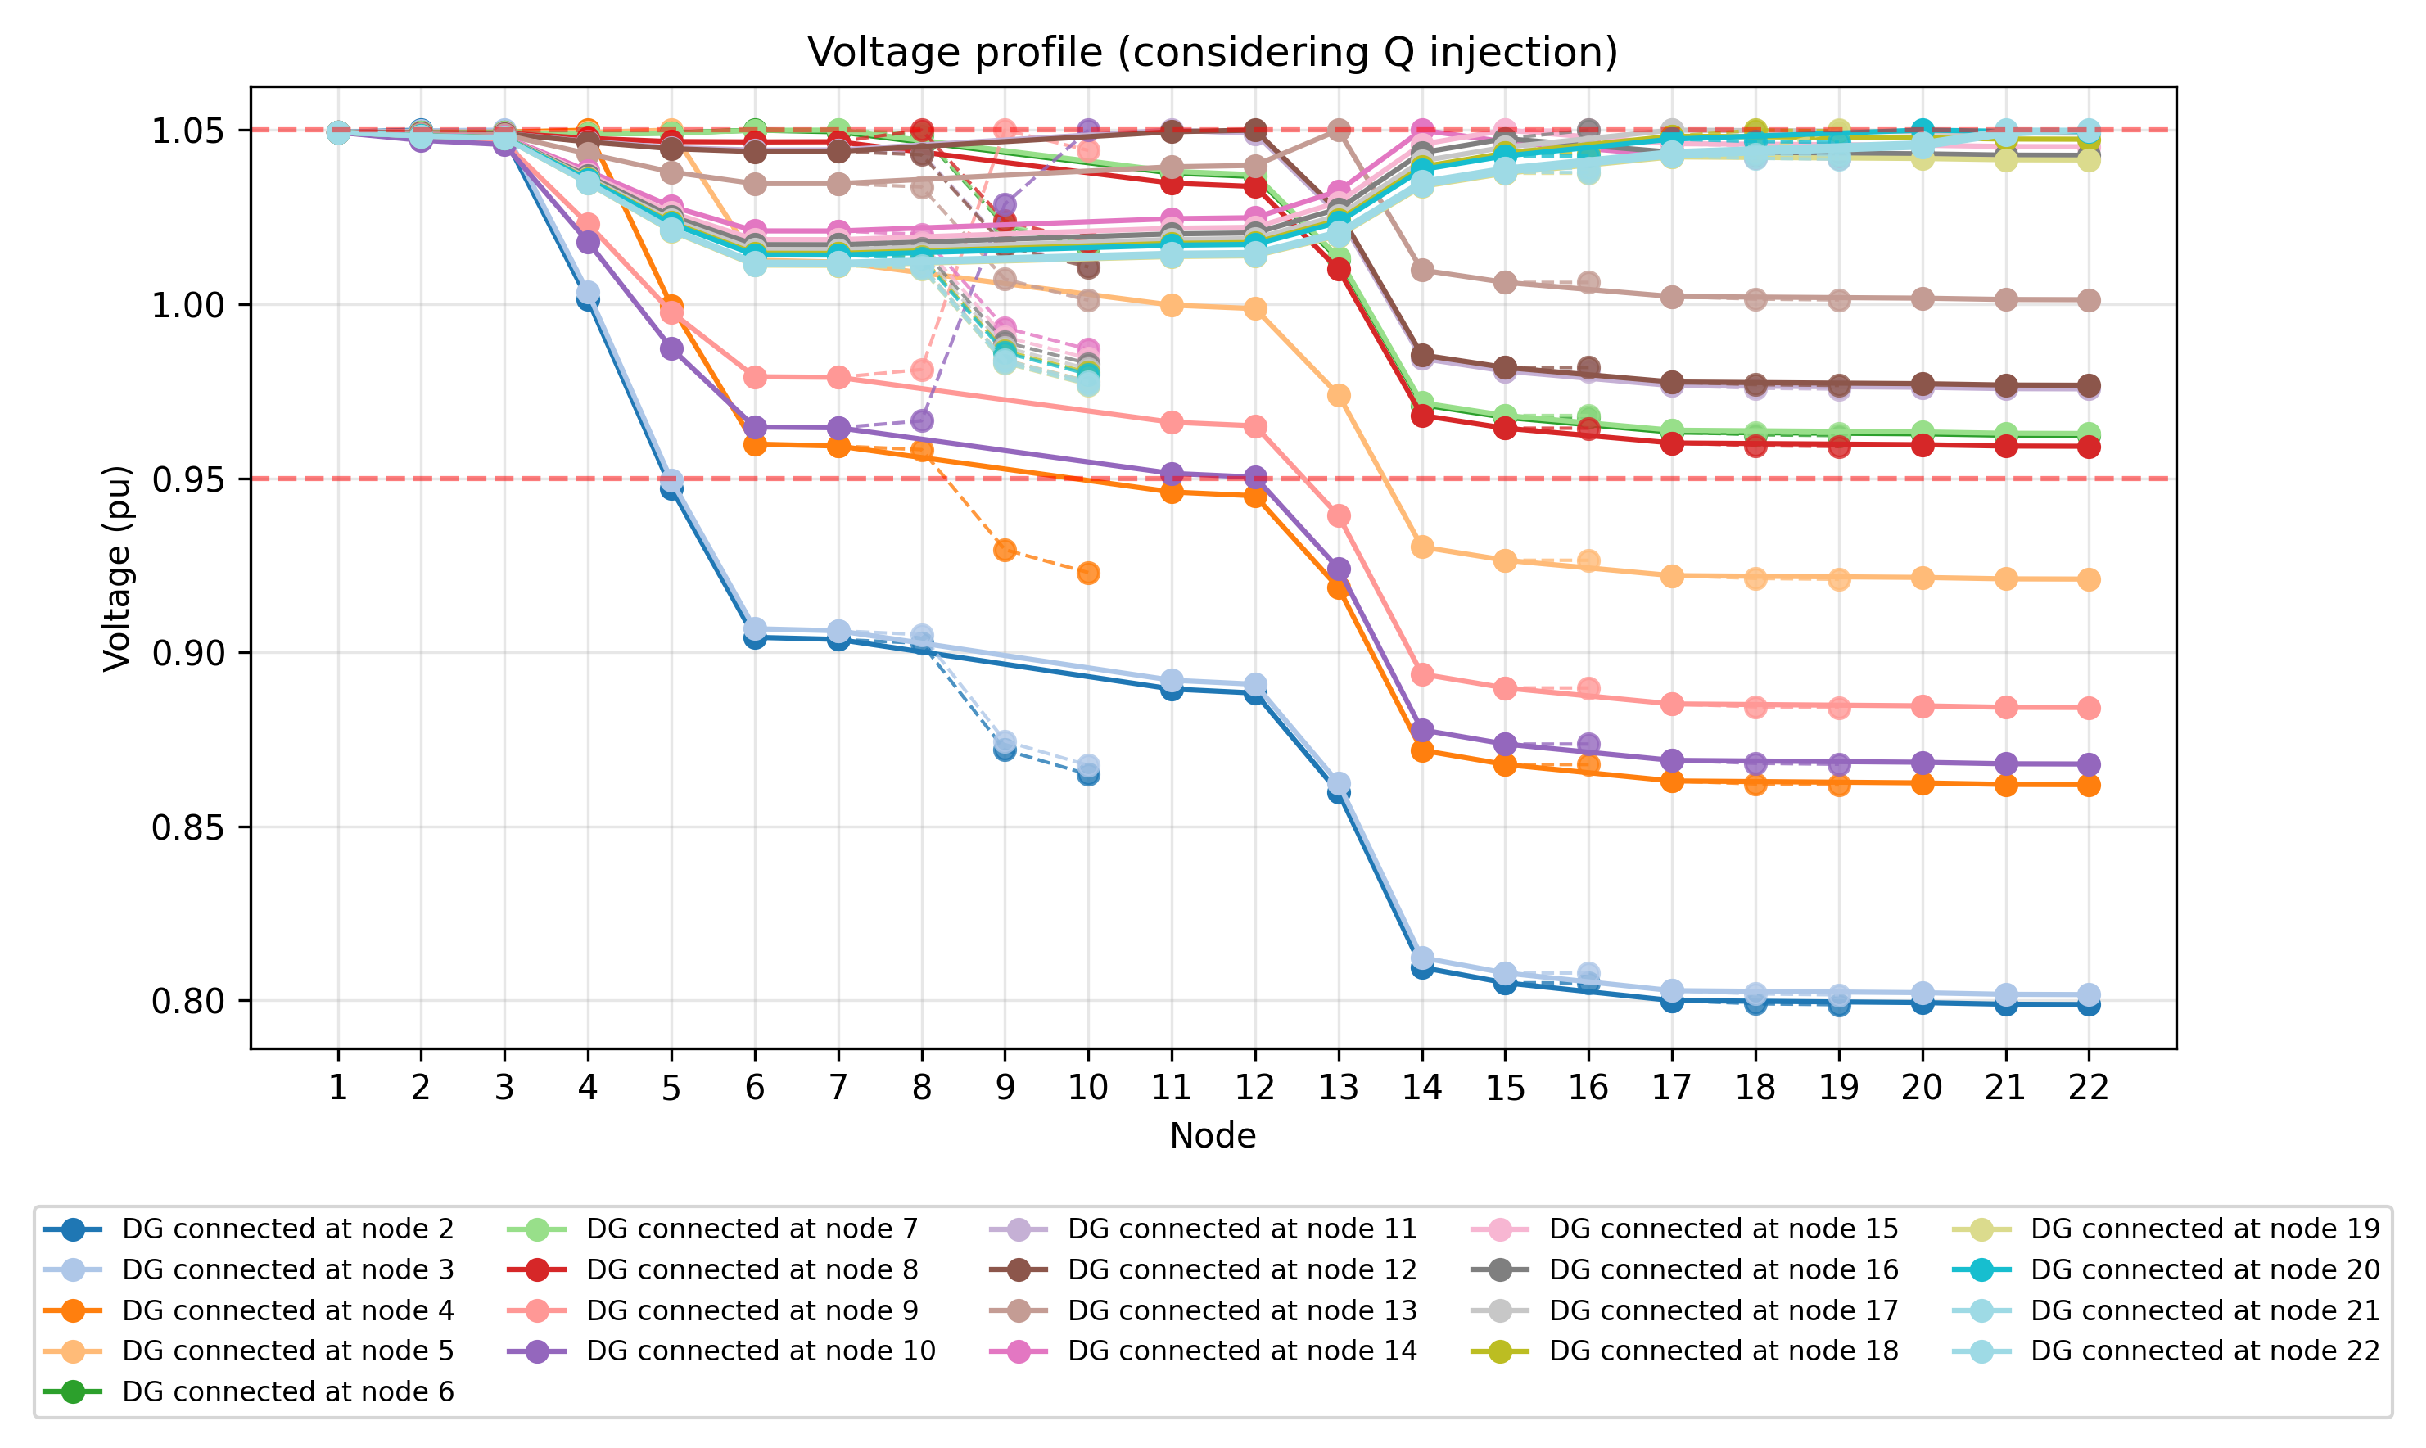
Figure 2,
Figure 3 and
Figure 4 show the voltage profiles for the base case (no DG), Scenario 1, and Scenario 2, respectively.
The profiles show that in Scenario 1, voltages at the far end of the feeder drop below 0.95 pu for several DG connection points, forcing curtailment if voltage compliance is enforced. In Scenario 2, reactive power injection compensates for voltage drops, bringing all voltages closer to nominal values.
5.2. Voltage Compliance Analysis
For each candidate DG connection bus, the OPF outputs were post-processed to determine:
Whether all bus voltages remain within 0.95–1.05 pu.
The number of buses violating voltage limits ().
The minimum and maximum voltages across the feeder (, ).
Table 2 summarizes the results for both scenarios. It can be observed that in Scenario 2 (with
Q support), the number of compliant DG connection points increases significantly.
Overall, Scenario 2 exhibits the following:
Increase in feasible DG locations: More buses satisfy voltage limits.
Higher : Voltage profile is uniformly elevated due to local Q injection.
Same : Remains close to the upper bound in both scenarios.
6. Discussion
These results highlight the potential of reactive power flexibility as a cost-effective measure to improve the hosting capacity of distribution networks, particularly in regulatory environments that currently prioritize active power dispatch without requiring reactive power support.
Future work will extend this study in the following directions:
Considering three-phase unbalanced models to capture phase-specific voltage issues and asymmetrical loading.
Evaluating coordinated control strategies among multiple DG units, capacitor banks, and voltage regulators.
Performing techno-economic analyses to quantify the benefits of reactive power capabilities relative to their implementation costs.
Extending the study to include variable load levels, stochastic generation profiles, and comparisons with standard Volt/VAR droop controllers to validate and generalize the proposed benchmark under realistic operating conditions.
Impact on Hosting Capacity
The hosting capacity, defined as the maximum DG penetration without violating voltage limits [
15], is directly increased in Scenario 2. By leveraging reactive power flexibility:
Buses that were infeasible in Scenario 1 (e.g., buses 4, 5) become feasible.
Even in feasible locations, improves by up to 1% pu.
This demonstrates that modest Q capabilities (here, MVAr) can meaningfully expand the viable DG siting options without network reinforcement.
The methodology and findings of this study are generalizable to other radial distribution feeders and can inform regulatory updates that better integrate reactive power flexibility into DG interconnection requirements.
7. Conclusions
This paper presented an optimization-based analysis of reactive power support from Distributed Generation (DG) units to maximize active power injection in distribution networks, using the IEEE 34-Node Test Feeder as a case study. A simplified single-phase equivalent of the feeder was developed, and an AC Optimal Power Flow (OPF) formulation was implemented in Pyomo to evaluate two scenarios: (i) DG injecting fixed active power without reactive power support, and (ii) DG injecting fixed active power with optimized reactive power dispatch within its apparent power limits.
The main findings are as follows:
Reactive power support increases voltage compliance: Allowing the DG to inject or absorb up to MVAr significantly improved the minimum bus voltages and reduced the number of voltage limit violations across the network.
Expanded feasible DG connection points: The number of buses where 1 MW can be injected without violating voltage limits increased from 8 to 13 in Scenario 2 compared to Scenario 1. The minimum bus voltage also improved by approximately 1% relative to the case without reactive power support. These results provide clear numerical evidence of the effectiveness of reactive power flexibility in enhancing voltage compliance and hosting capacity, moving beyond qualitative expectations reported in previous studies.
Improved hosting capacity: Even with moderate reactive power capability, the network’s ability to host DG without reinforcement was enhanced.
The novelty of this study lies in its methodological isolation of DG reactive power flexibility in a passive distribution feeder, allowing the quantification of the intrinsic benefit of reactive support in enhancing voltage compliance and hosting capacity. The findings establish a lower-bound benchmark that can be used to evaluate the incremental value of coordinated Volt/VAR control in future, more complex scenarios.
Author Contributions
Conceptualization, E.N. and J.C.; methodology, E.N.; software, E.N.; validation, E.N. and J.C.; formal analysis, E.N.; investigation, E.N.; resources, E.N.; data curation, E.N.; writing—original draft preparation, E.N.; writing—review and editing, E.N. and J.C.; visualization, E.N.; supervision, J.C.; project administration, E.N., All authors have read and agreed to the published version of the manuscript.
Funding
This research was supported by Escuela Politécnica Nacional (EPN), Quito, Ecuador, through its Doctoral Program in Electrical Engineering, which provided institutional and financial support for the development and publication of this work, including the Article Processing Charge (APC).
Institutional Review Board Statement
Not applicable.
Informed Consent Statement
Not applicable.
Data Availability Statement
The data presented in this study are available on request from the corresponding author. The datasets were derived from the IEEE 34-Node Test Feeder available at
https://site.ieee.org/pes-testfeeders/resources/ (accessed on 15 October 2025).
Acknowledgments
The authors would like to thank Escuela Politécnica Nacional (EPN), Quito, Ecuador, for the academic and institutional support provided for the development of this research.
Conflicts of Interest
The authors declare no conflicts of interest. The funders had no role in the design of the study; in the collection, analyses, or interpretation of data; in the writing of the manuscript; or in the decision to publish the results.
Abbreviations
The following abbreviations are used in this manuscript:
| DG | Distributed Generation |
| OPF | Optimal Power Flow |
| IEEE | Institute of Electrical and Electronics Engineers |
| MVAr | Megavolt-Ampere Reactive |
| MW | Megawatt |
| pu | per unit |
| AC | Alternating Current |
| ANSI | American National Standards Institute |
| Ybus | Bus Admittance Matrix |
| Pg | Active Power Generation |
| Qg | Reactive Power Generation |
References
- Kryonidis, G.C.; Demoulias, C.S.; Dikaiakos, C.; Karytsas, C.; Labridis, D.P. Distributed Reactive Power Control Scheme for the Voltage Regulation of Unbalanced LV Grids. IEEE Trans. Sustain. Energy 2021, 12, 1301–1310. [Google Scholar] [CrossRef]
- Farivar, M.; Low, S.H. Branch Flow Model: Relaxations and Convexification—Part I. IEEE Trans. Power Syst. 2013, 28, 2554–2564. [Google Scholar] [CrossRef]
- Hu, X.; Liu, Z.-W.; Wen, G.; Yu, X.; Liu, C. Voltage Control for Distribution Networks via Coordinated Regulation of Active and Reactive Power of DGs. IEEE Trans. Smart Grid 2020, 11, 4017–4031. [Google Scholar] [CrossRef]
- Ayaz, M.S.; Malekpour, M.; Azizipanah-Abarghooee, R.; Terzija, V. Local Photovoltaic Reactive Power Controller for Increasing Active Distribution Networks Hosting Capacity. IET Gener. Transm. Distrib. 2020, 14, 5152–5162. [Google Scholar] [CrossRef]
- Jiao, W.; Chen, J.; Wu, Q.; Li, C.; Zhou, B.; Huang, S. Distributed Coordinated Voltage Control for Distribution Networks with DG and OLTC based on MPC and Gradient Projection. IEEE Trans. Power Syst. 2021, 37, 680–690. [Google Scholar] [CrossRef]
- Song, G.; Wu, Q.; Jiao, W.; Lu, L. Distributed Coordinated Control for Voltage Regulation in Active Distribution Networks Based on Robust Model Predictive Control. Int. J. Electr. Power Energy Syst. 2025, 166, 110529. [Google Scholar] [CrossRef]
- Kersting, W.H. Radial Distribution Test Feeders. IEEE Trans. Power Syst. 1991, 6, 975–985. [Google Scholar] [CrossRef]
- IEEE Distribution System Analysis Subcommittee. IEEE 34 Node Test Feeder Data. 2018. Available online: https://site.ieee.org/pes-testfeeders/resources/ (accessed on 15 October 2025).
- Grainger, J.J.; Stevenson, W.D., Jr. Power System Analysis; McGraw-Hill: New York, NY, USA, 1994. [Google Scholar]
- Momoh, J.A.; El-Hawary, M.E.; Adapa, R. A Review of Selected Optimal Power Flow Literature to 1993. Part I: Nonlinear and Quadratic Programming Approaches. IEEE Trans. Power Syst. 1999, 14, 96–104. [Google Scholar] [CrossRef]
- Frank, S.; Steponavice, I.; Rebennack, S. Optimal Power Flow: A Bibliographic Survey I. Energy Syst. 2012, 3, 221–258. [Google Scholar] [CrossRef]
- ANSI C84.1-2016; Electric Power Systems and Equipment—Voltage Ratings (60 Hertz). American National Standards Institute: Washington, DC, USA, 2016. Available online: https://webstore.ansi.org/standards/nema/ansic842016?srsltid=AfmBOoqhPQSXdV5WWtZnqdn-vrRV7mXEDhvV12VaJbatwgARY9MPNwWH (accessed on 15 October 2025).
- Hart, W.E.; Watson, J.P.; Woodruff, D.L. Pyomo—Optimization Modeling in Python, 2nd ed.; Springer: Cham, Switzerland, 2017. [Google Scholar] [CrossRef]
- Wächter, A.; Biegler, L.T. On the Implementation of an Interior-Point Filter Line-Search Algorithm for Large-Scale Nonlinear Programming. Math. Program. 2006, 106, 25–57. [Google Scholar] [CrossRef]
- Bollen, M.H.J.; Hassan, F. Integration of Distributed Generation in the Power System; Wiley-IEEE: Hoboken, NJ, USA, 2011; Available online: https://ieeexplore.ieee.org/book/6047601 (accessed on 15 October 2025).
| Disclaimer/Publisher’s Note: The statements, opinions and data contained in all publications are solely those of the individual author(s) and contributor(s) and not of MDPI and/or the editor(s). MDPI and/or the editor(s) disclaim responsibility for any injury to people or property resulting from any ideas, methods, instructions or products referred to in the content. |
© 2025 by the authors. Licensee MDPI, Basel, Switzerland. This article is an open access article distributed under the terms and conditions of the Creative Commons Attribution (CC BY) license (https://creativecommons.org/licenses/by/4.0/).


