Proceeding Paper

Experimental Study of the Interaction of UHF Electromagnetic Waves with Fuel-Contaminated Water †

by
Kevin Iza Arteaga
,
Gabriel Palma Batallas
,
Pablo Lupera Morillo
* and
Darwin Flores Osorio
Faculty of Electrical and Electronic Engineering, Department of Electronics and Telecommunications (DETRI), National Polytechnic School, Quito 170143, Ecuador
*
Author to whom correspondence should be addressed.
Presented at the XXXIII Conference on Electrical and Electronic Engineering, Quito, Ecuador, 11–14 November 2025.
Eng. Proc. 2025, 115(1), 11; https://doi.org/10.3390/engproc2025115011 (registering DOI)
Published: 15 November 2025
(This article belongs to the Proceedings of The XXXIII Conference on Electrical and Electronic Engineering)

Abstract

This work presents an experimental study of the electromagnetic behavior of water and its interaction with gasoline in the frequency range of 1.9 to 2.6 GHz, corresponding to the UHF band. This interval lies within the dielectric relaxation region of water, where significant absorption and reflection phenomena occur. The results show qualitative differences in the electromagnetic responses of water, gasoline, and their mixtures, particularly in the stability of amplitudes and phase variability. The mixtures exhibit an intermediate behavior between the pure liquids, highlighting the direct influence of the dielectric properties of the medium on the reflected signal. Furthermore, it was identified that the band between 2400 and 2550 MHz presents a more predictable amplitude response, making it a promising frequency range for the non-invasive detection of gasoline as a contaminant in aquatic environments.

1. Introduction

Water exhibits a high static permittivity at room temperature ( ε s 78 at 25 °C), a high-frequency limit of ε 5 , and a Debye relaxation time of τ 8.2 ps [1,2]. In the 1.90–2.60 GHz band considered here, ε is already decreasing with frequency, while the dielectric loss ε produces a dynamic conductivity σ ( ω ) = ω ε 0 ε that enhances attenuation in aqueous media. Building on this background, the present work contributes an experimental validation Ultra High Frequency (UHF) reflections using conventional Radio Frequency (RF) instruments (signal generator, oscilloscope, spectrum analyzer, splitters, and antennas) arranged in a simple reflective setup with a metallic plate and a vinyl pool. This configuration allowed not only the verification of theoretical dielectric behavior but also the assessment of the practical limitations of standard laboratory equipment and accessories.
A key outcome of the experiments was the identification, under the specific conditions of the present setup, of a sub-band between 2.40 and 2.55 GHz where the amplitude response appeared more predictable and stable across different liquids. This observation suggests that this range may serve as a promising candidate for the non-invasive detection of gasoline as a contaminant in aquatic environments, within the limitations and particularities of the experimental scenario implemented in the laboratory.

2. Interaction of Electromagnetic Waves with Fluids

2.1. Water as a Dielectric and Its Behavior at High Frequencies

Water is a dielectric material whose response to electromagnetic fields primarily depends on the frequency. In the range of 1.9 to 2.6 GHz, used in this study, its behavior is strongly influenced by dielectric relaxation. As shown in Figure 1, the effective conductivity increases significantly above 1 GHz, which implies higher absorption and electromagnetic losses. This phenomenon is described by the complex dielectric permittivity [2]:
Throughout this work we adopt the complex permittivity notation ε * ( ω ) = ε ( ω ) j ε ( ω ) . For clarity and consistency, the frequency-dependent (dynamic) conductivity is defined as σ ( ω ) = ω ε 0 ε ( ω ) , which is used in the subsequent analysis.
ε ( ω ) = ε 0 ε ( ω ) j ε ( ω )
where ε ( ω ) represents the energy storage and ε ( ω ) represents the losses related to the effective conductivity σ ( ω ) , given by [2]:
σ ( ω ) = ω ε 0 ε ( ω )
where ε 0 = 8854 × 10 12 F / m is the permittivity of free space.
This trend confirms that, in the range of 1.9 to 2.6 GHz, water exhibits increasing conductivity, which in turn increases its dielectric losses. This effect directly contributes to the attenuation of electromagnetic waves in aqueous media.
The dielectric behavior of water can be modeled using the Debye equation [2].
ε ( ω ) = ε + ε s ε 1 + j ω τ
with ε s 80 , ε 4.5 , and τ 8.3 ps at 20 °C [2,3].
This behavior has been analyzed by Artemov [2], who indicates that water exhibits a primary dielectric relaxation in the range of 1–10 GHz, attributed to the reorientation of H2O dipoles, which is a significant phenomenon in the dielectric characterization of aqueous media.
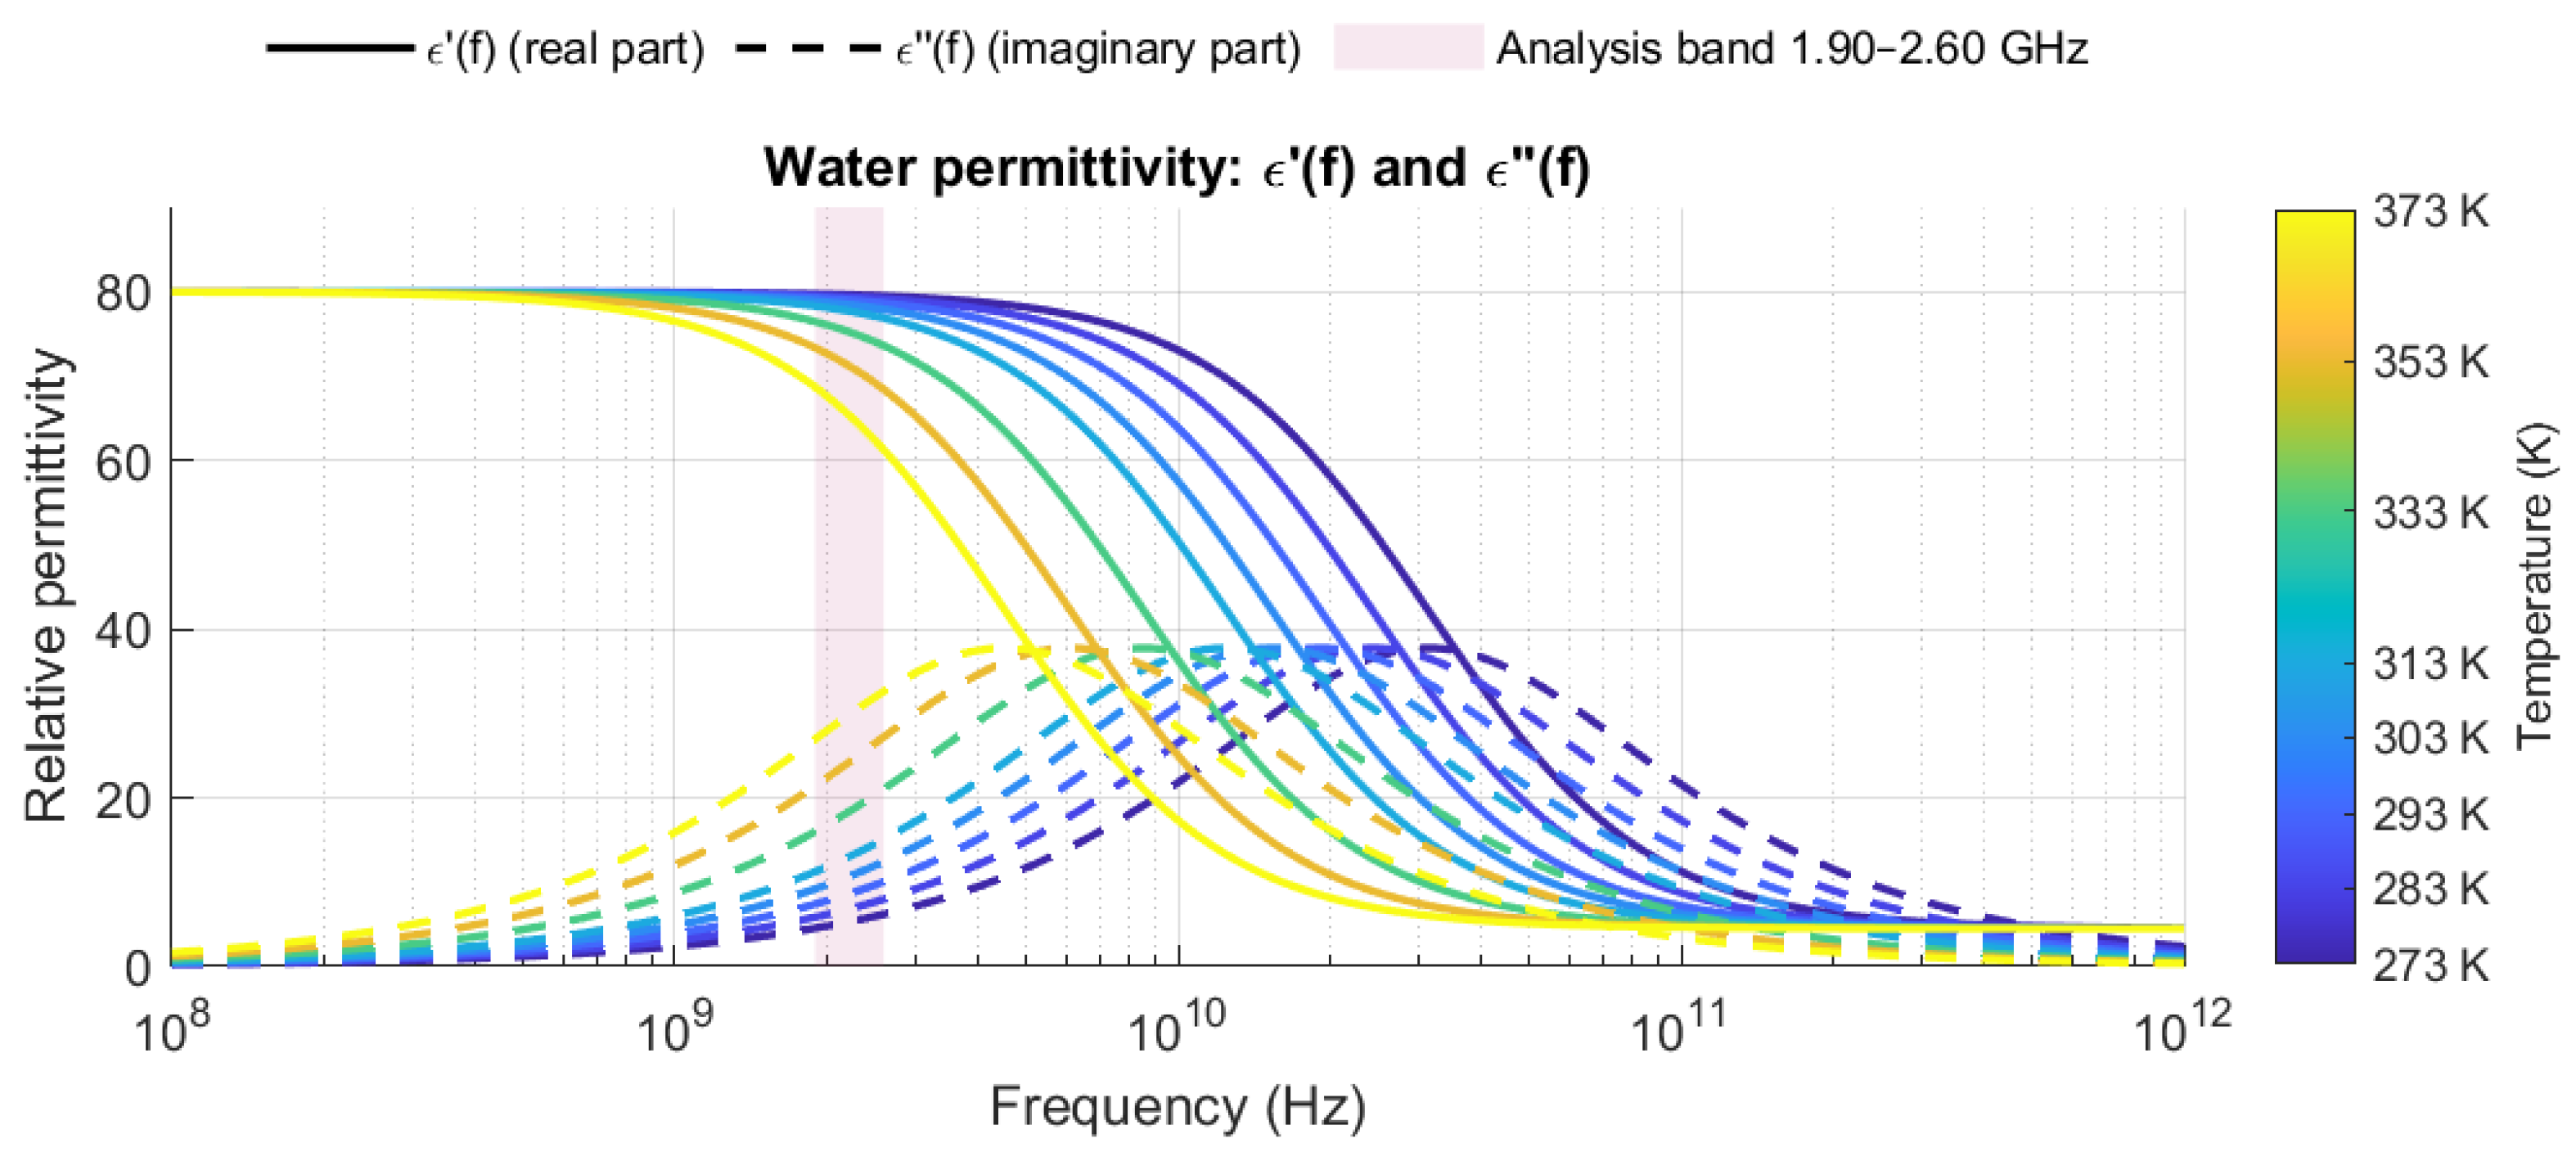
Figure 1, based on the Debye equation, shows the dynamic conductivity σ ( ω ) of water, which increases above ∼1 GHz as a direct consequence of dielectric losses; this trend contributes to larger attenuation constants in aqueous media. In contrast, Figure 2 illustrates the real and imaginary parts of permittivity ( ε , ε ) according to the Debye model: ε decreases with frequency while ε exhibits a relaxation peak in the microwave range.
From an electromagnetic standpoint, the increase in σ ( ω ) and the persistence of a non-negligible loss tangent tan δ = ε / ε with frequency imply stronger attenuation and a modified wave impedance in water. Consequently, both the magnitude and phase of the reflected wave are affected. This provides the rationale for probing the 1.90–2.60 GHz band: although the principal Debye peak occurs at higher frequencies, the combined dispersion and loss in this band are already sufficient to yield measurable differences in the reflected signal among water, gasoline, and their mixture.
The high sensitivity of the reflection coefficient to dielectric permittivity justifies the analysis in the UHF range. Since hydrocarbons alter the properties of water, the study of reflected waves offers a means to detect non-polar contamination.

2.2. Reflection Coefficient in Electromagnetic Waves

The electromagnetic reflection coefficient, which relates the reflected and incident waves at the interface of two dielectric media, is useful for detecting non-polar contamination, as small variations in permittivity significantly affect the reflected energy. For normal incidence in non-magnetic media ( μ 1 = μ 2 = μ 0 ), the coefficient Γ is defined as [4]:
Γ = η 2 η 1 η 2 + η 1
where η 1 and η 2 are the characteristic impedances of the media; in air, η 1 377 Ω , while for pure water or another medium with a relative permittivity ε r , the impedance is calculated as [4]:
η 2 = η 0 ε r
For pure water with ε r = 80 , the characteristic impedance is approximately 42.15 Ω , resulting in Γ = 0.798 , which implies that approximately 63.7 % of the incident power is reflected, accompanied by a phase shift of 180 ° . On the other hand, for oblique incidence, Γ depends on the angle and polarization, expressed as [4,5]:
In the case of perpendicular polarization (TE mode):
Γ T E = n 1 cos θ i n 2 cos θ t n 1 cos θ i + n 2 cos θ t
For polarization parallel to the plane of incidence (TM mode):
Γ T M = n 2 cos θ i n 1 cos θ t n 2 cos θ i + n 1 cos θ t
In both expressions, n 1 and n 2 are the refractive indices of the incident and reflecting media, respectively, and θ t is the transmission angle, related to the incident angle θ i by Snell’s law [6]:
n 1 sin θ i = n 2 sin θ t
It is worth mentioning that, in the case of normal and oblique incidence, the reflection factors can exhibit significantly different behaviors, as they depend on both the angle of incidence and the polarization of the electromagnetic wave. In normal incidence, the reflection coefficient depends solely on the contrast between the impedances of the media. However, under oblique incidence, this coefficient varies with the angle and is distinguished between perpendicular (TE) and parallel (TM) polarization, which can lead to phenomena such as the Brewster angle (where the reflection is zero for TM waves) or total reflections at certain angular ranges, modifying both the magnitude and the phase of the reflected wave [7,8].

2.3. Relative Permittivity in Aqueous Mixtures

A fuel such as gasoline is a non-polar dielectric with low permittivity ε s 2.0 2.2 and conductivity close to zero, σ ( ω ) 0 [7]. In contrast, in water-gasoline mixtures, the effective permittivity can be calculated using the semi-empirical model described in [9]:
ε m = k [ ρ ε w + ( 1 ρ ) ε g ] + ( 1 k ) ε w ε g ρ ε g + ( 1 ρ ) ε w
k = 2 ρ 5 3 ρ
where ρ represents the volumetric fraction of water, and ε w and ε g are the permittivities of water and gasoline, respectively.

2.4. Propagation of Electromagnetic Waves

In this study, it is assumed that the electromagnetic waves originate from the transmitter, travel through the air, interact with the liquid surface, and then travel back to the receiver through the air. Therefore, it is necessary to consider the free-space propagation model with a line-of-sight based on the Friis equation for wave propagation through the air [8,10]:
P r = P t G t G r λ 4 π d 2 ,
where P r and P t are the received and transmitted powers measured in watts [W], G t and G r are the gains of the transmitting and receiving antennas (dimensionless), λ = c / f is the wavelength measured in meters [m], c is the speed of light (approximately 3 × 10 8 m/s) and d is the distance between antennas measured in meters [m].
The first Fresnel zone has a radius [11]:
r 1 = λ d 1 d 2 d 1 + d 2 ,
and the free-space loss in decibels is calculated as [10]:
F S P L d B = 20 log 10 ( d ) + 20 log 10 ( f ) 147.55 .
where F S P L d B is the free space path loss (FSPL) expressed in decibels (dB), ds the distance between antennas measured in meters [m], and f is the operating frequency measured in Hertz (Hz). It should be noted that for the equation to be valid with the constant 147.55 , the distance must be in meters (m) and the frequency in Hertz (Hz).
These expressions allow for the design of experiments under line-of-sight conditions. On the other hand, in addition to the attenuation that electromagnetic waves suffer from propagation and their interaction with a liquid medium due to the reflection phenomenon, phase shifts occur between the transmitted and received signals due to propagation delays. These delays arise from various factors such as the propagation of the signal through the air, the delays introduced by physical devices (cables, connectors, and splitters), and the effects of interaction with the medium, particularly due to the reflection phenomenon. For this study, the total delay was evaluated using the following expression:
t total = t air + t devices + t reflection .
For propagation in air, the delay can be described as [8,11]:
t air = d v
where d is the distance between antennas in meters and v is the propagation speed in the medium in m/s (approximately 3 × 10 8 m/s in air).
For propagation through devices, the delay is expressed as [8,11]:
t devices = i l i v i
where l i represents the length of each component (such as cables or splitters), and v i is the propagation velocity corresponding to the internal dielectric medium of the device.
Finally, the delay associated with the reflection phenomenon is modeled as [8,11]:
t reflection = ϕ ( ω ) ω
where ϕ ( ω ) is the phase shift induced by reflection (in radians), and ω = 2 π f is the angular frequency of the signal (in radians per second).

2.5. Electromagnetic Reflection Coefficient in the Interaction Between Water and Different Aqueous Media

For the analysis of the experimental scenarios considered in this study, the reflection of electromagnetic waves is evaluated in three configurations: air–pure water, air–gasoline, and air–water-gasoline mixtures. To achieve this, the characteristic impedance expressions for non-magnetic dielectric media from Equation (5), and the reflection coefficient for normal incidence (as the analysis conditions were carried out under normal incidence) from Equation (4), were used, where η 1 377 Ω corresponds to air, and η 2 depends on the dielectric medium with which the incident wave interacts [12].
For the air–water case, considering a relative permittivity ε r = 80 [7] for water, a characteristic impedance of η 2 42.15 Ω is obtained. Substituting into Equation (4), the reflection coefficient is calculated as Γ 0.798 , representing a reflection of approximately 63.8% of the incident power, accompanied by a phase shift of 180 ° .
In the air–gasoline scenario, using ε r = 2.2 [3,12], the characteristic impedance is η 2 254.17 Ω . With this value, the resulting reflection coefficient is Γ 0.195 , corresponding to approximately 3.8%, of the incident power being reflected. This indicates greater coupling at this interface due to the low permittivity of gasoline.
For the air–mixture case, a mixture consisting of 1.5 L of water and 1.4 L of gasoline was considered, corresponding to a volumetric fraction of water ρ = 0.52 . Using the model to calculate the effective permittivity according to Equation (9), and the values ε w = 80 , ε g = 2.2 [3,7,12], an effective permittivity ε m 16.01 , was obtained, resulting in an impedance of η 2 94.22 Ω . In this scenario, the reflection coefficient is Γ 0.600 , equivalent to a reflected power of approximately 36.0%, all of these characteristics are summarized in Table 1.

2.6. Estimation of the Reflection Coefficient

The estimation of the reflection coefficient Γ in this study is based on comparing the signal measured under ideal conditions (without a liquid interface) and the signal recorded when the electromagnetic wave interacts with a liquid medium. This comparison allows evaluating how much of the incident signal is reflected by the air–liquid interface, directly translating into observable attenuation in the amplitude of the received signal.

2.7. Theoretical Reference Model: Free-Space Propagation

To establish a baseline, Scenario 1 (Line of Sight (LOS) condition, without obstacles or liquids), is considered, in which propagation occurs exclusively through air, and the received power is modeled using Friis (11); in this context, the measured amplitude serves as the reference. When a liquid (water, gasoline, or mixture) is introduced into the reflected path, part of the signal is reflected at the air–liquid interface, while another portion can be transmitted and attenuated as it travels through the medium. This interaction is described by the reflection coefficient Γ , defined in terms of the characteristic impedances of air ( η 1 ) and the liquid ( η 2 ), according to Equation (4). In terms of power, the reflected fraction corresponds to | Γ | 2 ; thus, by comparing the amplitude received with liquid ( A liq ) against the reference amplitude in air ( A ref ), it is possible to experimentally estimate the magnitude of Γ , under the assumption that other losses remain constant between scenarios [4,5]. The total amplitude received in each case includes both distance-based attenuation (according to Friis) and losses introduced by reflection; therefore, the ratio between these amplitudes allows for an estimation of the reflection coefficient [4].
A liq A ref = 1 + Γ
However, for a wave completely reflected with an opposite phase (as occurs in the case of water), the contribution of the reflected and direct signals can produce destructive interference. Due to this, a more general model is used, considering that the received signal is the superposition of the direct (attenuated) component and the reflected component [4,5]:
A liq = A ref · | 1 + Γ |
By rearranging terms, the value of | Γ | can be experimentally estimated as [5]:
| Γ | = A liq A ref 1
In Equations (18)–(20), | Γ | represents the magnitude of the reflection coefficient at the air–liquid interface. The term A liq corresponds to the amplitude of the signal measured experimentally when the wave has interacted with the liquid, while A ref is the reference amplitude, i.e., the amplitude of the signal received under free-space propagation conditions, without any material present that generates reflection.
On the other hand, although the reflection coefficient is a complex quantity (including magnitude and phase angle), this estimation assumes that the imaginary part (associated with the phase shift) has a negligible effect for the analyzed liquids. This is because, for non-conductive dielectric materials such as water and gasoline, the main contribution of Γ lies in its magnitude, and the phase angle remains nearly constant or minimally influential in the energy analysis. Therefore, only the estimation of | Γ | is considered.
Water contamination by gasoline is a significant issue for water quality, and traditional detection methods based on chemical analysis are often costly, slow, and require specialized personnel [13]. As an alternative, the use of electromagnetic waves in the UHF range (1.9–2.6 GHz) offers a fast and non-invasive solution due to their sensitivity to changes in the dielectric properties of media.
The study of electromagnetic wave propagation in liquids and mixtures is crucial for applications such as sensors, communications, and environmental monitoring. Liquids possess specific dielectric and conductive properties that influence phenomena such as reflection, absorption, and transmission of energy. Previous research has explored the use of microwave spectroscopy and planar sensors for contaminant detection [14,15,16], although many of these technologies remain complex or inaccessible.

3. Equipment and Methodology

3.1. Experimental Methodology

3.1.1. Description of the Experimental System

The experimental system was designed to ensure repeatable measurements in a controlled environment. Two omnidirectional SmartQ 1140.26 SMA antennas (manufactured by Smarteq Wireless, headquartered in Kista, Sweden, with production in Taiwan) [17] were used as both transmitter and receiver. These antennas operate in the UHF frequency ranges of 790–960 MHz and 1710–2690 MHz. These antennas were mounted facing each other on rigid tripods, separated by a distance of 1.05 m and positioned at a height of 63.8 cm. This configuration provided a propagation channel free of obstructions. The general setup is illustrated in Figure 3.
The transmission signal was generated using a sinusoidal signal generator (MG3691C fabricated by Anritsu Corporation in Atsugi, Japan) [18], operating within the established frequency range. This signal was divided using an RF splitter, sending one copy to channel 1 of a digital oscilloscope (MSOX6004A fabricated by Keysight Technologies in Santa Rosa, CA, USA) [19] as a reference, and another to the transmitting antenna. At the receiving end, the signal captured by the antenna was routed to channel 2 of the same oscilloscope via coaxial cabling, enabling direct comparison with the original signal.
A portable spectrum analyzer (MS2711E fabricated by Anritsu Corporation in Atsugi, Japan) [20] was used to verify the emission and spectral integrity throughout the system. All connections were made using low-loss coaxial cables, including 5D-2W (fabricated by Fujikura Ltd. in Tokyo, Japan) [21] and RG-174 cables (coaxial cable manufactured by Belden Inc. in Richmond, Indiana, USA.) [22], along with type N, SMA, and BNC adapters, ensuring a consistent impedance of 50 Ω across the entire network. This configuration enabled simultaneous and precise visualization of both transmitted and received signals. Additional characteristics of the experimental setup are illustrated in Figure 4.

3.1.2. Physical Details of the Measurement Scenario and System Limitations

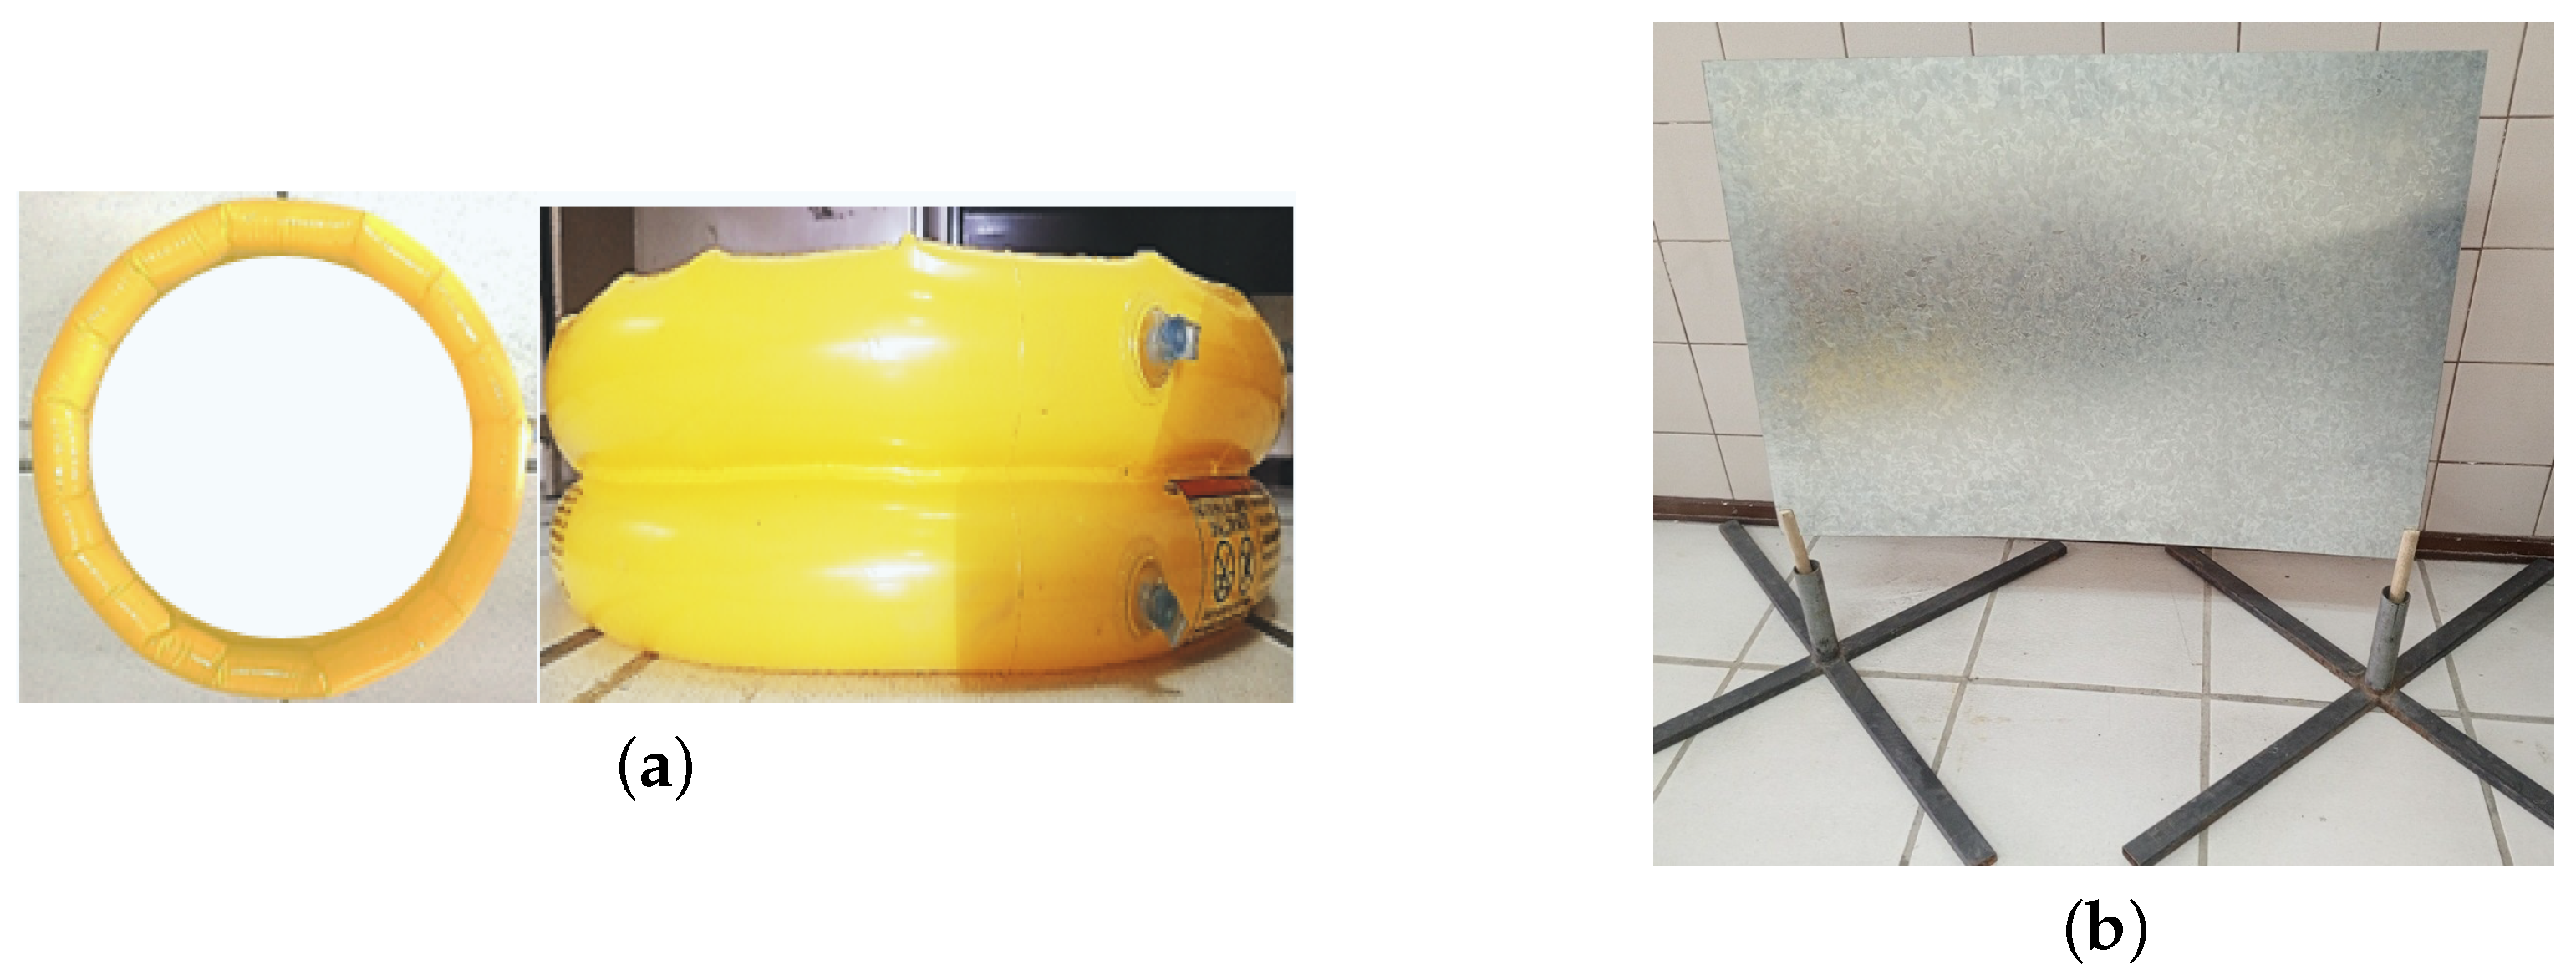
The propagation environment was arranged in an unobstructed free-space area, incorporating a circular vinyl pool and a metal plate as key analysis elements. The pool, positioned at the center of the transmission path, served as a container for water, gasoline, and their mixture. This inflatable model (Intex brand) has a diameter of 24.02 cm, a height of 5.91 cm, and a total capacity of 17 L, providing stable and repeatable conditions during the tests. This element is shown in Figure 5a.
Additionally, an aluminum plate (99.3 cm × 70.8 cm × 1 mm) was positioned at a height of 27.8 cm above the ground, obstructing the line-of-sight between the antennas. This element is shown in Figure 5b. This arrangement enabled the analysis of indirect propagation paths caused by reflection and diffraction over the interposed materials.
The precise alignment of antennas, pool, and metallic plate was verified using measuring instruments to ensure reproducible conditions and mechanical stability throughout the experiments. Although the tests were not conducted in an anechoic chamber, the setup was designed to minimize interference, multipath propagation, and ambient noise. For the theoretical analysis, certain simplifications were adopted, such as neglecting losses in the RF splitter and adapters, assuming ideal splitting and negligible mismatches. Likewise, the model considers only the direct or primary reflected signal, excluding multipath effects, thereby focusing the study on the dielectric influence of the interposed medium.

4. Experimental Scenarios

4.1. Scenario 1: Direct Transmission at Fixed Distance with Frequency Sweep

In Scenario 1, a direct transmission was established between antennas separated by 1.05 m, with no obstacles or interposed media, in order to characterize the free-space channel. A frequency sweep was performed from 1.90 to 2.60 GHz, recording the amplitude and phase of the received signal at 15 frequencies. This configuration provides the baseline reference to assess the effects subsequently introduced by water, gasoline, or their mixtures.

4.2. Scenario 2: Direct Transmission at Multiple Distances and Frequencies

Scenario 2 maintained free-space propagation, but the distance between antennas was varied to analyze attenuation and phase shift as a function of path length. The system response was measured at six discrete UHF frequencies (1.90, 1.95, 2.20, 2.25, 2.55, and 2.60 GHz) across five different distances: 0.40 m, 0.75 m, 0.90 m, 1.10 m, and 1.20 m. In all cases, both antennas were placed at a constant height of 62.6 cm. These measurements enabled validation of the Friis transmission model, as well as evaluation of antenna directivity and potential off-axis losses.

4.3. Scenario 3: Transmission with Obstruction and Pool with Pure Water

Scenario 3 replicated the configuration of the first case but intentionally blocked the direct line of sight using a metallic plate positioned midway between the antennas (52.5 cm from each). A circular pool containing 3 L of water was placed directly below the center of the plate, aligned with the propagation axis. This arrangement generated a signal reflected from the plate and an additional component that interacted with the water surface, allowing the study of the dielectric influence of the aqueous medium on indirect propagation.

4.4. Scenario 4: Transmission with Obstruction and Pool with Pure Gasoline

Scenario 4 maintained the same geometric configuration as the previous case, with antennas separated by 1.05 m and a metallic plate blocking the line of sight 30 cm above the ground. In this case, the pool located below the plate was filled with 2.6 L of commercial gasoline. The objective was to evaluate the effect of a dielectric medium different from water—featuring lower permittivity and higher conductive loss—on the propagation of reflected UHF signals. The same frequency sweeps were performed, recording amplitude and phase variations to compare them with the behavior observed in the presence of water.

4.5. Scenario 5: Transmission with Obstruction and Pool with Water–Gasoline Mixture

The fifth and final scenario replicated the previous configurations, with antennas separated by 1.05 m, a metallic plate suspended 30 cm above the ground at the midpoint, and a circular pool located underneath. This time, the pool was filled with a homogeneous mixture of 1.5 L of water and 1.4 L of gasoline, totaling 2.9 L. The purpose was to analyze the electromagnetic response to a mixed liquid medium, whose dielectric properties are intermediate between those of water and gasoline, thereby representing a realistic scenario of hydrocarbon contamination.
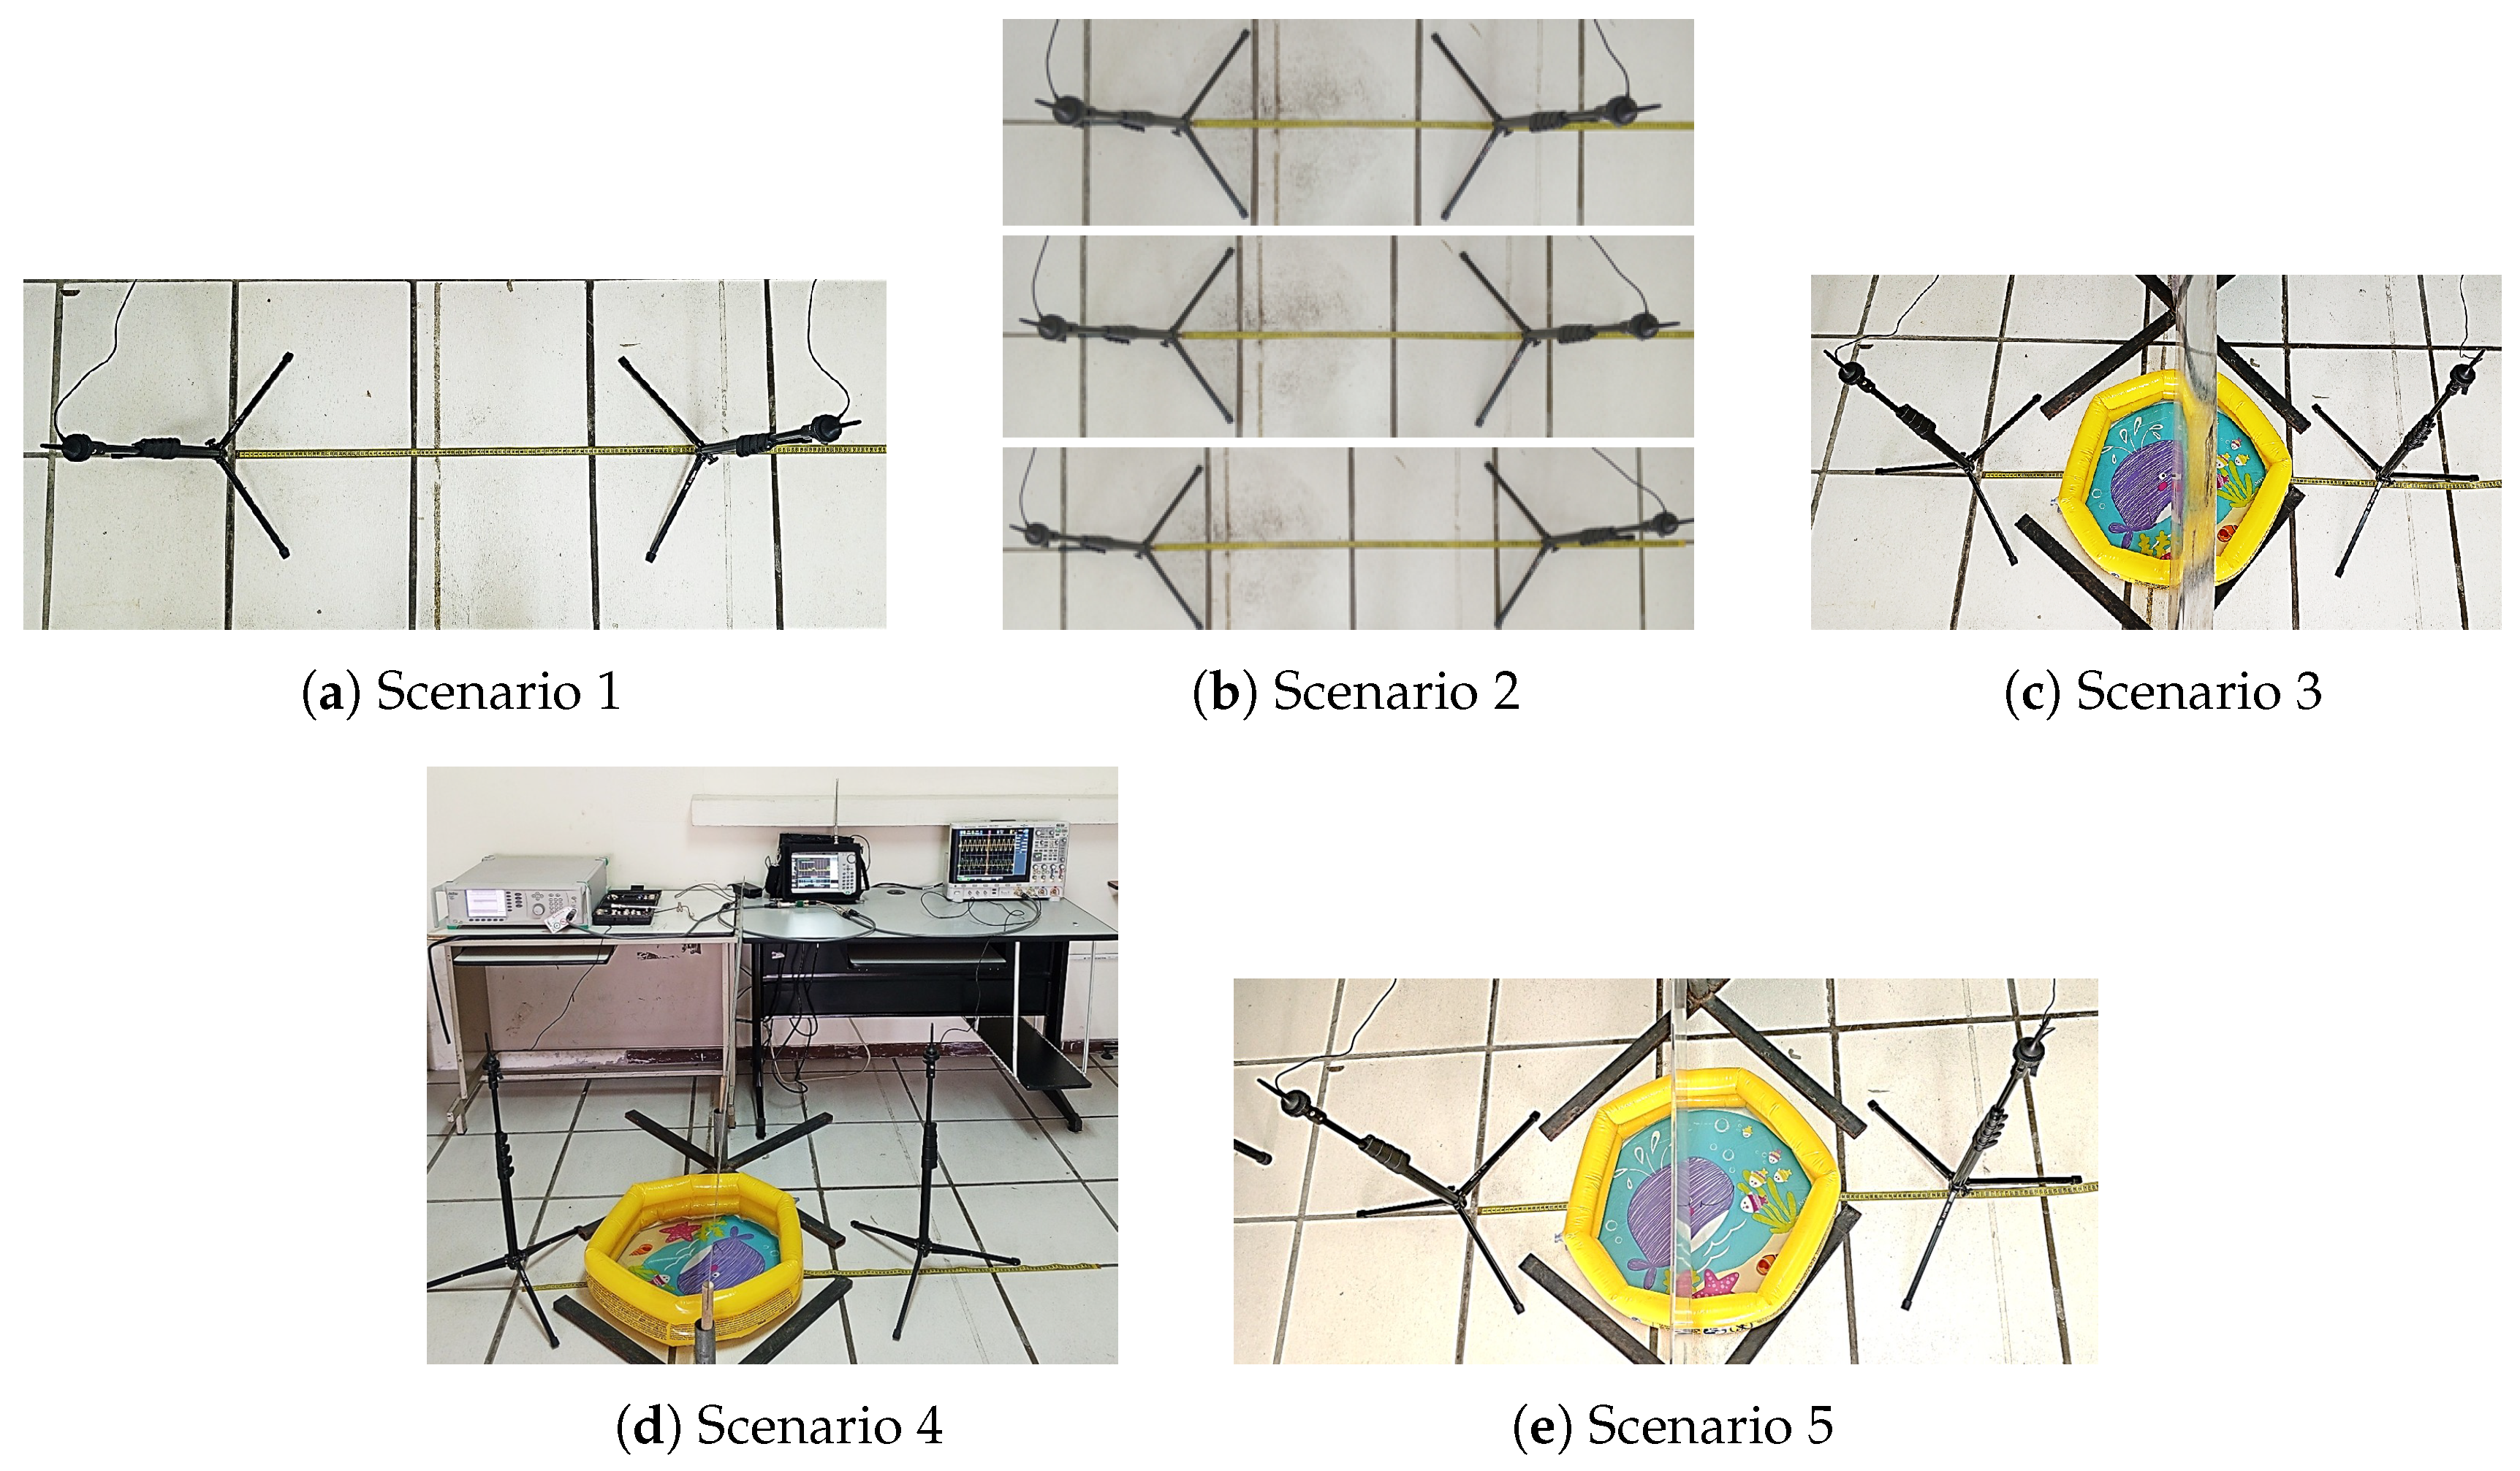
A visualization of the five scenarios is presented in Figure 6, while Table 2 summarizes the test conditions for each scenario.

5. Results

This section presents the results obtained in the five experimental scenarios defined to evaluate electromagnetic signal propagation under different conditions. Three main parameters are analyzed: the amplitude of the received signal, the phase shift (expressed in terms of time delay), and the reflection coefficient. The interpretation is carried out considering the distance, the type of interposed medium (air, water, gasoline, or mixture), as well as the transmission geometry.

Analysis of the Scenarios and Experimental Estimation of the Reflection Coefficient

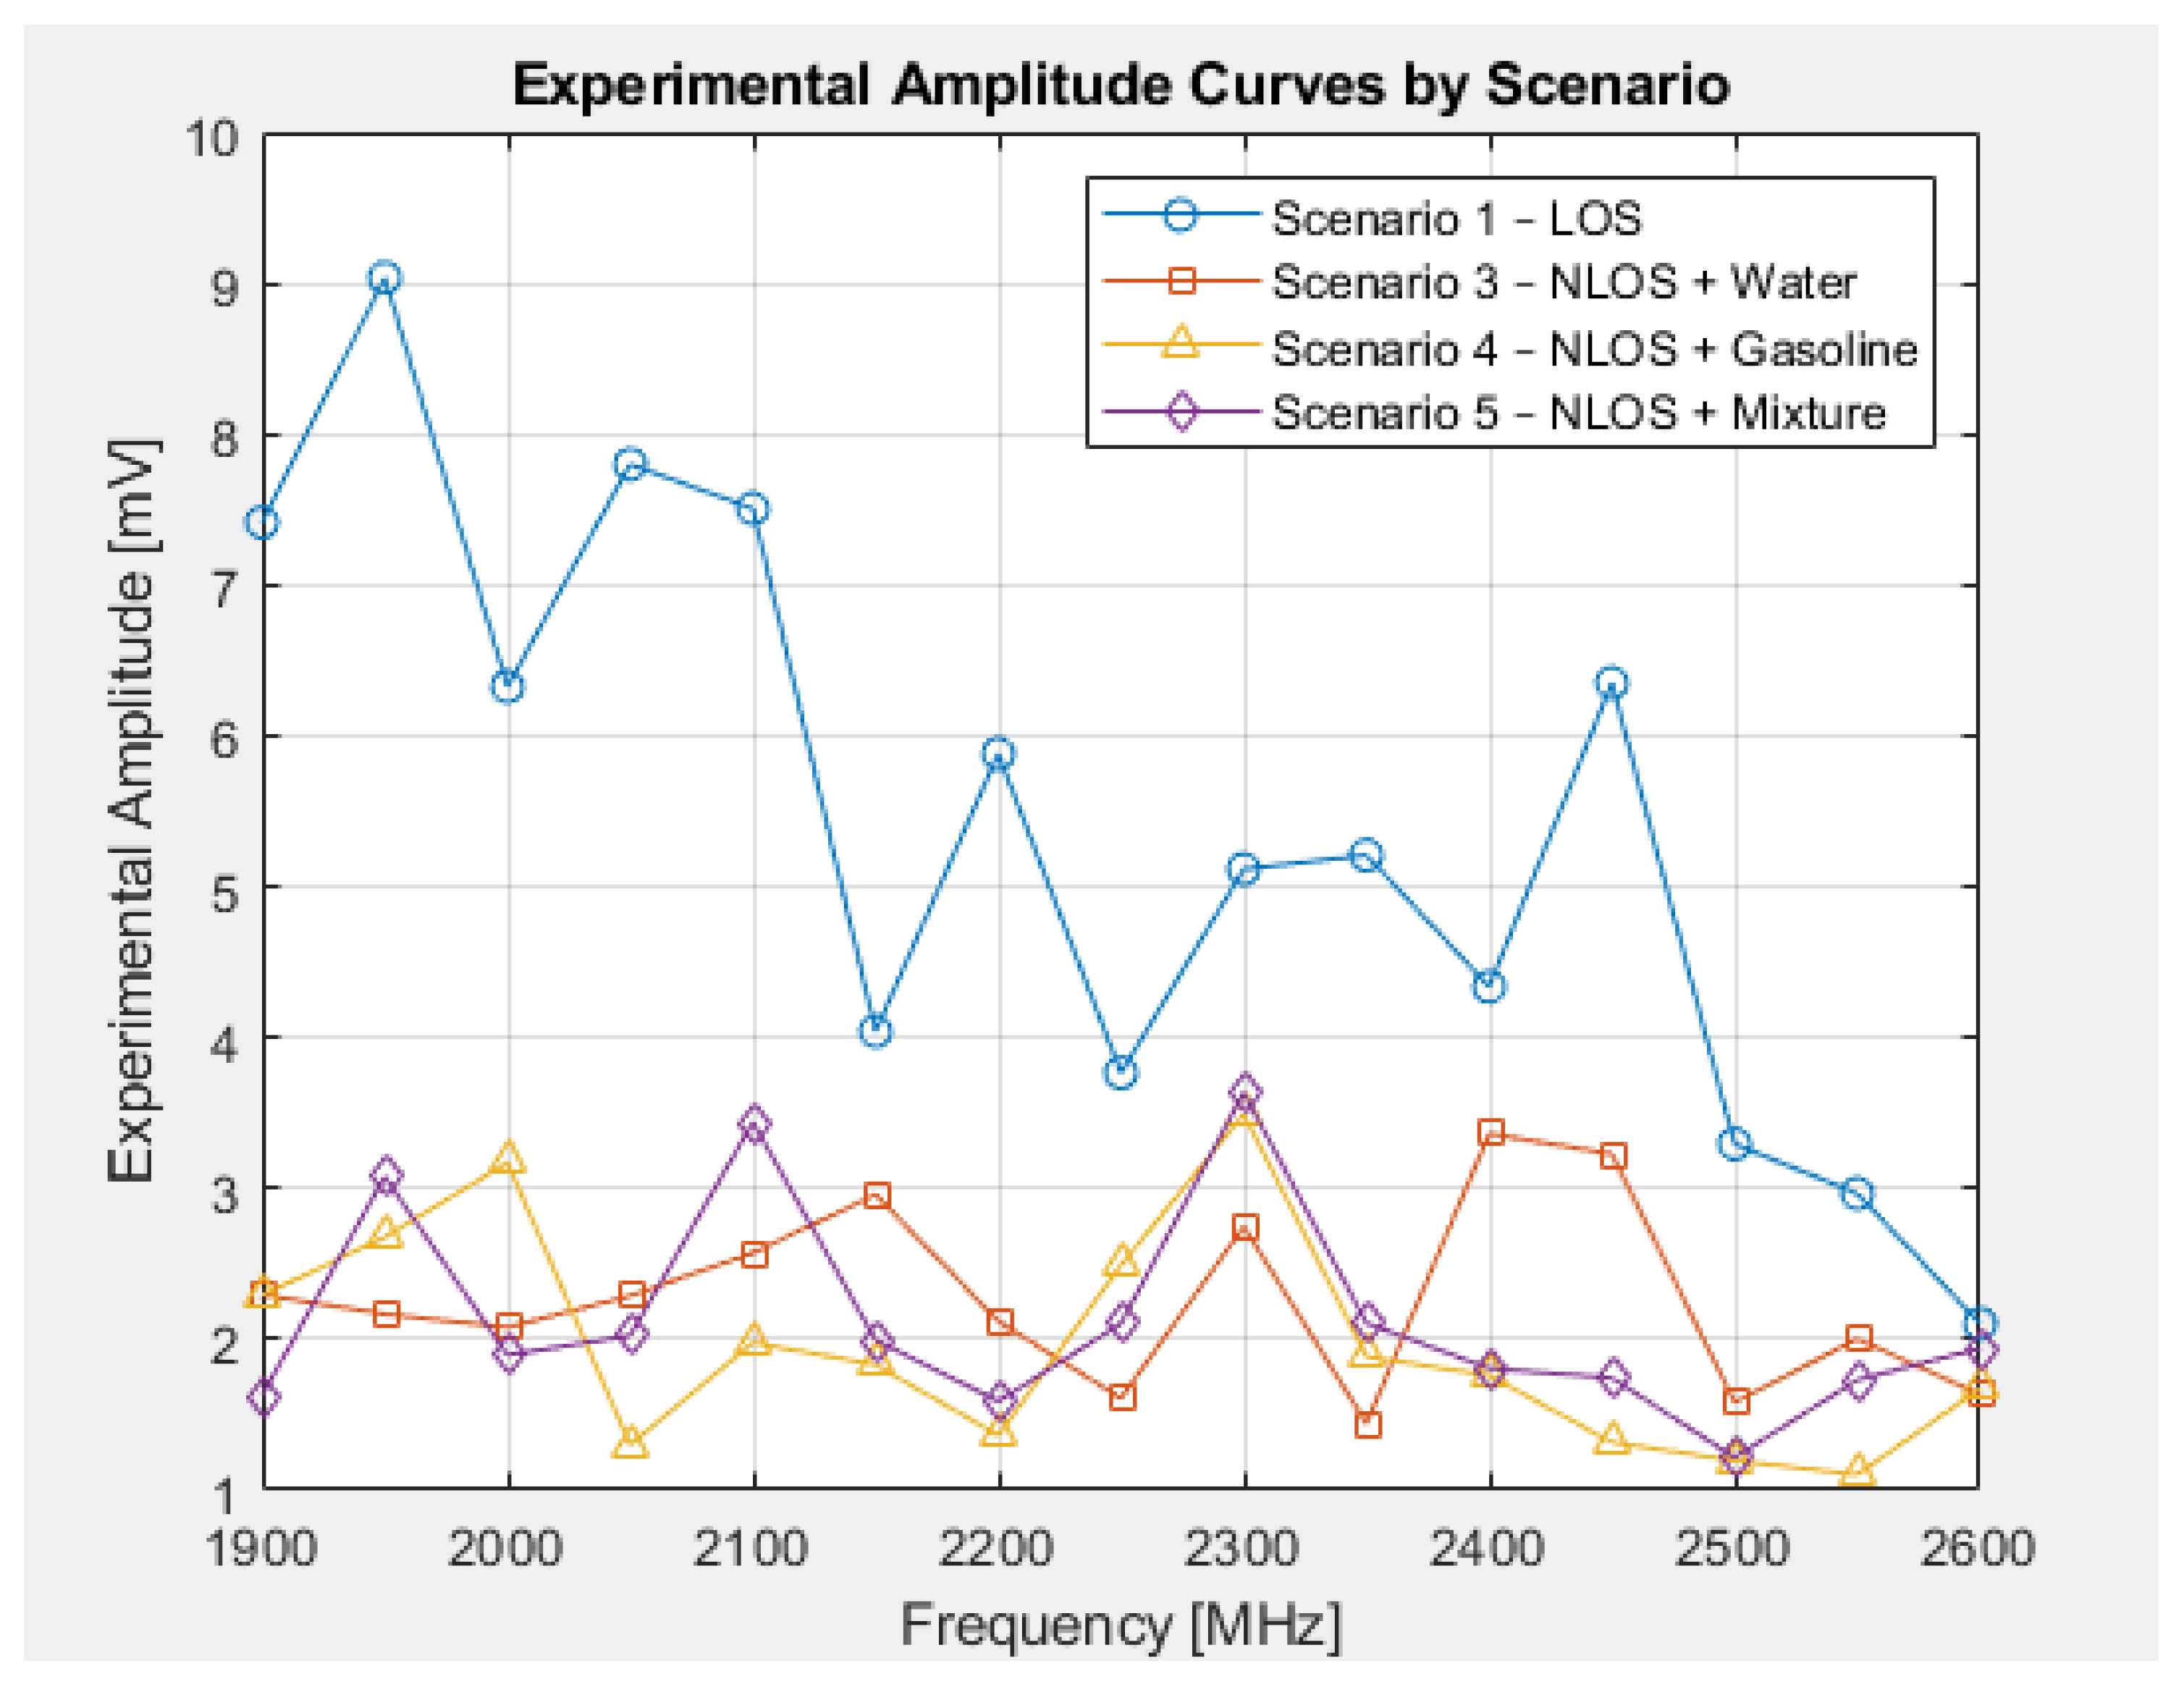
Based on the analyzed scenarios and Figure 7 and Figure 8, it can be observed that the line-of-sight (LOS) case, corresponding to Scenario 1, exhibits, as expected, the lowest level of amplitude loss, since propagation occurs without obstructions or interaction with reflective media. However, when comparing Scenarios 3, 4, and 5, a very similar trend is evident in the loss levels when water, gasoline, and the water–gasoline mixture act as reflective media. This suggests that, although the mixture should exhibit an intermediate effective permittivity according to the estimation based on Equation (9), its electromagnetic behavior tends to approximate that of pure gasoline, although it should not be regarded as identical under the experimental conditions.
This similarity may be attributed to the dielectric dominance of the non-polar component in the mixture, partial phase segregation within the container, or nonlinear effects in the wave–mixture interaction. Consequently, the mixture does not reflect an idealized average behavior but is instead conditioned by the dynamic and microstructural properties of the liquid system, highlighting the complexity of modeling composite media in electromagnetic propagation scenarios [1,12,16].
Although the water–gasoline mixture exhibited an overall response that tended to approximate that of pure gasoline, the experimental data revealed deviations in both amplitude stability and phase variability. These differences can be reasonably explained by the intrinsic heterogeneity of the mixture, where partial phase separation and non-uniform dielectric interfaces may arise despite apparent homogenization. Furthermore, semi-empirical mixing models estimate an effective permittivity, but they do not fully capture the microstructural dynamics of two-phase systems, especially at the liquid–liquid boundary. As a result, the mixture should not be regarded as behaving identically to gasoline, but rather as an intermediate and more complex case conditioned by interfacial effects and local composition gradients.
Similarly, for the case of water, a more differentiated trend is observed, although certain similarities with the results obtained for pure gasoline and the mixture are maintained. This indicates that pure water introduces more pronounced effects on propagation, especially in terms of attenuation and phase variation.
This behavior is attributed to water’s higher relative permittivity and elevated conductivity, which result in greater absorption and scattering of the incident signal. In contrast to gasoline, which exhibits a weaker interaction with electromagnetic waves in the UHF range, water acts as a strongly dielectric and partially conductive medium, significantly affecting both the amplitude and phase shift of the signal. These results demonstrate that pure water represents a case of high interaction, whereas gasoline and the mixture tend to fall into a category of lesser electromagnetic impact.
Regarding the variability observed in each scenario, Figure 7 and Figure 8 show that, in the case of the mixture, the experimental amplitudes are closer to the theoretical values, suggesting lower dispersion. This characteristic could be exploited as an indicator for analyzing the level of contaminants present in a liquid, given its relative stability.
On the other hand, with respect to phase, it is observed that the only scenario with a relatively predictable trend is the one with line-of-sight (LOS). In contrast, all scenarios involving pure liquids and mixtures exhibit high variability in phase, indicating greater sensitivity to environmental conditions. This is possibly attributable to changes in refraction, internal reflections, and the complex dielectric properties of the involved media, as is the case with the mixture.
From the experimental amplitude data, the modulus of the reflection coefficient | Γ | was estimated for the scenarios involving dielectric reflective media (water, gasoline, and mixture) under normal incidence conditions. It is important to note that, under oblique incidence, both the magnitude and phase of the reflection coefficient would be expected to change, due to the angular dependence of this parameter according to the polarization of the incident wave (TE or TM). In particular, more pronounced differences could be observed when the angle of incidence approaches the Brewster angle or in the presence of total internal reflection conditions, thus altering the amount of reflected energy. In this study, the reflection coefficient was estimated based on expression (20), considering the relationship between measured and theoretical amplitudes under controlled laboratory and normal incidence conditions.
Table 3 presents the average reflection coefficient values obtained for each analyzed medium. It can be seen that the average value of | Γ | is very similar in all three cases, resulting in comparable levels of reflected power for the three liquids. This similarity explains why the experimentally observed amplitudes show a common trend among the scenarios with water, gasoline, and the mixture.
Furthermore, considering the average experimental phase shift of 198.55 degrees, it can be established that the losses introduced by reflection in all three cases are also similar, which results in a phase shift. This behavior is theoretically reflected in the values of the reflection coefficient shown in Table 3, where the negative signs indicate a characteristic phase change in the reflected signals.

6. Conclusions

The analysis of signal loss behavior across the different evaluated scenarios demonstrated that, in specific frequency ranges such as 2400 MHz to 2550 MHz, the amplitude of the received signal exhibits a more predictable trend. This behavior could be leveraged for applications focused on contaminant detection, since, when compared to water, the mixture shows greater loss, although still lower than that observed with pure gasoline.
The study of the average reflection coefficient in the three scenarios revealed that water, gasoline, and their mixture exhibit similar reflection levels, resulting in comparable amplitude losses. This similarity highlights that, although these liquids theoretically possess distinct dielectric properties, their experimental effects may converge due to the interaction of multiple physical factors. This suggests that, under practical conditions, the presence of mixtures or contaminants can generate responses similar to those of pure liquids.
When observing the phase shifts generated in the reflected signals, it was identified that, on average, these signals experience a phase inversion upon interacting with media such as water, gasoline, or their mixture. However, predicting the exact value of the reflected phase is complex, especially within the analyzed frequency range, where high variability was observed. This characteristic limits the precision of using phase as a single parameter for medium characterization. Nevertheless, in the range between 2450 MHz and 2600 MHz, it was observed that measurements under line-of-sight (LOS) conditions, as well as under NLOS with water and the mixture, presented convergent behavior. This suggests that at higher frequencies, the phase shift induced by the presence of liquids is less affected, possibly because higher frequencies reduce the effective interaction with the medium. This trend opens up the possibility of using phase at high frequencies as a metric for liquid analysis and classification, since water and the mixture display similar patterns, but with proportionality that could be associated with their specific dielectric properties.

Author Contributions

Conceptualization, P.L.M.; methodology, P.L.M.; validation, P.L.M. and D.F.O.; investigation, K.I.A. and G.P.B.; Formal analysis, K.I.A. and P.L.M.; Data curation, K.I.A.; writing—original draft preparation, G.P.B. and K.I.A.; writing—review and editing, G.P.B. and K.I.A. All authors have read and agreed to the published version of the manuscript.

Funding

This research received no external funding.

Institutional Review Board Statement

Not applicable.

Informed Consent Statement

Not applicable.

Data Availability Statement

The data presented in this study are available on request from the corresponding author.

Conflicts of Interest

The authors declare no conflicts of interest.

References

  1. Westerhoff, P.; Alvarez, P.J.; Kim, J.; Li, Q.; Alabastri, A.; Halas, N.J.; Villagran, D.; Zimmerman, J.; Wong, M.S. Utilizing the Broad Electromagnetic Spectrum and Unique Nanoscale Properties for Chemical-Free Water Treatment. Curr. Opin. Chem. Eng. 2021, 33, 100709. [Google Scholar] [CrossRef] [PubMed]
  2. Artemov, V. The Electrodynamics of Water and Ice; Springer Series in Chemical Physics; Springer: Cham, Switzerland, 2021; Volume 124. [Google Scholar] [CrossRef]
  3. Kremer, F.; Schönhals, A. (Eds.) Broadband Dielectric Spectroscopy; Springer: Berlin/Heidelberg, Germany, 2003. [Google Scholar] [CrossRef]
  4. Pozar, D.M. Microwave Engineering, 4th ed.; Wiley: Hoboken, NJ, USA, 2025; Available online: https://www.wiley.com/en-us/Microwave+Engineering%2C+4th+Edition-p-9781118213636 (accessed on 11 July 2025).
  5. Balanis, C.A. Advanced Engineering Electromagnetics, 2nd ed.; John Wiley & Sons: Hoboken, NJ, USA, 2012; Available online: http://ndl.ethernet.edu.et/bitstream/123456789/88007/4/Balanis-AdvancedEngineeringElectromagnetics-2012.pdf (accessed on 12 July 2025).
  6. Hernandez-Gomez, E.-S.; Olvera-Cervantes, J.L.; Corona-Chavez, A.; Corona-Vasquez, B.; Kataria, T.K.; Sosa-Morales, M.E. Detection of an emerging contaminant in water by dielectric properties in microwave range. J. Microw. Power Electromagn. Energy 2020, 54, 273–290. [Google Scholar] [CrossRef]
  7. Kong, J.A.; Ali, S.M.; Einziger, P.; Habashy, T.M.; Poh, S.Y.; Shin, R.T. Electromagnetic Wave Theory and Applications; Research Laboratory of Electronics, MIT: Cambridge, MA, USA, 1988; Available online: https://dspace.mit.edu/bitstream/handle/1721.1/57071/RLE_PR_131_02_03s_01.pdf?sequence=1 (accessed on 10 July 2025).
  8. Ishimaru, A. Electromagnetic Wave Propagation, Radiation, and Scattering: From Fundamentals to Applications; Wiley: Hoboken, NJ, USA, 2017. [Google Scholar]
  9. Shi, Q.; Xuan, X.-W.; Nie, H.-K.; Wang, Z.-Y.; Wang, W. Antenna Sensor Based on AMC Array for Contactless Detection of Water and Ethanol in Oil. IEEE Sens. J. 2021, 21, 21503–21510. [Google Scholar] [CrossRef]
  10. Balanis, C.A. Antenna Theory: Analysis and Design, 3rd ed.; John Wiley & Sons: Hoboken, NJ, USA, 2012. [Google Scholar]
  11. Kraus, J.D.; Marhefka, R.J. Antennas for All Applications; McGraw-Hill: Columbus, OH, USA, 2002. [Google Scholar]
  12. Balsbaugh, J.C.; Assaf, A.G.; Oncley, J.L. Dielectric Properties of Hydrocarbons and Hydrocarbon Oils. Ind. Eng. Chem. 1942, 34, 92–100. [Google Scholar] [CrossRef]
  13. Reina, F.; García, A.; Ibáñez, L. Determinación de las propiedades dieléctricas de los combustibles, sus mezclas y del suelo, así como su impacto en un uso eficiente de los recursos energéticos y en la determinación de la contaminación ambiental. Int. J. Manag. Sci. Oper. Res. 2019, 4, 1. [Google Scholar] [CrossRef]
  14. Abdolrazzaghi, M.; Daneshmand, M.; Iyer, A.K. Strongly Enhanced Sensitivity in Planar Microwave Sensors Based on Metamaterial Coupling. IEEE Trans. Microw. Theory Tech. 2018, 66, 1843–1855. [Google Scholar] [CrossRef]
  15. Bo, Ø.; Nyfors, E. Application of Microwave Spectroscopy for the Detection of Water Fraction and Water Salinity in Water/Oil/Gas. J.-Non-Cryst. Solids 2002, 305, 345–353. [Google Scholar] [CrossRef]
  16. Montagnier, L.; Del Giudice, E.; Aïssa, J.; Lavallee, C.; Motschwiller, S.; Capolupo, A.; Polcari, A.; Romano, P.; Tedeschi, A.; Vitiello, G. Transduction of DNA information through water and electromagnetic waves. Electromagn. Biol. Med. 2015, 34, 106–112. [Google Scholar] [CrossRef] [PubMed]
  17. SMARTEQ. 1140.26-SMA Antenna; SMARTEQ Wireless AB: Kista, Sweden, 2025; Available online: https://www.radwell.com/es-ES/Buy/SMARTEQ/SMARTEQ/1140.26-SMA (accessed on 30 July 2025).
  18. Anritsu. RF/Microwave Signal Generator MG3691C; Anritsu Corporation: Atsugi, Japan, 2025; Available online: https://www.anritsu.com/en-us/test-measurement/products/mg3690c (accessed on 30 July 2025).
  19. Keysight. MSOX6004A Mixed Signal Oscilloscope: 1 GHz – 6 GHz, 4 Analog Plus 16 Digital Channels; Keysight Technologies: Santa Rosa, CA, USA, 2025; Available online: https://www.keysight.com/us/en/product/MSOX6004A/mixed-signal-oscilloscope-1ghz-6ghz-4-analog-16-digital-channels.html (accessed on 30 July 2025).
  20. Anritsu. Spectrum Master Handheld Spectrum Analyzer MS2711E; Anritsu Corporation: Atsugi, Japan, 2025; Available online: https://www.anritsu.com/en-us/test-measurement/products/ms2711e (accessed on 30 July 2025).
  21. Fujikura Ltd. 5D-2W Coaxial Cable Specification Sheet; Fujikura Ltd.: Tokyo, Japan, 2021; Available online: https://www.fujikura-dia.co.jp/pdf/catalog/catalog-pihfc-cable.pdf (accessed on 30 July 2025).
  22. Belden Inc. RG-174 Coaxial Cable Technical Data Sheet; Belden Inc.: Richmond, IN, USA, 2019; Available online: https://catalog.belden.com/techdata/EN/8216_techdata.pdf (accessed on 30 July 2025).
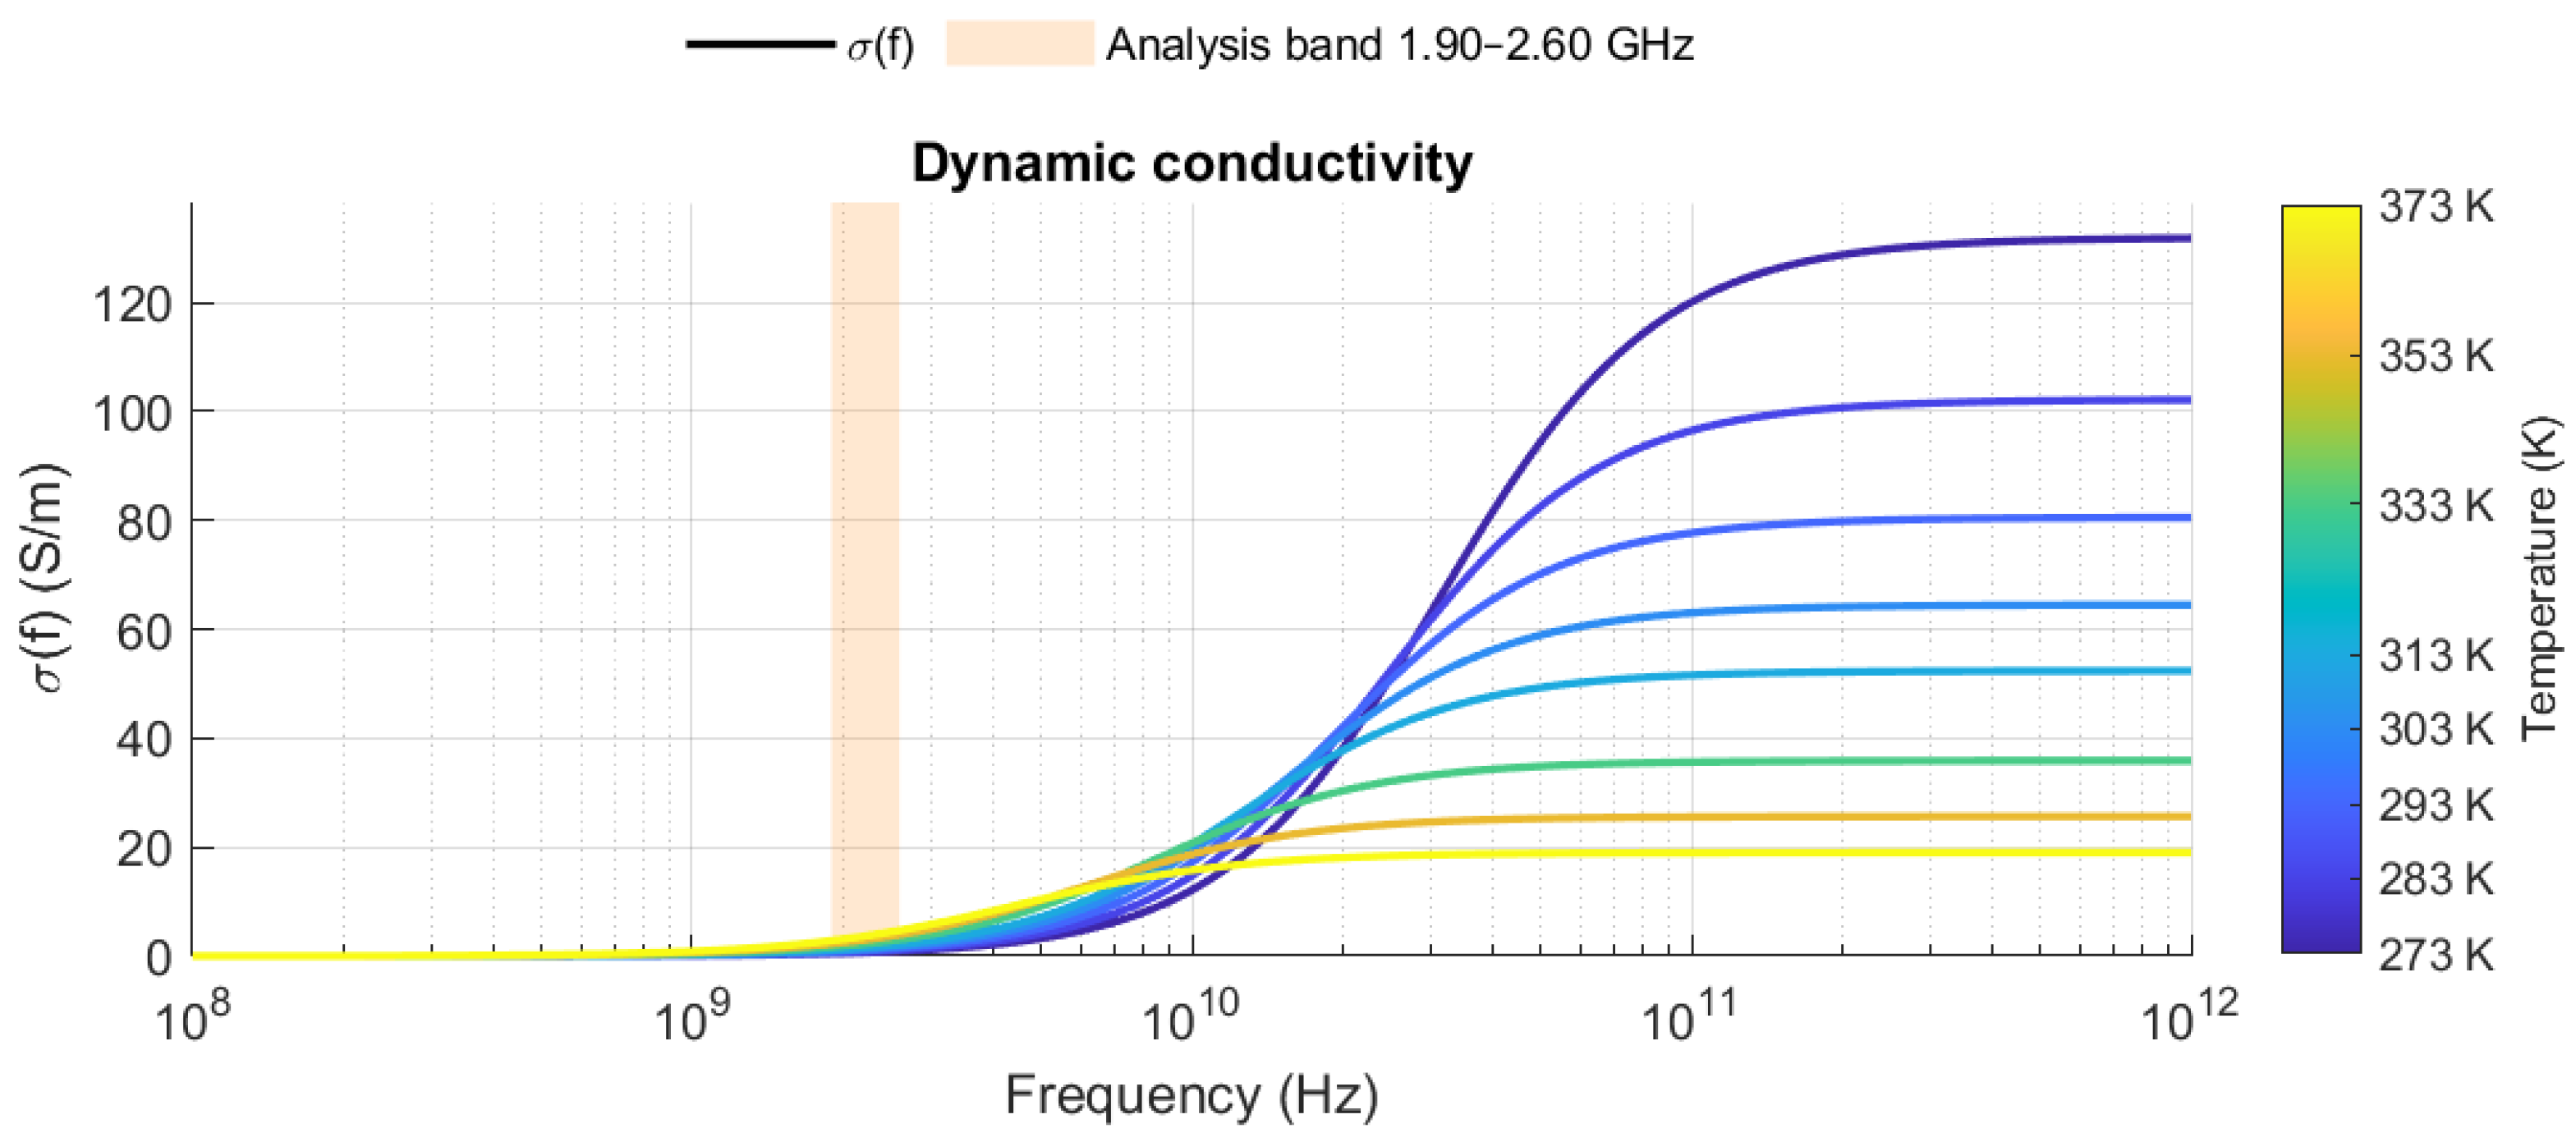
Figure 1. Dynamic conductivity of water as a function of frequency, calculated as σ ( ω ) = ω ε 0 ε ( ω ) for temperatures between 273 and 373 K.
Engproc 115 00011 g001
Figure 2. Real and imaginary parts of water permittivity ( ε , ε ) from 10 8 to 10 12 Hz for temperatures between 273 and 373 K.
Engproc 115 00011 g002
Figure 3. Connection diagram of the experimental system.
Engproc 115 00011 g003
Figure 4. Architecture of the transmission and reception system. (a) Signal splitting to the oscilloscope and transmitting antenna. (b) Simultaneous monitoring on channels 1 and 2 of the oscilloscope.
Engproc 115 00011 g004
Figure 5. Physical elements of the experimental setup: pool and metallic plate. (a) Top and side view of the test pool. (b) Metallic plate installed as an obstruction.
Engproc 115 00011 g005
Figure 6. General view of the five experimental scenarios: (a) Direct transmission at 1.05 m; (b) Distance variation; (c) Pure water; (d) Pure gasoline; (e) Water–gasoline mixture.
Engproc 115 00011 g006
Figure 7. Comparison of the amplitudes obtained in the study scenarios.
Engproc 115 00011 g007
Figure 8. Comparison of the phases obtained in the study scenarios.
Engproc 115 00011 g008
Table 1. Summary of Theoretical Reflection Coefficients for Each Interface.
Interface ε r η 2 [ Ω ] Γ Reflected Power [%]Phase Shift
Air–Water80.042.15 0.798 63.8 180 °
Air–Gasoline2.2254.17 0.195 3.8 180 °
Air–Mixture16.0194.22 0.600 36.0 180 °
Table 2. Summary of the experimental scenarios and their corresponding conditions.
ScenarioDistance (m)Sweep (GHz)ObstructionMedium
1. Direct transmission (reference)1.051.90–2.60NoneNone
2. Transmission at multiple distances0.40–1.201.90–2.60NoneNone
3. Transmission with obstruction and water pool1.051.90–2.60Metallic plate3.0 L water
4. Transmission with obstruction and gasoline pool1.051.90–2.60Metallic plate2.6 L gasoline
5. Transmission with obstruction and water–gasoline mixture1.051.90–2.60Metallic plate1.5 L water + 1.4 L gasoline
Table 3. Average Experimental Reflection Coefficient for Each Medium.
ScenarioMediumAverage | Γ |Reflected Power [%]
3Pure Water0.528927.97
4Pure Gasoline0.595035.40
5Water–Gasoline Mixture0.561131.48
Disclaimer/Publisher’s Note: The statements, opinions and data contained in all publications are solely those of the individual author(s) and contributor(s) and not of MDPI and/or the editor(s). MDPI and/or the editor(s) disclaim responsibility for any injury to people or property resulting from any ideas, methods, instructions or products referred to in the content.