Abstract
This study presents the implementation of a pull-based production system integrated with a constant work-in-process (CONWIP) approach using the Kanban Methodology in a bearing manufacturing industry. A case study on the UN 3213B bottom roller bearing was conducted, where kanban card design and quantity were determined based on average monthly demand and replenishment time. The methodology involved product-quantity (PQ) analysis, value stream mapping, and stepwise kanban system deployment. As a result of the implementation, the number of kanban cards was reduced from 48 to 38, while work-in-process (WIP) inventory decreased by approximately 20,000 units (27.79%). Replenishment time for the inner ring was reduced from 6.94 to 6.53 days and, for the outer ring, from 6.33 to 5.98 days. The safety factor dropped from 2.5 to 2.0, indicating improved process reliability. The novelty of this work lies in its practical demonstration of integrating kanban with CONWIP for real-time inventory control and lead-time reduction in a high-demand manufacturing setting, offering a scalable model for similar industries.
1. Introduction
Kanban, which means card or signal in Japanese, started in the early 1940s by the Japanese and is a more broadly recognized approach to implementing lean manufacturing principles and CONWIP (constant work-in-process). The visualization of the process from start to end is represented by using a Kanban board. WIP limits for development steps are recorded. The main aim of this method is to decrease work-in-process (WIP) levels in the factory and lead times, manufacture products as per the customer demand, and identify the effective use of material during the production processes [1]. The information required is contained by kanban, which is further utilized in the production of a product at each stage. To control production flow and inventory, the kanban card is used. Production time and work-in-process are reduced by using this system. Pull gadget is occasionally known as the Toyota production system. A kanban pull scheme uses a set of cards to keep track of WIP among every couple of terminals. The whole system, WIP, is inadequate to cover the total number of cards in each card set. Only if the raw material is accessible and the material has a card-permitting manufacturing does manufacturing take place at a workstation [2]. Kanban is a Japanese management method. Just-in-time (JIT) manufacturing is a concept and approach for smoothing and automating production lines. The number of units required marks on a tag-like card called a “kanban,” which is transmitted from employees in one process to employees in the previous phase of this approach. As a result, several processes in the plant allow for more precise control of the quantities required for varied applications. It is a working command that transfers the material. Each kanban recognizes a portion or subassembly part and specifies where they come from and where they are headed. Using this mode, kanban is a device that integrates the manufacturing unit, connects all processed ones to some other, and connects the complete value stream to the buyer demand harmoniously. A superstore holds stable quantities of raw materials, work-in-process inventory, or completed items. To guarantee the success of JIT production and generate effective movement of parts during the industrial system, the kanban system is essential [3]. This study’s main contribution lies in the practical integration of the kanban pull system with the constant work-in-process (CONWIP) approach in a real-world bearing manufacturing environment, specifically for the UN 3213B bottom roller bearing (UN Series; Publisher: NRB Bearing Limited, Jalna, Maharashtra, India-431213). Unlike prior works that are largely simulation-based, this research delivers quantifiable shop-floor results, including a 27.79% reduction in WIP inventory, a decrease in kanban cards from 48 to 38, and measurable reductions in replenishment time for both inner and outer rings. The novelty of the work is in its data-driven design of kanban parameters—based on actual demand, replenishment time studies, and optimized safety factors—demonstrating a replicable, scalable model for mid-scale manufacturing industries aiming to achieve leaner, more responsive production systems.
2. Literature Review
Kanban focuses on limiting work-in-progress (WIP), visualizing work, and maximizing efficiency. Kanban is a monitoring technique that joins manufacturing exercises and transmitted demand data from conclusive item links to the previous workplace by using kanban cards. To limit work-in-process and increase efficiency, many researchers have published their work. Previous research is also essential for the exploration of a comprehensive list of factors for the present research. For example, the queuing model is used to model the kanban production line. Further, he discussed a novel method for studying the queue model. The system’s uncertain parameters are then determined using an operating cost model [4]. Executing the kanban system by identifying an area, like a problem inflow line, controls problems in operation and flow line loading problems. The general N-stage model of the kanban-controlled sequential production system has been presented as a discrete-time Markov process [5]. The kanban system is used to study the manufacturing site flow of implementation activities. Implementing a system in the manufacturing site will reduce inventory and lead time on the floor and also optimize the store area [6]. For the serial production line, compare the effect of pull and push tactics. A serial line with a large buffer model is considered for study to check the performance of the push and pull system [7]. Performance obstacles for manufacturing are analyzed while implementing just-in-time and compared with batch production. In the fields of electronic usage, scheduling, and dependency on coworkers and training, JIT employees saw more challenges than batch employees [8]. For monitoring manufacturing systems, a hybrid approach of push/pull is proposed with a general N-stage, a hybrid model. The proposed model is then compared with Materials Requirements Planning (MRP)-based approaches and finds many advantages over the MRP approach [9]. The basic Toyota system is discussed, along with the different methodologies and various kanban systems overview. Kanban systems are not a one-size-fits-all solution to all manufacturing issues. However, it can be used in a repetitive manufacturing environment [10]. Inventory management is an essential part of the manufacturing industry. An intelligent inventory management system is successfully developed. Based on the present inventory data, this system is capable of obtaining historical data. For management inventory, it also identifies demand patterns [11]. Variation of different kanban systems are considered and categorized; each variation’s action differences from the original kanban system are identified. An overview of the literature is presented based on the variation of the kanban system [12]. Important aspects of kanban are vendor participation, top management commitment, inventory management, and improvement in the quality found after implementing the kanban system in various enterprises in Malaysia. To figure out how well the kanban scheme functions in a global corporation [13], simulation and comparative studies of the performance of push and pull systems are presented. Observation shows that with nominal WIP, a pull system is always good but less capable than a push system, particularly at a higher coefficient of variation [14]. Lean implementation process with value stream mapping (VSM) is shown, discussing lean implementation in manufacturing industries. VSM process symbols are utilized. Literature is based on the execution of lean systems in the manufacturing industry and their benefits [15]. Successfully examine the behavior of push and pull manufacturing systems. In this study, three conjectures are considered, and an analysis of these conjectures is completed for the analytical model. A hybrid approach is presented, which is more beneficial as compared to the original system, like kanban [16]. Successfully apply the theory of constraints (TOC) and drum buffer rope (DBR) for organization capacity planning [17,18]. Particle swarm optimization (PSO) and biological swarm intelligence are applied to model material flow. A kanban system combined with a milk run system is used for modeling [19,20]. For implementing high-performing Lean Automation (LA), examine the pathways by using the Industry 4.0 disruptive digital technology approach [21,22]. The Systems Thinking approach for executing kanban in business organizations is applied. Various practices involved in the kanban system, such as class of service, visualization, etc., are described and implemented [23]. The milk run system and IT-based Kanban, combined with artificial intelligence, are applied to the multi-line assembly shop floor. A significant improvement in lead time, material handling time, and work-in-process has been found after implementation [24,25]. A two-card kanban system, coupled with a value stream map for an electrical-based company, is applied [26,27]. A reflection of CONWIP implementation over the past 30 years has been completed and reported several issues and misunderstandings [28,29]. Authors determine the crucial factor for effective lean execution [30,31,32]. Due to the many advantages of the Kanban Method, which can be applied in manufacturing companies, from the literature, it was determined to be adequate. To reduce the number of kanban cards, replenishment time, and inventory, a case study has been completed in this work, which in turn will simplify the overall manufacturing process of a bearing industry. It will also manage overproduction stocks, will reduce production losses, and improve safety factors.
The reviewed literature provides a broad foundation on the application of kanban, CONWIP, and hybrid push-pull systems in various manufacturing environments. Prior studies have established the effectiveness of kanban in reducing WIP, improving production flow, and enabling JIT manufacturing. For example, several works have modeled kanban-controlled systems using queuing theory and Markov chains to analyze performance under uncertain parameters. Others explored the integration of kanban with tools like value stream mapping, simulation, and intelligent inventory systems, often focusing on electronics or large-scale assembly lines. However, most prior studies focus on theoretical frameworks or simulation-based results, with limited real-world case studies in mid-scale bearing manufacturing. Furthermore, the literature lacks practical evidence of kanban-CONWIP integration specifically designed to reduce replenishment time and inventory while maintaining customer demand responsiveness. Few studies quantify tangible outcomes like the exact reduction in kanban cards or replenishment cycles post-implementation. This study addresses these gaps by presenting a detailed case study in a bearing manufacturing plant, where the Kanban-CONWIP system was customized and implemented. Unlike previous works, it provides quantitative improvements—such as a 27.79% reduction in WIP inventory, a decrease in kanban cards from 48 to 38, and measurable reductions in replenishment time. By grounding the analysis in actual production data, the research offers practical insights and a replicable model for similar industries seeking lean transformation.
3. Problem Definition
The problem solved by this method is concerned with the bearing manufacturing organization, NRB Bearings Limited, Jalna, Maharashtra, India–431213. The bearing under consideration is the bottom roller bearing UN 3213B [33]. For this bearing, seven components are required for final assembly, out of which only two components, inner and outer rings, are manufactured in-house; the remaining five components are brought out directly from vendors for assembly.
Figure 1 shows the process flow for the inner and outer rings. Order for raw materials goes from the production planning and control (PPC) department to the supplier. The supplier provides raw materials in general stores (GS) of the organization in ordered quantity with the required specification. For inner ring BIW 192720B, pipes of required dimension are turned on the automatic lathe. Turner rings are heat-treated in the heat treatment (HT) department at the required hardness. These hardened rings are passed to the preceding workstation for face grinding (FG). FG rings proceed for track grinding (TG) and outer diameter grinding (ODG) on the same workstation. The last operation on the inner ring before it gets converted into a finished component is bore grinding (BG). Inspection of each component is carried out on respective workstations. The finished inner ring is then ready for assembly. For outer ring BE 273223B, outsourced turned and drilled rings of the required width are taken directly from the supplier. The first operation on the ring is heat treatment carried out in the HT department. Hardened rings are forwarded for debarring to remove burrs generated during drilling. These rings are then passed for face grinding and outer diameter grinding. The last operation on the outer ring is to finish outer diameter grinding (FODG), followed by TG. Now the outer ring is ready for assembly and temporarily stored in the finished component store (FCS). The inner ring and outer ring are manufactured in-house. Along with these two components remaining, five components are supplied directly for assembly by vendors. Vendors supply holders, t-clamps, and nipples according to a given specification, while cages and needles are taken from interplant. The problems associated with this process are that WIP was increasing, monthly production was not customer-oriented, and replenishment time was longer using the push system.
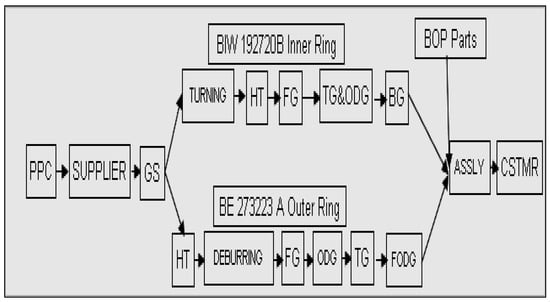
Figure 1.
Block diagram of the manufacturing process of the inner and outer ring of UN 3213B.
Figure 2 shows the increased WIP compared to the target set. The target for WIP inventory was three days, and the production system is not customer-oriented to fulfill monthly demand. WIP increased above the target after including the push system because of the additional replenishment time. Figure 3 shows the problem associated with organizations being unable to fulfill the production demand of bearings as per the market need. The average demand was 35,000 per month; the organization faces issues in satisfying the demand when the requirement for a month is above 45,000.
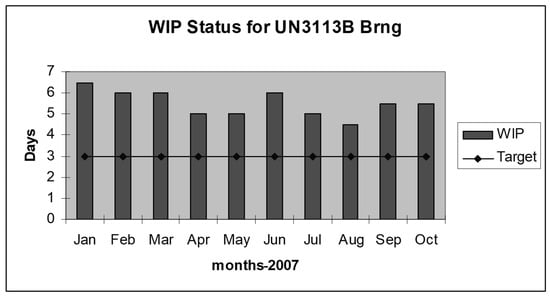
Figure 2.
WIP inventory status.
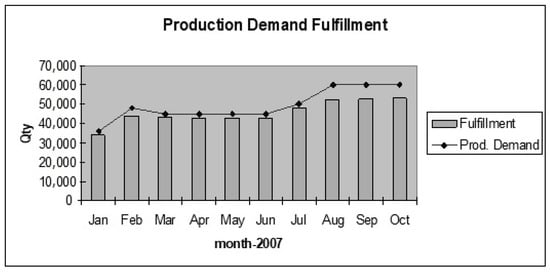
Figure 3.
Production demand fulfillment.
4. Methodology
4.1. Kanban and Supermarket-Pull System by Kanban
In a kanban pull system, the demand method generates only the appropriate units to exchange with the units that have been removed by the downstream method. Labor from one practice returns to the previous practice to retrieve the essential part. They just do this in the amounts and at the times that the units are required. The buyer’s order is the starting point for the removal scheme. This is referred to as a pull method. The consumer withdraws parts from the full buffer; then the source refills the buffer with consumed parts. Buyers buy goods in the supermarket, already on the shelves, and the shelves are replenished as customers pull the items from the shelf. This technique, when applied to lean manufacturing, reverses the large-lot push system of generating goods based on a forecast of planned sales.
In this work, the design of kanban has been prepared for the implementation of the kanban system. The main objective of the design is reducing the number of kanban cards and improving.
4.2. KanbanDesign
Design the production of inner and outer ring bearings and reduction in lead-time. Two main parameters, like lot size and number of kanban cards, are essential for the implementation of kanban. The design of the kanban system includes the determination of kanban size and the number of kanban cards to flow in the production process. This methodology is limited only to controlling the WIP inventory in the manufacturing process flow before final assembly. To design, first of all, the daily requirement of the final assembled product must be known. That can be found by taking the average demand for the last 11-month demand (in this case). The next task is finding out the replenishment time of components, where temporary storage (supermarket in this case) is to be maintained. Estimate the number of cards for CONWIP to evaluate the number of cards required to control a CONWIP system for a pull system.
where PR equals production requirement/day, RT equals replenish time, and α equals safety factor.
Inventory Level = PR × RT × (1 + α)
No. of Kanban (K) = ((Inventory Level)⁄(lot size))
To design the kanban system for controlling work-in-process (WIP) in the bearing manufacturing process, the following standard formula was used to determine the number of kanban cards required:
where:
- D = average daily demand for the product (units/day);
- RT = replenishment time, i.e., the total lead time to produce and restock the item (in days);
- α = safety factor, accounting for uncertainties like machine breakdowns or demand fluctuations (typically 10–50%);
- Q = lot size or container size, i.e., the number of units a single kanban card authorizes.
This formula ensures that production is aligned with actual consumption while providing a buffer for variability. In the present study, historical demand data over 11 months was used to calculate D, and detailed time studies were conducted to measure RT across each stage. The safety factor α was iteratively refined based on observed machine reliability and demand fluctuations during initial implementation.
For the UN 3213B bearing:
- D = 1167 units/day (based on monthly demand of ~35,000 units);
- RT for the inner ring = 6.94 to 6.53 days (after improvement);
- Q = 2000 units/card (standard container size);
- α initially = 2.5, later optimized to 2.0 after process stabilization.
By applying this formula, the number of kanban cards was reduced from 48 to 38, reflecting better inventory control and process efficiency. This detailed and data-driven approach supports a leaner, more responsive production system.
4.3. Select Process/Part
The selection of parts to implement the kanban system can be done based on a PQ (product-quantity) analysis basis. This technique utilizes past data of customer demand to conduct data analysis, which is collected from the selected process and analyzed to take the further decision of implementation. This includes changeover time, cycle time, and utilization of each machine involved in the process. With the use of collected data, calculate the replenishment time.
4.4. Analyze and Design the Kanban Size
Figure 4 shows the value stream map and kanban card movement for the inner and outer rings of the UN 3213B bottom roller bearing. A supermarket is used to store inventory. Material is the flow for both the bearings stored near the production line whenever there is a need. Material is accessible, and inventory is managed. A value-added time (VAT) and non-value added time (NVAT) have been calculated from the above stream map for the inner and outer UN3213B bottom roller bearing. In the implementation of this system, following stages come. The data collected in phase 2 can be used to complete this step. In this phase, the number of kanban cards to be flown in the process is determined. This includes consideration of replenishment time, daily requirements of the assembly department, and safety factors to compensate for the breakdown of machines. Implementation of the kanban system to achieve CONWIP inventory includes locating the area of the supermarket and kanban posts on each machine and training associates.
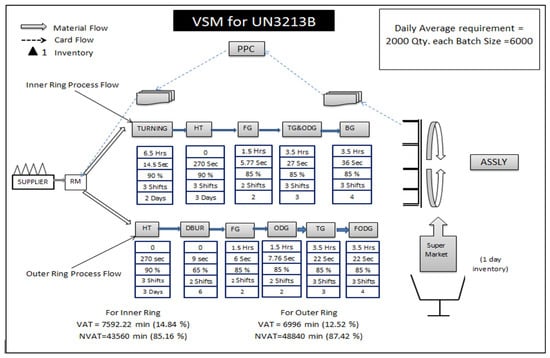
Figure 4.
Kanban card movements for the inner and outer ring of UN 3213B bottom roller bearing.
In the last phase after the preparation of the design, the kanban flow must be started after training associates. The loops for the kanban are to be fixed before. Discipline and understanding of the kanban system are important factors in such situations.
After starting the kanban flow in the process, cross-checking it is the next activity to note down the hurdles while doing it. To do so, an audit team is to be formed, which includes experts from different fields. The suggestions of the auditor are to be noted for further improvement. Reducing the WIP inventory and replenishment time (RT) is the only way. As we reduce the RT, the scope of reduction of kanban cards increases. As the number of kanban cards decreases in the process, WIP inventory is reduced. RT can be reduced by decreasing the waiting time of components before production and reducing the changeover times of the machines.
Replenishment time (RT) data in this study were measured directly on the shop floor through time–motion studies rather than relying solely on production records. The measurement involved tracking the complete flow of components—from the initiation of production to their availability at the assembly point—covering processing, setup/changeover, waiting, and inspection times. Observations were conducted across multiple shifts to account for variability, and production supervisors validated the timing data. Key assumptions included using an average RT across cycles, considering minor machine delays (under 30 min) as part of RT, excluding external supplier lead times, and maintaining a fixed lot size of 2000 units for kanban calculation. These steps ensured that the RT values used for system design were accurate, practical, and reflective of actual in-house operations.
5. Results and Discussion
Table 1 shows the month-wise data of kanban system parameters. As there is a reduction in RT as well, an improvement in safety factors inventory reduction is also bound to happen; this is a required result of the kanban system. The number of kanbans is reduced from 48 to 38. The size of one kanban card is 2000 Qty., so almost 20,000 Qty. WIP inventory is reduced. There are other benefits also bound to this improvement.

Table 1.
Improvement in RT, safety factor (α), and number of kanbans over time.
In this study, the dataset comprises 11 months of historical demand data for the UN 3213B bottom roller bearing, along with time–motion measurements of replenishment times for the inner and outer rings. Additional data include lot sizes, safety factors, machine changeover times, and production cycle times collected directly from shop-floor observations and production records. This dataset was used for kanban parameter calculations, such as determining the number of cards, daily production requirements, and inventory levels, forming the basis for the case study’s analysis and results.
Figure 5 shows the problem associated with the organization related to quantity-wise fulfillment achieved from the first month. The graph shows that starting from the first month, quantity-wise and type-wise requirements are fulfilled because of a reduction in replenishment time and the number of kanban cards. The kanban places excessive importance on the single within the group framework. Laborers frequently have a great deal of input about the goods they produce, and most enterprises using the kanban deliver lifetime employment. Persons who work in a plant using the kanban are very essential. The graph shows that the percentage fulfillment for both quantity-wise and type-wise demand remains consistently close to 100% across all months, with no visible difference between the two. This indicates that after implementing the kanban-CONWIP system, the production process was able to meet not only the total required quantities but also the correct product mix without deviation. The overlap of the bars suggests balanced production planning and execution, where improvements in replenishment time and inventory control equally benefited both quantity fulfillment and product type accuracy, resulting in identical performance trends.
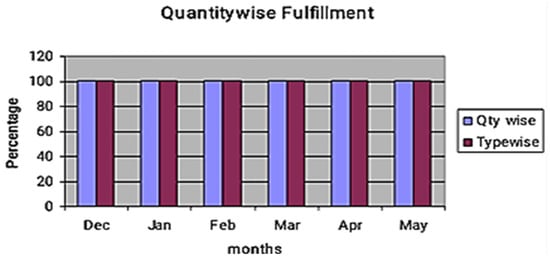
Figure 5.
Quantity-wise fulfillments.
Management and laborers believe that productivity and superiority come from persons rather than systems. Figure 6 shows a month-wise reduction in WIP inventory. The decrease in WIP inventory is more effective from the month of December 2020. This shows the effect of the kanban system to achieve CONWIP inventory.
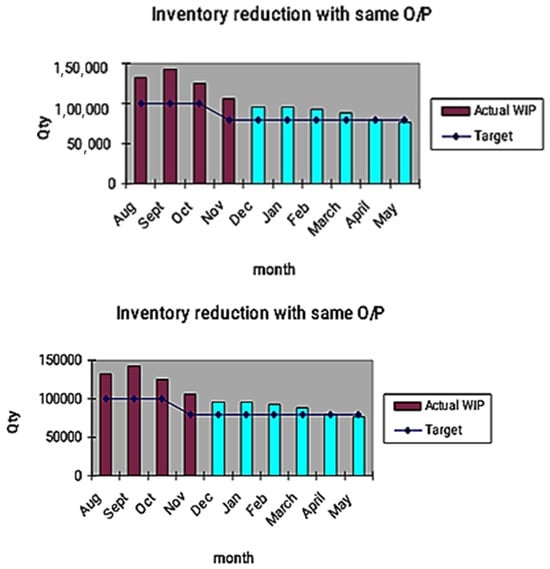
Figure 6.
WIP reduces with the same O/P.
Inventory reduction in pieces = (105,257 − 76,000) = 29,257
In percentage = 27.79%
Cost reduction = 2.04 MIR saved (approx.)
The advantages of a continuous pull system of kanban cards include a simple and visible management medium for all employees. High-frequency and cyclical orders can be realized with a limited lot using this tool. Kanban sizes with the least amount of work, increasing the value stream’s capacity to be delivered in its entirety. As a result, after the implementation of kanban with the new value stream map, the replenishment period for the inner ring of bearings decreased last month from 6.94 days to 6.53 days. The replenishment period for the outer ring was also shortened, going from 6.33 to 5.98 days. The safety factor is applied to account for demand when a machine breaks down. From 2.5 to 2.0, the safety factor decreases. Inventory reduction is a necessary outcome of the kanban system, as there will be a decrease in RT and an improvement in safety considerations.
The observed decrease in replenishment time (RT) can be attributed to several targeted process improvements implemented during the kanban-CONWIP deployment. Specifically, reduction in machine changeover times, better scheduling discipline, and elimination of idle waiting between workstations significantly streamlined the production flow. The introduction of supermarkets and clearly defined kanban loops also minimized delays in material handling and replenishment triggers. The results showed a statistically significant decrease in RT (p < 0.05), confirming that the improvement was meaningful and consistent. These findings support the effectiveness of the lean system design in driving measurable performance gains beyond random fluctuations.
The results of this case study align with and extend the findings of prior research on kanban and CONWIP systems. For instance, Sarker and Fitzsimmons [14] demonstrated that pull systems can outperform push systems in reducing WIP and lead time, though their work was simulation-based and lacked industry-specific implementation. Similarly, Naufal et al. [6] reported improved flow and inventory reduction in a Malaysian manufacturing firm using kanban but did not provide quantified reductions in replenishment time or card count. In contrast, the present study offers concrete results from a live-bearing manufacturing setup, showing a 27.79% reduction in WIP, RT reduction of 0.4 days (inner ring) and 0.35 days (outer ring), and a 21% decrease in kanban cards. Moreover, while most literature emphasizes theoretical models or electronics sectors, this study contributes a rare, data-driven application in the bearing industry, validating lean techniques in a high-precision, component-based environment. Thus, the current work strengthens the empirical foundation of kanban-CONWIP applications and offers a replicable framework for mid-scale discrete manufacturing systems.
Industry 4.0 for Organization
To strengthen the forward-looking Industry 4.0 discussion, specific digital tools can be directly linked to pain points identified in the current case study. For instance, IoT sensors could be installed on critical machines to monitor utilization, changeover time, and idle periods in real time—data that was previously collected manually for replenishment time calculation. These sensors could feed into real-time dashboards accessible to production planners and line operators, allowing instant visibility into bottlenecks or delays, thereby further reducing replenishment time beyond the current improvement from 6.94 to 6.53 days. Additionally, predictive analytics could be applied to historical demand and machine performance data to forecast production requirements and schedule maintenance proactively, minimizing unexpected downtime. The reduction in WIP inventory by 27.79% observed post-kanban implementation could be further optimized by digitally controlling inventory thresholds using smart replenishment triggers. By integrating these Industry 4.0 tools, the kanban-CONWIP system could evolve into a cyber-physical lean production system, offering higher adaptability and efficiency.
6. Conclusions
This study demonstrates the successful implementation of a kanban-CONWIP pull system in a bearing manufacturing environment, resulting in significant improvements in inventory control, production responsiveness, and process efficiency. A key takeaway is that even in traditional manufacturing setups, lean principles—when tailored using real-time operational data—can produce measurable gains, such as a 27.79% reduction in WIP and a meaningful decrease in replenishment time. The unique contribution of this work lies in its practical, data-driven application of kanban-CONWIP in the precision bearing sector, supported by direct shop-floor measurements rather than simulations or models.
This case study highlights the broader potential for lean manufacturing practices to enhance productivity in component-based industries, especially when designed with process-specific constraints. However, the study is limited to in-house processes and does not account for external supplier delays or real-time variability in customer demand. Additionally, the statistical validation was limited to a single case and could be strengthened through broader sampling or control groups.
Future work should explore integration with Industry 4.0 technologies, such as IoT-based machine monitoring, predictive maintenance analytics, and automated replenishment dashboards. Applying these digital enhancements could enable real-time system adaptability and further reduce inefficiencies. The approach could also be extended to multi-line or multi-product systems to test scalability and flexibility across more complex manufacturing environments.
Author Contributions
Conceptualization, K.U., S.S.G., S.K., A.K.B. and H.M.; Methodology, K.U., S.S.G., S.K., A.K.B. and H.M.; Software, S.K. and A.K.B.; Validation, K.U., S.S.G., S.K., A.K.B. and H.M.; formal analysis, K.U. and S.S.G.; Investigation, K.U.; Resources, K.U.; Data curation, K.U., S.S.G. and S.K.; Writing—original draft preparation, K.U.; Writing—review and editing, S.S.G. and H.M.; Supervision H.M.; Project administration, A.K.B. and H.M.; Funding acquisition K.U., S.S.G., S.K., A.K.B. and H.M. All authors have read and agreed to the published version of the manuscript.
Funding
This research received no external funding.
Institutional Review Board Statement
Not applicable.
Informed Consent Statement
Not applicable.
Data Availability Statement
All data generated or analyzed during this study are included in this published article.
Acknowledgments
The authors are thankful to the team of NRB Bearings Limited, Jalna, Maharashtra, India–431213, for providing the necessary information and kind support.
Conflicts of Interest
The authors declare no conflict of interest.
Nomenclature
| CONWIP | Constant work-in-process |
| WIP | Work-in-process |
| JIT | Just-in-time |
| VSM | Value stream mapping |
| PQ | Product quality |
| N | Number of stages |
| MRP | Materials Requirements Planning |
| UN 3213B | Bottom roller bearing number |
| ASSLY | Assembly |
| CSTMR | Customer |
| BOP | Balance of payment |
| RM | Raw material |
| RT | Replenish time |
| Greek Symbol | |
| A | Safety factor |
References
- Mousli, M. Toyota: Foncer dans le mur et le savoir. Altern. Écon. 2010, 11, 157–167. [Google Scholar] [CrossRef]
- Mojarro-Magaña, M.; Olguín-Tiznado, J.E.; García-Alcaraz, J.L.; Camargo-Wilson, C.; López-Barreras, J.A.; Pérez-López, R.J. Impact of the Planning from the Kanban System on the Company’s Operating Benefits. Sustainability 2018, 10, 2506. [Google Scholar] [CrossRef]
- Yusoff, N.; Halim, H.; Jaffar, A. Implementation of Just in Time Production through Kanban System Implementation of Just in Time Production through Kanban System. Ind. Eng. Lett. 2019, 3, 11–20. [Google Scholar]
- Al-Tahat, M.D.; Mukattash, A.M. Design and analysis of production control scheme for Kanban-based JIT environment. J. Frankl. Inst. 2006, 343, 521–531. [Google Scholar] [CrossRef]
- Deleersnyder, J.-L.; Hodgson, T.J.; Muller-Malek, H.; O’GRady, P.J. Kanban Controlled Pull Systems: An Analytic Approach. Manag. Sci. 1989, 35, 1079–1091. [Google Scholar] [CrossRef]
- Naufal, A.; Jaffar, A.; Yusoff, N.; Hayati, N. Development of Kanban System at Local Manufacturing Company in Malaysia–Case Study. Procedia Eng. 2012, 41, 1721–1726. [Google Scholar] [CrossRef]
- Baker, K.R.; Powell, S.G.; Pyke, D.F. Technical note The performance of push and pull systems: A corrected analysis. Int. J. Prod. Res. 1990, 28, 1731–1736. [Google Scholar] [CrossRef]
- Brown, K.A.; Mitchell, T.R. A Comparison of Just-in-Time and Batch Manufacturing: The Role of Performance Obstacles. Acad. Manag. J. 1991, 34, 906–917. [Google Scholar] [CrossRef]
- Deleersnyder, J.-L.; Hodgson, T.J.; King, R.E.; O’GRady, P.J.; Savva, A. Integrating kanban type pull systems and mrp type push systems: Insights from a markovian model. IIE Trans. 1992, 24, 43–56. [Google Scholar] [CrossRef]
- Huang, C.-C.; Kusiak, A. Overview of Kanban systems. Int. J. Comput. Integr. Manuf. 1996, 9, 169–189. [Google Scholar] [CrossRef]
- Kobbacy, K.A.; Liang, Y. Towards the development of an intelligent inventory management system. Integr. Manuf. Syst. 1999, 10, 354–366. [Google Scholar] [CrossRef]
- Junior, M.L.; Filho, M.G. Variations of the kanban system: Literature review and classification. Int. J. Prod. Econ. 2010, 125, 13–21. [Google Scholar] [CrossRef]
- Rahman, N.A.A.; Sharif, S.M.; Esa, M.M. Lean Manufacturing Case Study with Kanban System Implementation. Procedia Econ. Financ. 2013, 7, 174–180. [Google Scholar] [CrossRef]
- Sarker, B.R.; Fitzsimmons, J.A. The performance of push and pull systems: A simulation and comparative study. Int. J. Prod. Res. 1989, 27, 1715–1731. [Google Scholar] [CrossRef]
- Singh, B.; Garg, S.; Sharma, S.; Grewal, C. Lean implementation and its benefits to production industry. Int. J. Lean Six Sigma 2010, 1, 157–168. [Google Scholar] [CrossRef]
- Spearman, M.L.; Zazanis, M.A. Push and Pull Production Systems: Issues and Comparisons. Oper. Res. 1992, 40, 521–532. [Google Scholar] [CrossRef]
- Ukey, K.; Sawaitul, P.B. Organization planning using theory of constraints. Int. Conf. Adv. Eng. Technol. 2014, 2014, 1–5. [Google Scholar]
- Turner, R.; Madachy, R.; Ingold, D.; Lane, J.A. Modeling kanban processes in systems engineering. In Proceedings of the 2012 International Conference on Software and System Process (ICSSP), Zurich, Switzerland, 2–3 June 2012; pp. 23–27. [Google Scholar]
- Simić, D.; Svirčević, V.; Corchado, E.; Calvo-Rolle, J.L.; Simić, S.D.; Simić, S. Modelling material flow using the Milk run and Kanban systems in the automotive industry. Expert Syst. 2020, 38. [Google Scholar] [CrossRef]
- Joshua, P.; Chin, J.F. Implementation of hybrid parallel kanban-CONWIP system: A case study. Cogent Eng. 2014, 1, 938922. [Google Scholar] [CrossRef]
- Tortorella, G.L.; Narayanamurthy, G.; Thurer, M. Identifying pathways to a high-performing lean automation implementation: An empirical study in the manufacturing industry. Int. J. Prod. Econ. 2021, 231, 107918. [Google Scholar] [CrossRef]
- Jia, Q.H. Application of Pull/Kanban System to Reduce Inventory and Lead Time in a Manufacturing System. Ph.D. Thesis, Universiti Sains Malaysia, Penang, Malaysia, 2017. [Google Scholar]
- Senapathi, M.; Drury-Grogan, M.L. Systems Thinking Approach to Implementing Kanban: A case study. J. Softw. Evol. Process. 2020, 33, e2322. [Google Scholar] [CrossRef]
- Marialuisa, M.; M., S.M.; Muhammad, S. Optimizing milk-run system and IT-based Kanban with artificial intelligence: An empirical study on multi-lines assembly shop floor. Prod. Manuf. Res. 2023, 11, 2179123. [Google Scholar] [CrossRef]
- Nataša, T.; Štefanić, N. Evaluation of pull production control mechanisms by simulation. Processes 2021, 10, 5. [Google Scholar] [CrossRef]
- AL Robaaiy, M.S.D.; Rahima, M.A.; Alghazali, M.H. Application the Kanban Cards and the Value Stream Map (Vsm) to Rationalize Inventory Costs and to Improve The Company’s Performance and Oversight Applied Research in Electrical Cables Factory/Ur State Company for Electrical Industries. Int. J. Prof. Bus. Rev. 2023, 8, e01371. [Google Scholar] [CrossRef]
- Dana, B.L.; Legutko, S. Kanban Systems in the Context of the Enterprise Systems. EDP Sci. MATEC Web Conf. 2021, 343, 03001. [Google Scholar]
- Spearman, M.L.; Woodruff, D.L.; Hopp, W.J. CONWIP Redux: Reflections on 30 years of development and implementation. Int. J. Prod. Res. 2021, 60, 381–387. [Google Scholar] [CrossRef]
- Martins, B.; Silva, C.; Silva, D.; Machado, L.; Brás, M.; Oliveira, R.; Carvalho, T.; Silva, V.; Lima, R.M. Implementation of a Pull system-A case study of a polymeric production system for the automotive industry. Manag. Syst. Prod. Eng. 2021, 29, 253–259. [Google Scholar] [CrossRef]
- Barclay, R.C.; Cudney, E.A.; Shetty, S.; Antony, J. Determining critical success factors for lean implementation. Total Qual. Manag. Bus. Excell. 2021, 33, 818–832. [Google Scholar] [CrossRef]
- Girma, M.A.; Kader, W.A. Optimal Kanban Number: An Integrated Lean and Simulation Modelling Approach. Int. J. Ind. Manuf. Syst. Eng. 2022, 7, 17. [Google Scholar]
- Kolberg, D.; Zühlke, D. Lean Automation enabled by Industry 4.0 Technologies. IFAC-PapersOnLine 2015, 48, 1870–1875. [Google Scholar] [CrossRef]
- ISO 2889:2007; Rolling Bearings—Thrust Spherical Roller Bearings—Boundary Dimensions. International Organization for Standardization: Geneva, Switzerland, 2007.


Disclaimer/Publisher’s Note: The statements, opinions and data contained in all publications are solely those of the individual author(s) and contributor(s) and not of MDPI and/or the editor(s). MDPI and/or the editor(s) disclaim responsibility for any injury to people or property resulting from any ideas, methods, instructions or products referred to in the content. |
© 2025 by the authors. Licensee MDPI, Basel, Switzerland. This article is an open access article distributed under the terms and conditions of the Creative Commons Attribution (CC BY) license (https://creativecommons.org/licenses/by/4.0/).