1. Introduction
Understanding and modeling the lateral and yaw dynamics of vehicles is essential for ensuring road safety, ride comfort, and the effective design of driver assistance and autonomous control systems. Frequency-domain analysis is often used in vehicle dynamics research to assess system behavior under steering inputs and to support the development of robust low-order control models.
A sweep steer test analysis conducted in a recent study confirmed that the most significant dynamic behavior in lateral motion occurs below 3 Hz, and that this frequency band is where steering-induced vehicle responses are most pronounced and controllable [
1]. These findings align with results from earlier research, which highlighted the dominant role of low-frequency dynamics in steering control and stability augmentation systems [
2].
Sensitivity analyses have also shown that vehicle yaw rate responses are most predictable and linear in the low-frequency range, while higher-frequency behavior tends to become more nonlinear and harder to control [
3]. Experimental studies comparing baseline and optimized vehicle designs further confirm that reduced gain in yaw and lateral acceleration responses within the 0–3 Hz range is associated with improved handling and driver comfort [
4].
Previous research has also identified the lateral dynamics of a Nissan Leaf test vehicle, also based on its own measurements. In that case, linear [
5] and block-oriented nonlinear methods were used to identify the lateral dynamics at different speeds [
6].
This paper presents a spectral analysis of lateral dynamics based on real-world experimental data from a Lexus RX450h test vehicle. The study focuses on identifying the dominant frequency components under both manual and autonomous steering conditions. The findings aim to support future model-based control design by confirming the frequency bounds of relevant vehicle responses and validating the linearity assumption commonly used in system identification.
In addition to the commonly used methods, we would like to use the measurement data for machine learning-based (ML-based) system identification in the future. Spectral and time-domain data are key for training ML models in prediction, classification, and control [
7]. Time-domain signals capture dynamic behaviors and trends, while spectral features from Fourier or wavelet transforms reveal frequency patterns linked to system states or faults. Combining both domains yields richer features, improving accuracy, robustness, and adaptability. In prediction, temporal trends with spectral signatures help forecast performance changes; in classification, frequency features distinguish normal from abnormal patterns; and in control, real-time dual-domain analysis supports adaptive decision-making. Digital Twin environments further enhance this by enabling virtual generation and synchronization of such data for faster, safer model development.
2. Measurement Setup
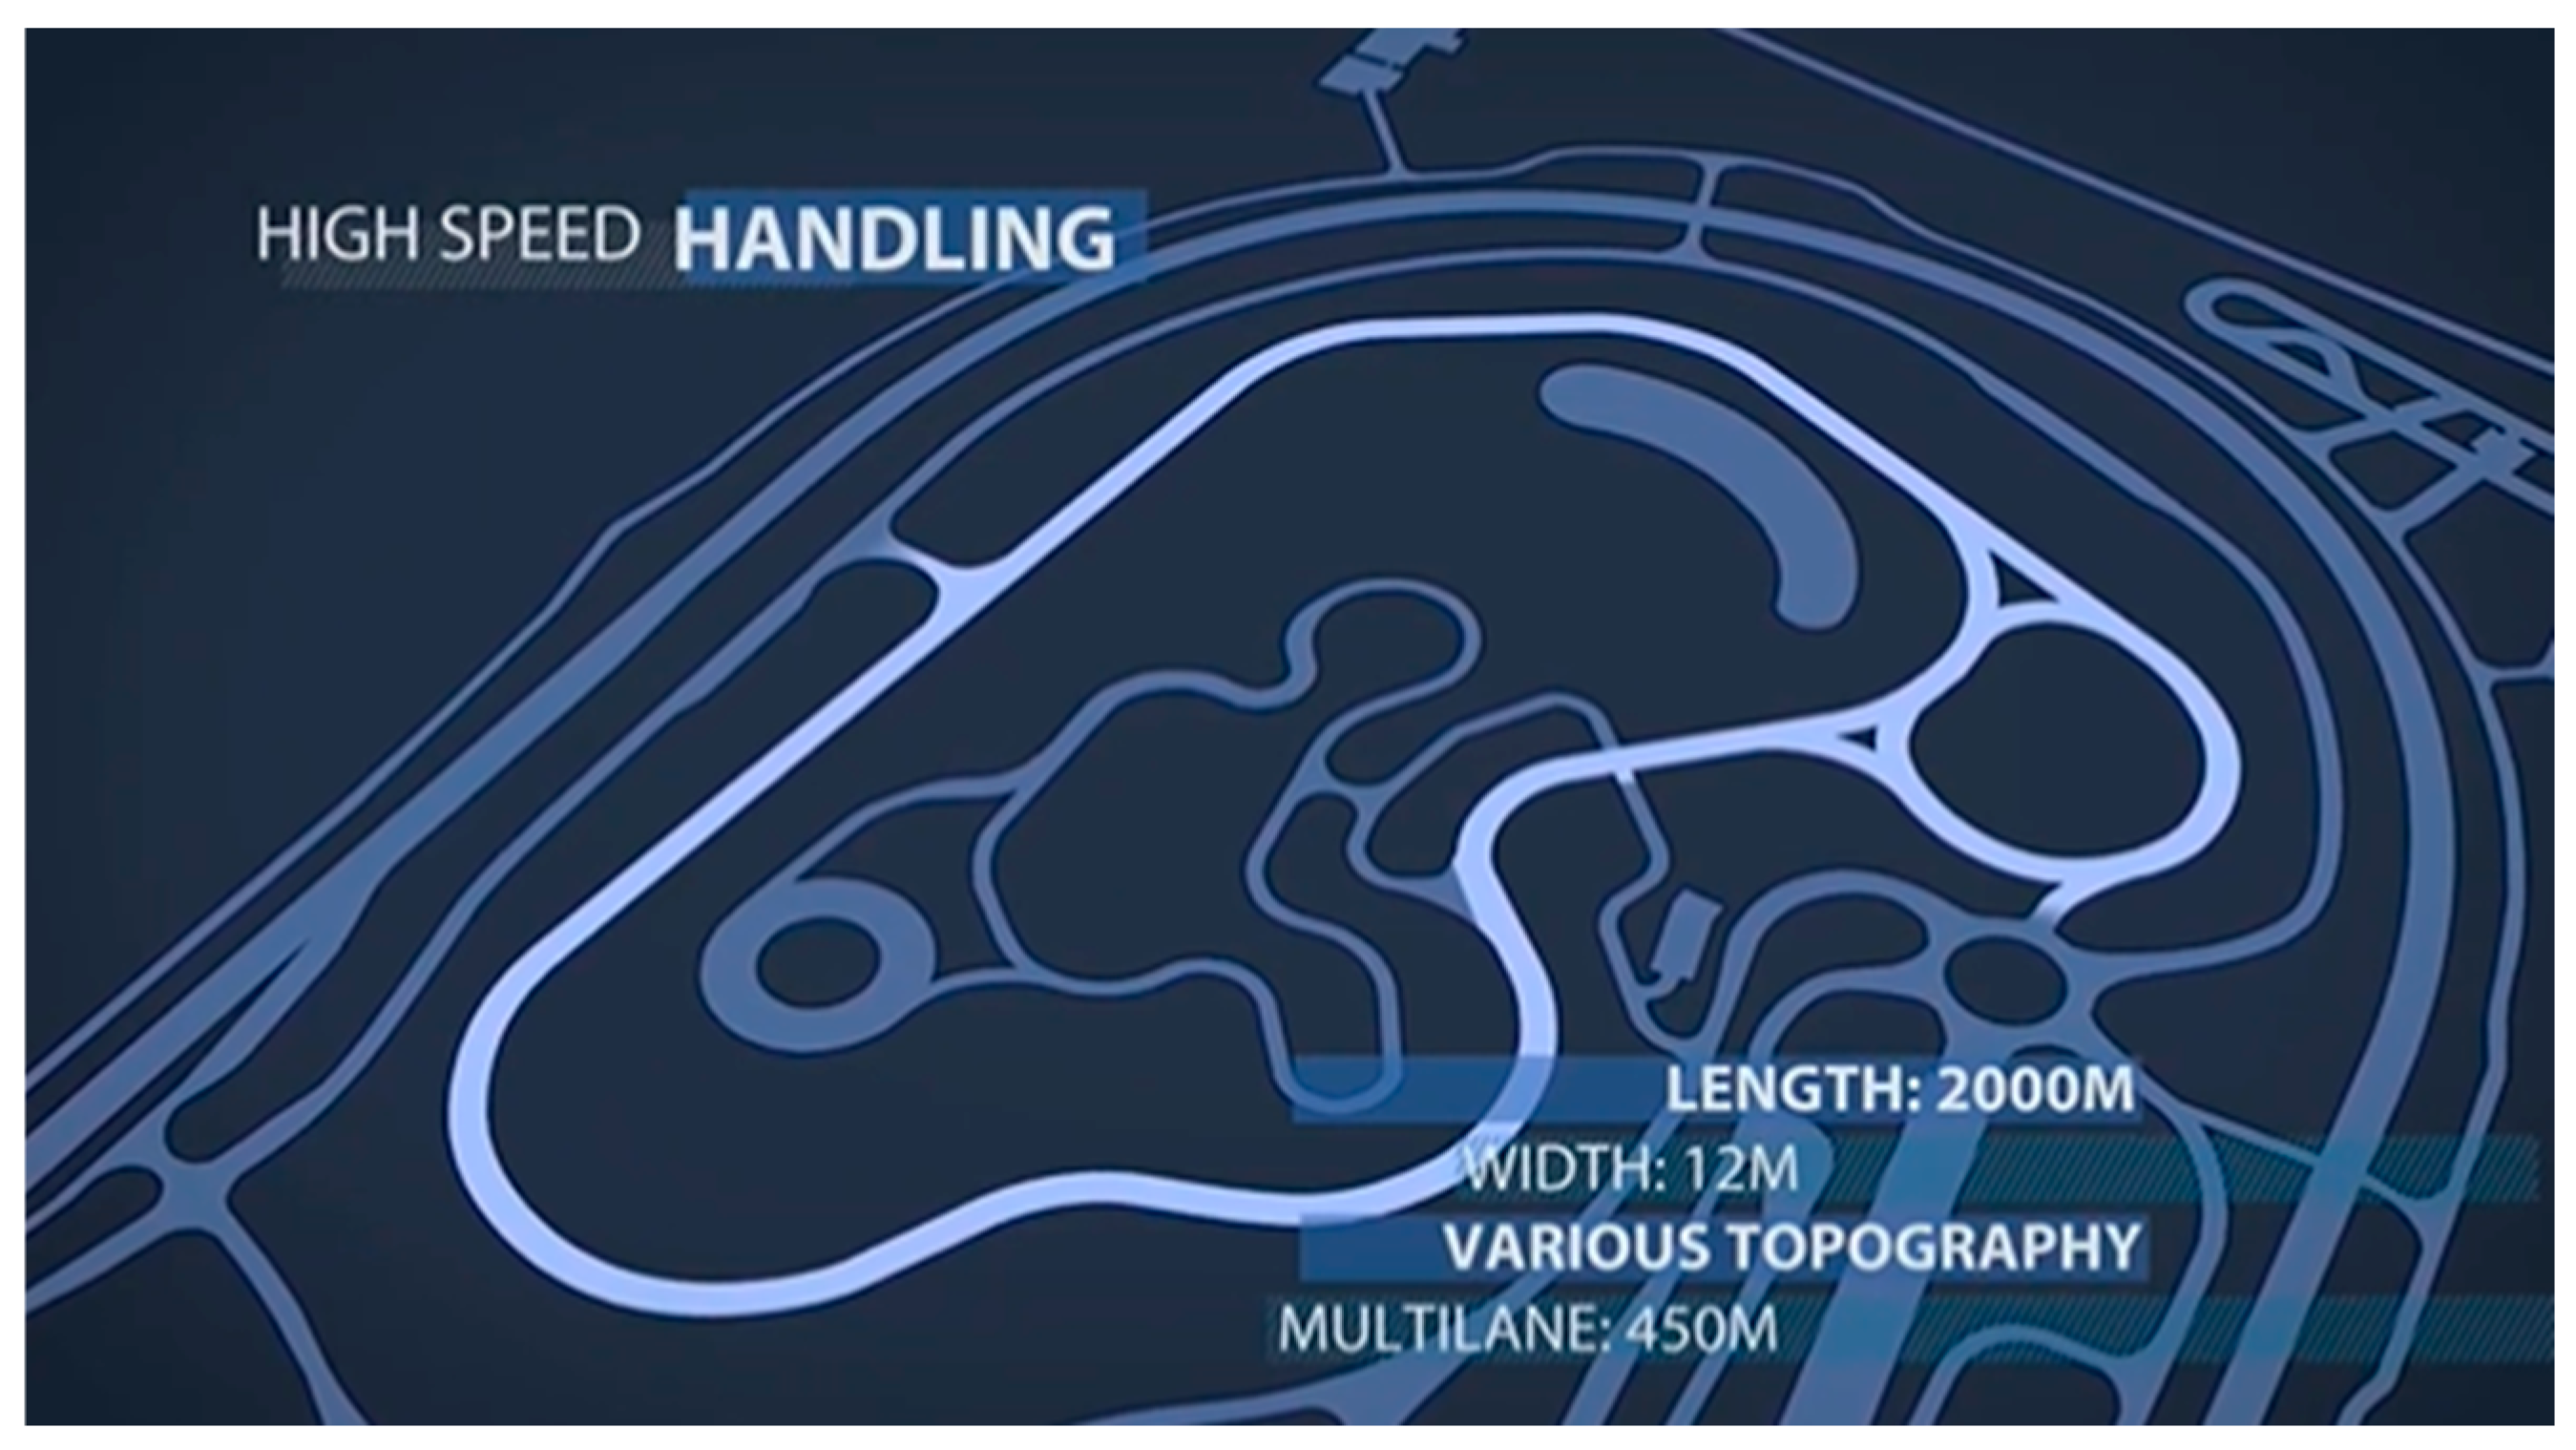
The vehicle measurements took place on the high-speed handling segment of ZalaZONE test track, Hungary (see
Figure 1). The tests were conducted on this section of the track because it is wide enough for testing, and the test vehicle is licensed to drive at this speed in a fully autonomous mode here. The following three main test scenarios were recorded:
Free driving—manual driving: The vehicle was driven around the circuit at a relatively constant speed (nominated speed +/− 10%).
Slalom—manual driving: At a constant speed, the driver guided the vehicle through a sinusoidal track, which was indicated by traffic cones.
Step response—automated steering target: The vehicle was accelerated to a certain speed by the driver; then, a step-like steering angle target was applied to the steering servo drive, and the vehicle took a curve.
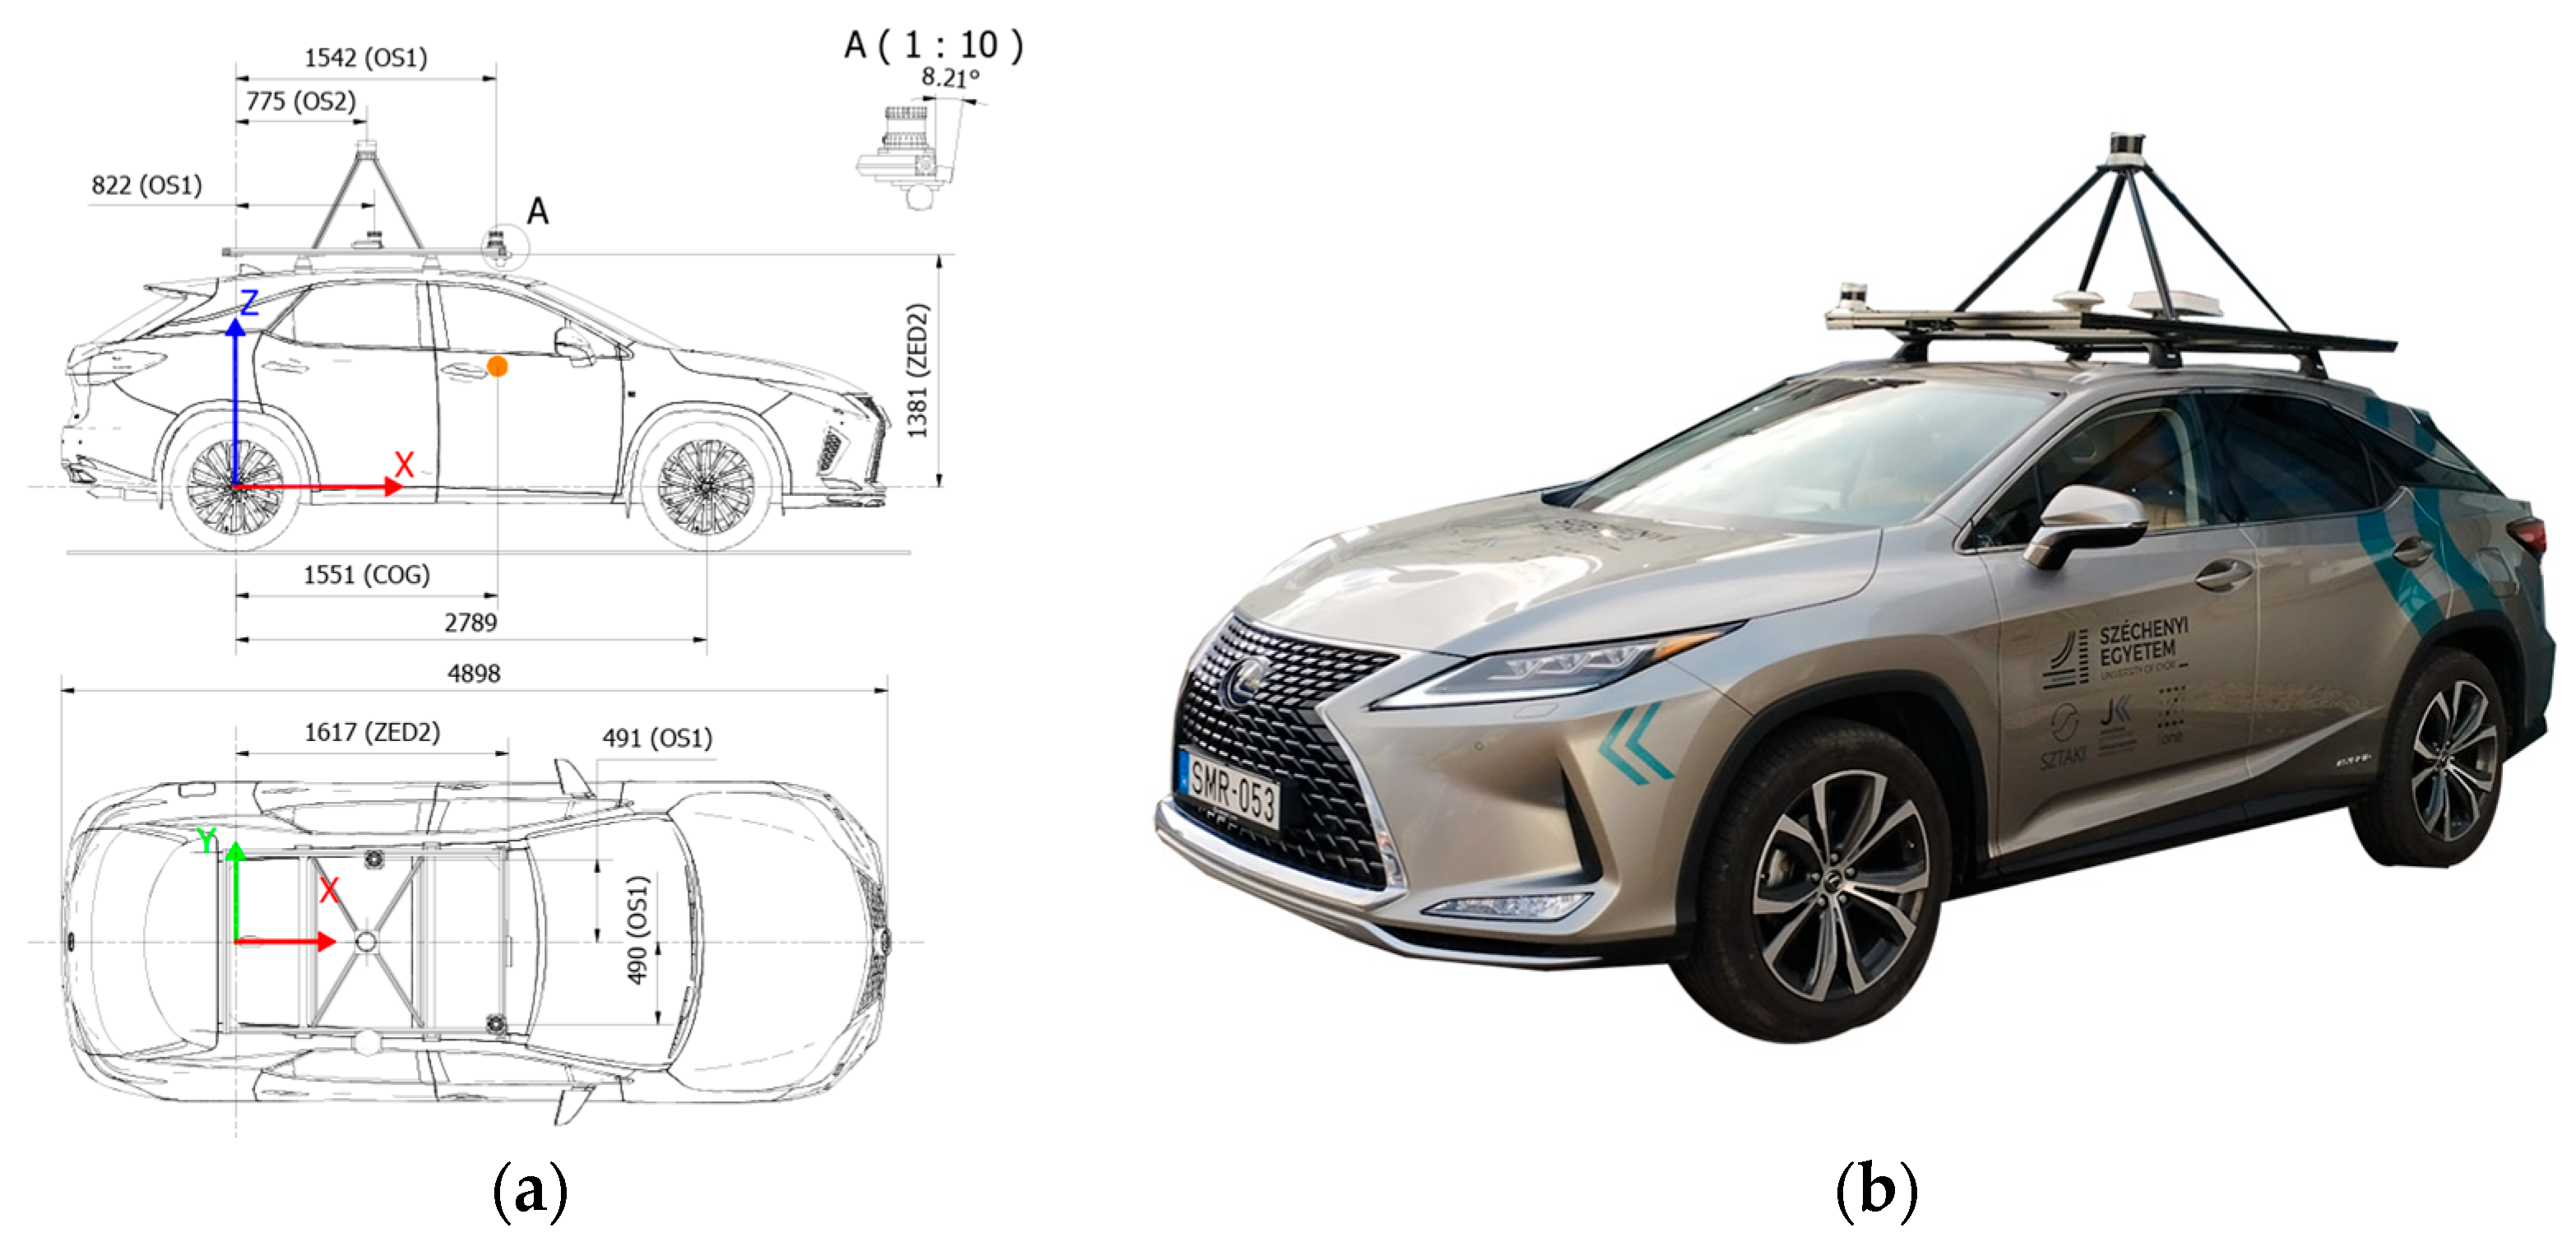
The test vehicle is a Lexus RX450 vehicle, specially rebuilt for testing purposes (see
Figure 2). The sensors that are relevant for the measurements are as follows:
The built-in accelerometer in the brake system of the vehicle, delivering the lateral and longitudinal acceleration (unfiltered, raw acceleration signals from CAN);
Wheel speed sensors, postprocessed by the brake software of the vehicle, delivering the vehicle longitudinal speed and yaw rate signals;
Steering angle measured signals, provided by the steering column angle sensor and read from CAN.
The vehicle was upgraded with the AutonomouStuff PACMod 3.0 System [
9]. The AutonomouStuff PACMod 3.0 System is an advanced drive-by-wire platform specifically developed for automated research using the Lexus RX450h vehicle. “PACMod” stands for Platform Actuation and Control Module, which was engineered to provide precise electronic control over the vehicle’s primary and auxiliary systems. It allows researchers to control acceleration, braking, steering, shifting, headlights, turn signals, and even the horn entirely through software, without mechanical input. This capability is essential for autonomous vehicle testing and development. One of the key strengths of the PACMod 3.0 system lies in its built-in safety mechanisms. Operators can immediately take over control manually in critical situations by performing simple, natural actions such as pressing the brake or accelerator pedal, turning the steering wheel, or activating the emergency stop (E-Stop) button. This ensures a seamless and intuitive fallback in case of unexpected behavior or system failure. Additionally, the system constantly monitors essential vehicle components and alerts the operator to faults via both visual and audible signals. The PACMod system not only offers control but also provides detailed real-time feedback data. This includes throttle and brake percentage, vehicle speed, gear position, steering angle, wheel speeds, and the status of various signals and lights. Such feedback is vital for developing and validating control algorithms and for diagnostic purposes. Moreover, the platform is highly customizable and suitable for integration into a wide range of vehicle types and research applications. It features a CAN interface, support for a joystick control input, a speed and steering controller, ROS (Robot Operating System) compatibility, and access to a DBC file for communication protocols. Firmware updates continue to expand its capabilities and feedback options, making it a flexible and future-proof tool for autonomous vehicle development.
There is a prototypical control software in the vehicle [
10], developed in Robot Operating System 2 (ROS2) [
11] middleware. This platform reads data from the vehicle CAN network and writes it into a single ROS2 topic (message) named ‘/ego’, with the following fields:
/ego/pose—3D position and orientation of the vehicle in the global UTM coordinate system;
/ego/twist—3D translational and rotational speed of the vehicle (mainly used for longitudinal speed and yaw rate);
/ego/accel—3D translational and rotational acceleration of the vehicle (mainly used for longitudinal and lateral acceleration);
/ego/tire_angle_front—steering angle transformed to road–wheel angle (static gear ratio between these two), in radians.
3. Analysis of Measurements
In this section, the measured quantities and their auto power spectral densities (APSDs) are presented. The APSD was created using Matlab’s built-in fft function, which provides a frequency-domain representation of the time-domain signal. The APSD is defined by Equation (1):
where
is a complex vector for the frequency-domain representation of the measured data (
),
is the sampling frequency, and
is the length of the
vector. The APSDs are interpreted at normalized values for better comparability. The sampling frequency for all measurements is 30 Hz. Only the step response tests were performed in autonomous mode; for all other measurements, the vehicle was driven by a driver.
3.1. Free Driving Test
During the free driving tests, the vehicle drove complete laps of the track at different speeds. These speeds were 50 and 65 km/h. The vehicle was driven by a driver. The tests were carried out two times at each speed, but as the results are very similar in the repeated tests, only one measurement per speed is shown. The measured quantities are shown in
Figure 3, together with their auto power spectral density (APSD).
The tests were repeated twice at each speed. The coefficients of cross-correlation for measurements taken at the same speed are shown in
Table 1.
The cross-correlation shows that even though the vehicle was driven by a driver and therefore not perfectly reproducible, the results of the repeated tests are very similar.
In both the time domain and the frequency domain, the relationship between the measured data is clearly visible. This suggests that lateral dynamics can be modeled by linear methods. However, other tests are needed to further investigate this possibility. These tests require additional measurements at different speeds and maneuvers. Their identification using various linear and nonlinear models can provide answers as to the speed ranges in which linear dynamic identification is sufficient for proper controller tuning. The APSD results show that the highest frequency of the dynamics is around 1–2 Hz, so the predefined sampling is appropriate.
3.2. Slalom Tests
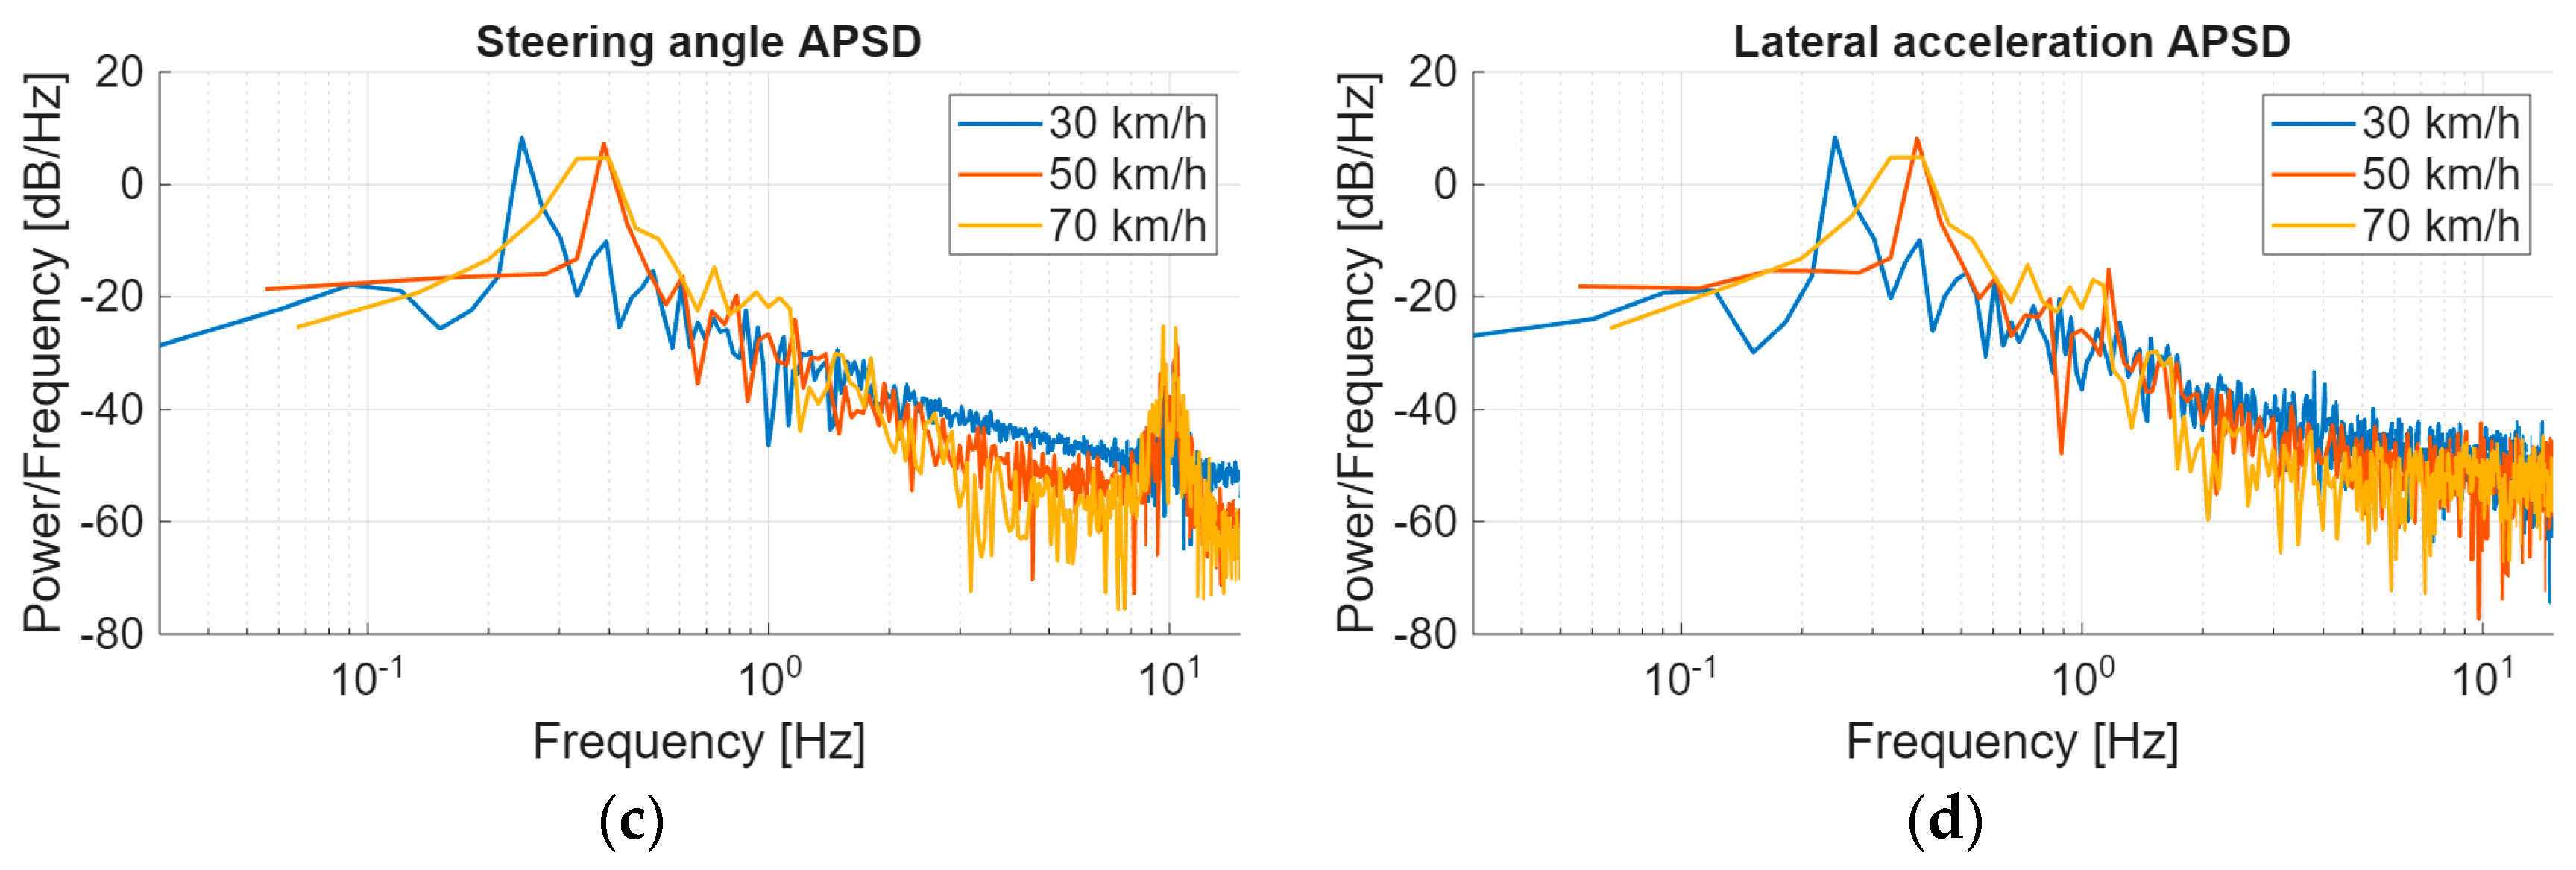
During the slalom tests, the vehicle is moving in a slalom at different speeds. These speeds were 30, 50, and 70 km/h. The vehicle was driven by a driver. The tests were carried out three times at each speed. The measurements could not be repeated with sufficient accuracy, and the average speeds and lateral accelerations also differed between the various tests, but the extent of the differences between the two measured signals varied equally, and the spectral representations were also very similar. For this reason, it makes no sense to examine cross-correlation here. Only one measurement per speed is shown. The measured quantities are shown in
Figure 4, together with their auto power spectral density (APSD).
During these tests, the vehicle was more highly excited, close to its limits, especially at high speeds. It can be seen that even with this excitation, the normalized APSD remains below −40 dB in the range above 3 Hz, confirming that the vehicle’s lateral dynamics are interesting below 3 Hz, above which there is only noise.
3.3. Step Response Tests
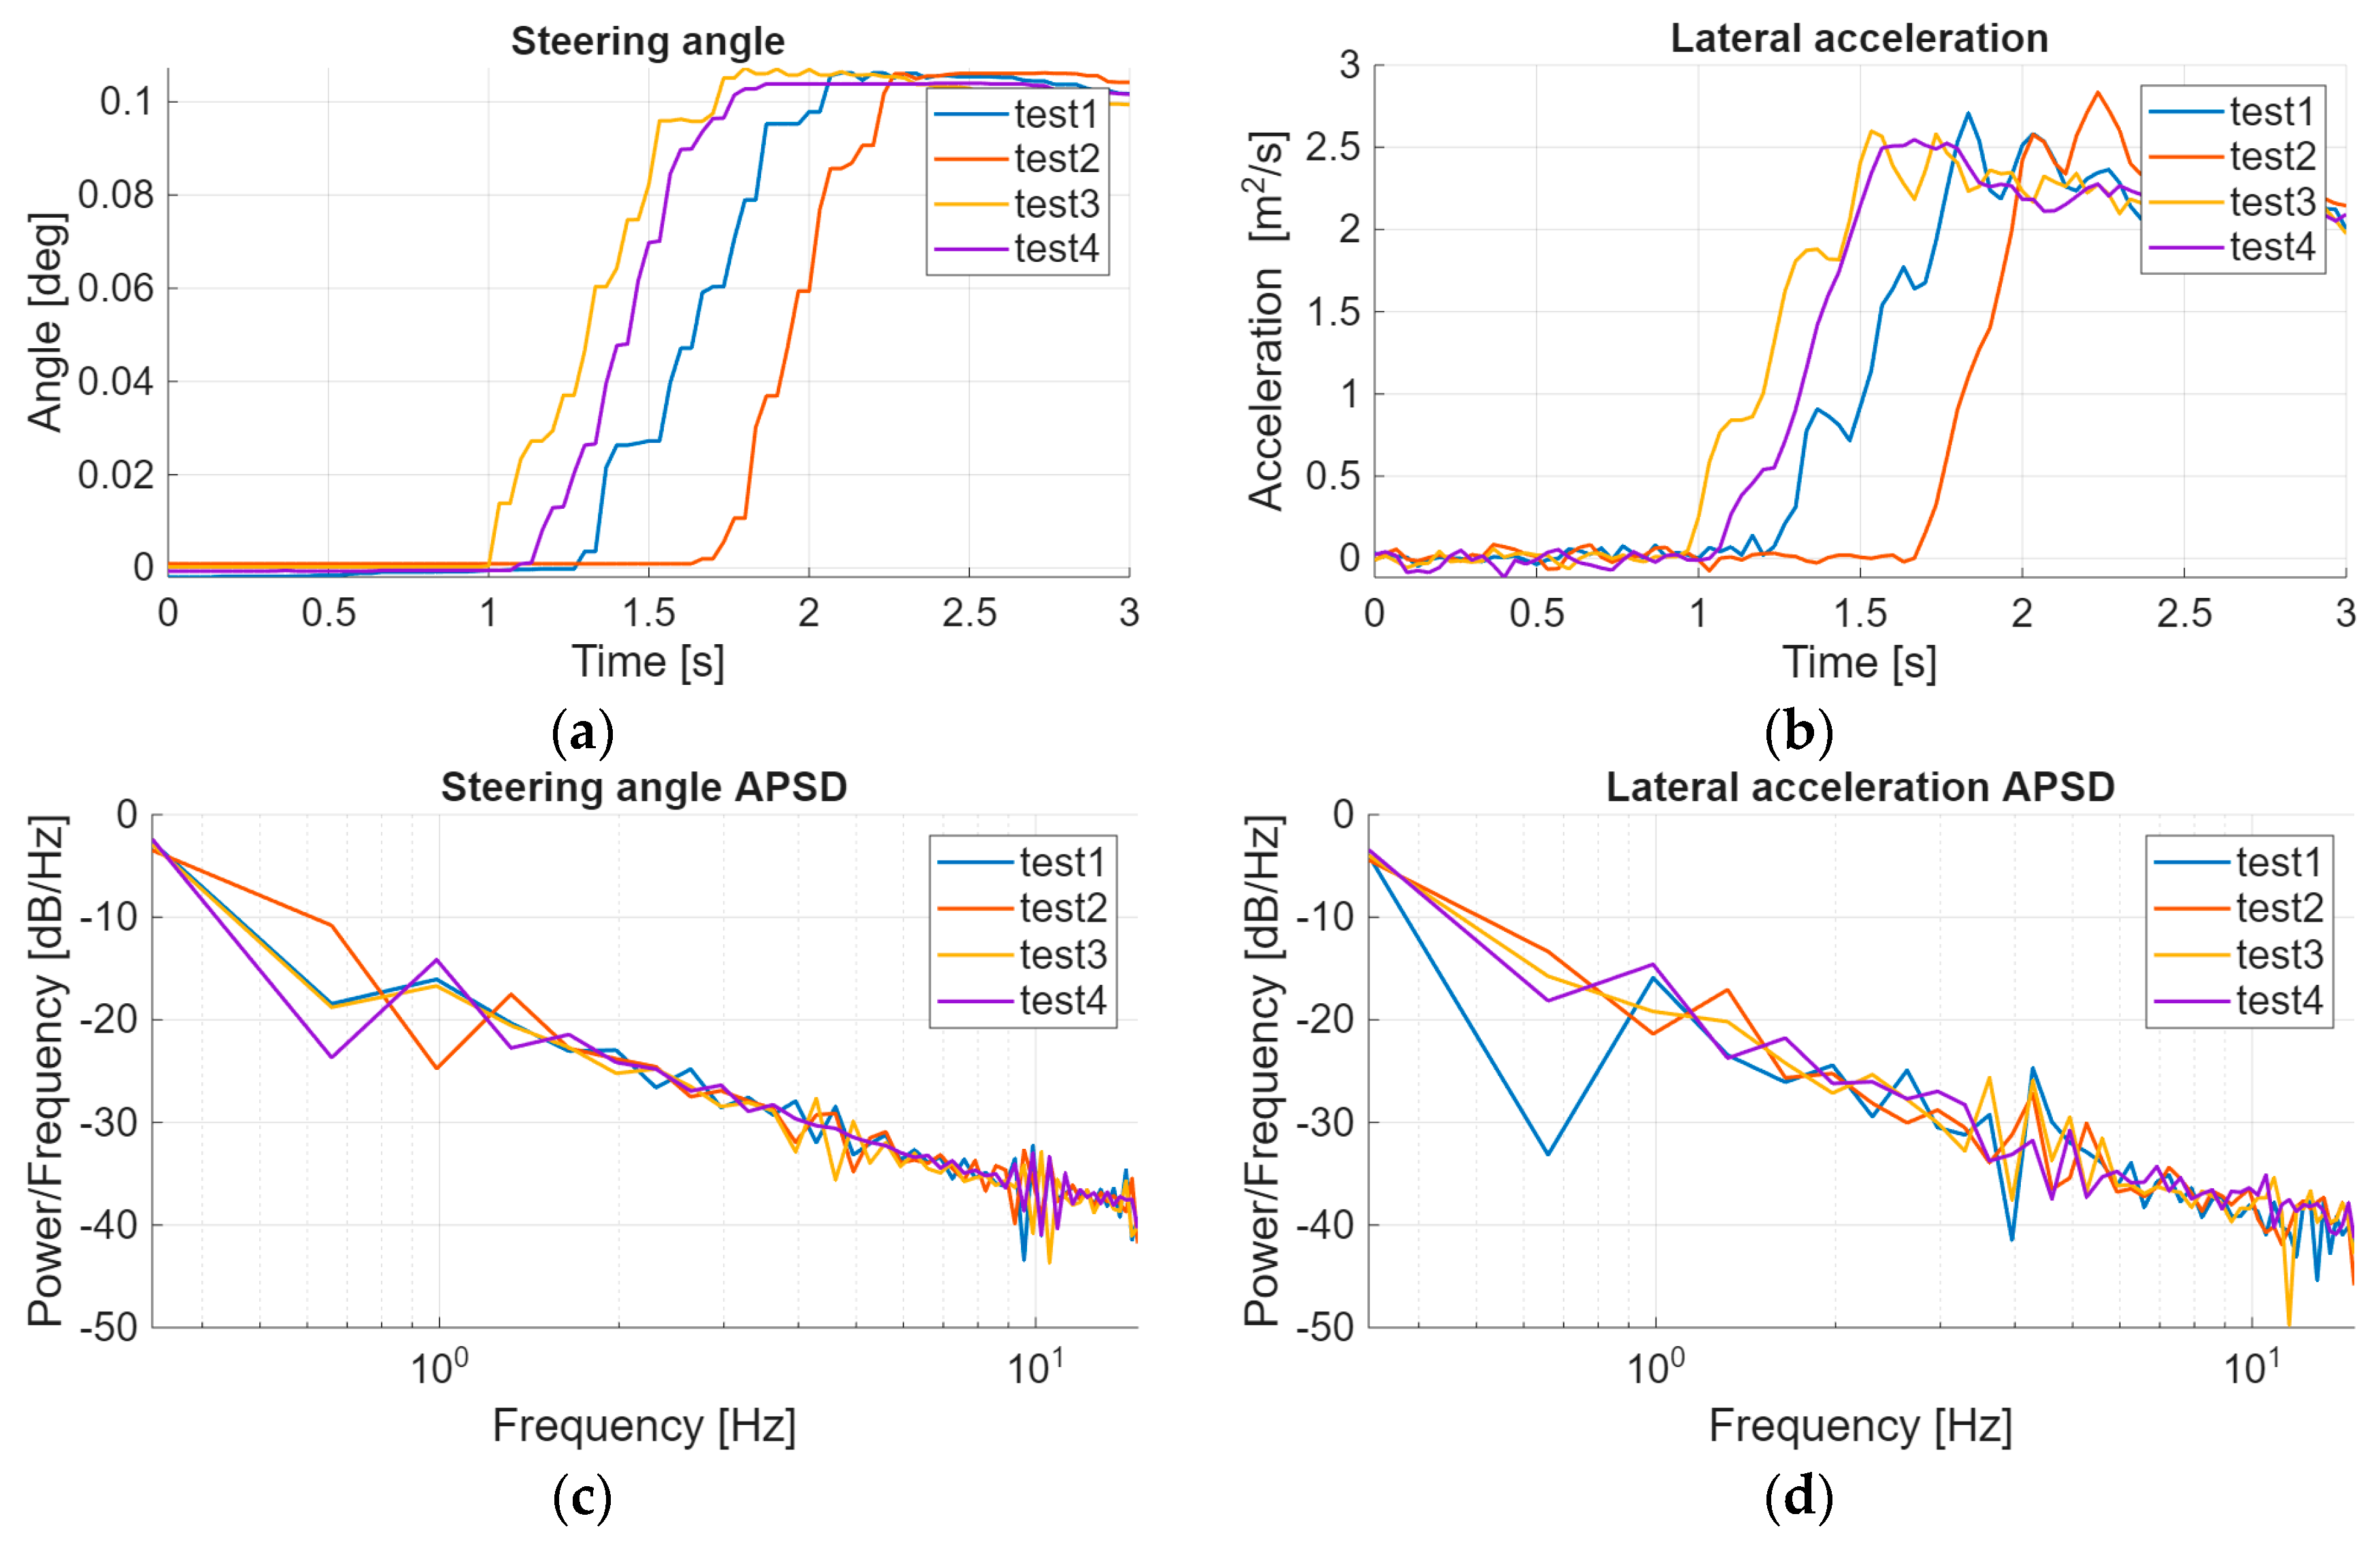
During the step response tests, the vehicle is driven in a straight line and then receives a sudden steering angle reference. In these measurements, the autonomous function is therefore controlling the vehicle, so its internal control process is part of the dynamics. These measurements were made at a speed of 30 km/h. The tests were carried out four times. The measured quantities are shown in
Figure 5. together with their auto power spectral density (APSD).
In this case, the spectrum of the signals shows a different characteristic, but this was expected based on the excitation. The APSD of the step response measurements confirms that the relevant frequency content of the lateral dynamics is below 3 Hz. Despite the autonomous control influencing the system’s behavior, the results remain consistent with the manual driving scenarios. This implies that the control intervention does not introduce significant higher-frequency dynamics and that the essential characteristics of the lateral behavior are preserved.
4. Discussion
Across all measurement scenarios—manual free driving, slalom, and automated step response—the lateral dynamics of the test vehicle exhibited frequency components predominantly below 3 Hz. This consistent spectral behavior reinforces the observation that the vehicle’s lateral dynamics are relatively slow and well-bounded in frequency, making them amenable to low-order linear modeling.
The step response tests, which involved autonomous function, further validated this finding. Although autonomous control could potentially introduce additional system dynamics, the results remained consistent with those from manual driving. The absence of significant high-frequency content indicates that the autonomous system integrates smoothly with the vehicle’s inherent dynamics.
Overall, the spectral uniformity across test types demonstrates that lateral dynamics are largely independent of the source of actuation. This opens the door for model-based controller development and data-driven system identification using measurements from both human and machine operations.
5. Conclusions
This paper presented a spectral analysis of the lateral dynamics of a passenger vehicle under various test conditions, including both manual and autonomous steering inputs. The results consistently demonstrated that the essential dynamics are confined to frequencies below 3 Hz across all scenarios.
The findings support the use of low-order linear models for representing lateral dynamics and justify the sufficiency of a 30 Hz sampling rate. Importantly, the autonomous control input did not introduce significant deviations in the spectral characteristics, confirming the compatibility of automated actuation with the vehicle’s inherent dynamics.
These conclusions provide a solid foundation for future work in control-oriented modeling and system identification, both of which are crucial for the safe and efficient development of autonomous vehicle technologies. In the next phase, based on the measurement results presented, the model order will be estimated and the system will be identified, first using linear and then nonlinear methods. Later, machine learning-based nonlinear methods will also be tested, but these require significantly more measurements in order to create a sufficiently robust model.
Author Contributions
Conceptualization, G.I., D.P. and J.B.; methodology, G.F.I., D.J. and J.B.; software, G.I.; validation, G.F.I. and D.J.; formal analysis, G.I., D.P. and J.B.; investigation, G.F.I. and D.J.; resources, D.P. and J.B.; data curation, G.I., G.F.I. and D.J.; writing—original draft preparation, G.I.; writing—review and editing, G.F.I., D.J., D.P. and J.B.; visualization, G.I.; supervision, J.B.; project administration, D.P.; funding acquisition, D.P. All authors have read and agreed to the published version of the manuscript.
Funding
This research was supported by the European Union within the framework of the National Laboratory for Autonomous Systems (RRF-2.3.1-21-2022-00002).
Institutional Review Board Statement
Not applicable.
Informed Consent Statement
Not applicable.
Data Availability Statement
The dataset is available upon request from the authors.
Conflicts of Interest
The authors declare no conflicts of interest.
References
- Home Page of AVL ZalaZONE. Available online: https://avlzalazone.com/testing-and-track/high-speed-handling-course (accessed on 30 May 2025).
- Data Sheet—Lexus RX450h PACMod 3.0 System. Available online: https://autonomoustuff.com/-/media/Images/Hexagon/Hexagon%20Core/autonomousstuff/pdf/as-lexus-pacmod-3-datasheet.ashx (accessed on 30 May 2025).
- Cooperative Research Platform Source Code. Available online: https://github.com/jkk-research/CooperativeResearchPlatform (accessed on 30 May 2025).
- Macenski, S.; Foote, T.; Gerkey, B.; Lalancette, C.; Woodall, W. Robot Operating System 2: Design, architecture, and uses in the wild. Sci. Robot. 2022, 7, eabm6074. [Google Scholar] [CrossRef] [PubMed]
- Pup, D.; Istenes, G.; Szauter, F.; Bokor, J. Identification of lateral dynamics of an autonomous car vehicle. In Proceedings of the 12th International Conference on Mechatronics and Control Engineering—ICMCE 2024, Budapest, Hungary, 25–27 January 2024. [Google Scholar]
- Istenes, G.; Pup, D.; Szauter, F.; Bokor, J. Nonlinear Identification of Lateral Dynamics of an Autonomous Car Vehicle. Eng. Proc. 2024, 79, 1–6. [Google Scholar]
- Marinković, D.; Dezső, G.; Milojević, S. Application of Machine Learning During Maintenance and Exploitation of Electric Vehicles. Adv. Eng. Lett. 2024, 3, 132–140. [Google Scholar] [CrossRef]
- Olschewski, J.; Fang, X. Evaluation of Vehicle Lateral and Longitudinal Dynamic Behavior of the New Package-Saving Multi-Link Torsion Axle (MLTA) for BEVs. World Electr. Veh. J. 2024, 15, 310. [Google Scholar] [CrossRef]
- Tey, J.Y.; Ramil, R. Handling performance optimisation for formula vehicle using multi-objectives evolutionary algorithms. Veh. Syst. Dyn. 2019, 58, 1–16. [Google Scholar] [CrossRef]
- Jang, J.H.; Han, C.S. The sensitivity analysis of yaw rate for a front wheel steering vehicle: In the frequency domain. KSME Int. J. 1997, 11, 56–66. [Google Scholar] [CrossRef]
- Huang, H.H.; Tsai, M.J. Vehicle Cornering Performance Evaluation and Enhancement Based on CAE and Experimental Analyses. Appl. Sci. 2019, 9, 5428. [Google Scholar] [CrossRef]
| Disclaimer/Publisher’s Note: The statements, opinions and data contained in all publications are solely those of the individual author(s) and contributor(s) and not of MDPI and/or the editor(s). MDPI and/or the editor(s) disclaim responsibility for any injury to people or property resulting from any ideas, methods, instructions or products referred to in the content. |
© 2025 by the authors. Licensee MDPI, Basel, Switzerland. This article is an open access article distributed under the terms and conditions of the Creative Commons Attribution (CC BY) license (https://creativecommons.org/licenses/by/4.0/).


