1. Introduction
The efficiency of photovoltaic (PV) panels is greatly influenced by their operating temperature, which poses a significant challenge for solar energy harvesting systems. Solar panels convert only 10–20% of incoming radiation into electricity, while the remaining energy is transformed into heat, leading to substantial temperature increases that negatively affect electrical performance [
1]. This temperature-related efficiency degradation occurs because photovoltaic cells become less efficient as their temperature rises above standard test conditions (STC) of 25 °C [
2]. The temperature coefficient of power for most commercial silicon-based solar panels ranges from 0.3% to −0.5% per degree Celsius. This means that for every 1 °C increase above 25 °C, the power output decreases by 0.3% to 0.5%. During peak summer conditions, solar panels can reach temperatures between 70 °C and 90 °C, resulting in power losses of up to 25% compared to their rated capacity [
3].
Effective thermal management strategies are essential for maintaining optimal performance of photovoltaic (PV) systems and maximizing energy harvesting efficiency. Traditional cooling methods, such as air and water cooling systems, have been widely studied; however, these approaches often require additional energy input and can involve complex infrastructure [
4,
5]. Phase change materials (PCMs) have emerged as a promising passive cooling solution due to their ability to absorb and release significant amounts of latent heat during phase transitions, while maintaining relatively constant temperatures. PCMs store thermal energy by melting during high-temperature periods and release this energy during cooler periods, effectively regulating the temperature of PV systems [
6].
Extensive research has been conducted on PV–PCM integration systems, demonstrating significant improvements in thermal management and electrical performance. Maghrabie et al. (2023) attached a 3 cm layer of PCM RT-42 to the rear of a PV panel (tilt 30°) and observed a 15.8% increase in power output and a 14.4% boost in electrical efficiency under outdoor conditions [
7]. Prakash et al. (2023) employed hydrated salt HS36 in an experimental array and reported a 16.98 °C drop in operating temperature (25.4% reduction) alongside a 17.5% rise in electrical efficiency [
8]. Sheik et al. (2022) used PEG-1000 as a pure PCM and demonstrated a 4.82% increase in electrical efficiency in outdoor tests [
9]. Finally, Hassan et al. (2020) combined RT-35HC paraffin with a graphene-nanoparticle nanofluid in a PVT–PCM hybrid configuration, experimentally achieving a 23.9 °C reduction in solar cell temperature and a 23.9% improvement in electrical efficiency [
10]. More recently, Al-Waeli et al. (2024) reviewed PV-PCM systems, highlighting temperature reductions of up to 20 °C and efficiency gains of 10–20% using PCMs with thermal conductivity enhancers like nanoparticles [
11]. Sathish et al. (2024) reported 15–25% efficiency improvements with PCMs integrated with metal foams under high irradiance [
12]. Similarly, Abdo et al. (2023) modeled PCM-based cooling across diverse climates, achieving 12–18% efficiency increases and 10–15 °C temperature reductions, emphasizing climate-specific PCM selection [
13]. Similarly, a modification of PV panel with PCM RT28HC was tested for passive cooling with an average increase of PV-PCM efficiency from 1.1 to 2.8% [
14].
In view of the above literature review, it is evident that although numerous studies have analyzed PV–PCM systems, most focus primarily on the charging cycle, with the discharging phase remaining less explored. Therefore, this study aims to provide further insights into the thermal and power management of PV–PCM systems under Pakistan’s summer conditions. We employ a comprehensive computational approach, combining ANSYS Fluent 2021 R1 for transient thermal analysis with MATLAB 9.14 R2023a/Simulink 10.7 for electrical power output modeling. The simulations target the critical summer months of April, May, and June, when solar radiation intensity peaks and effective thermal management is essential for optimizing PV performance.
2. Problem Formulation
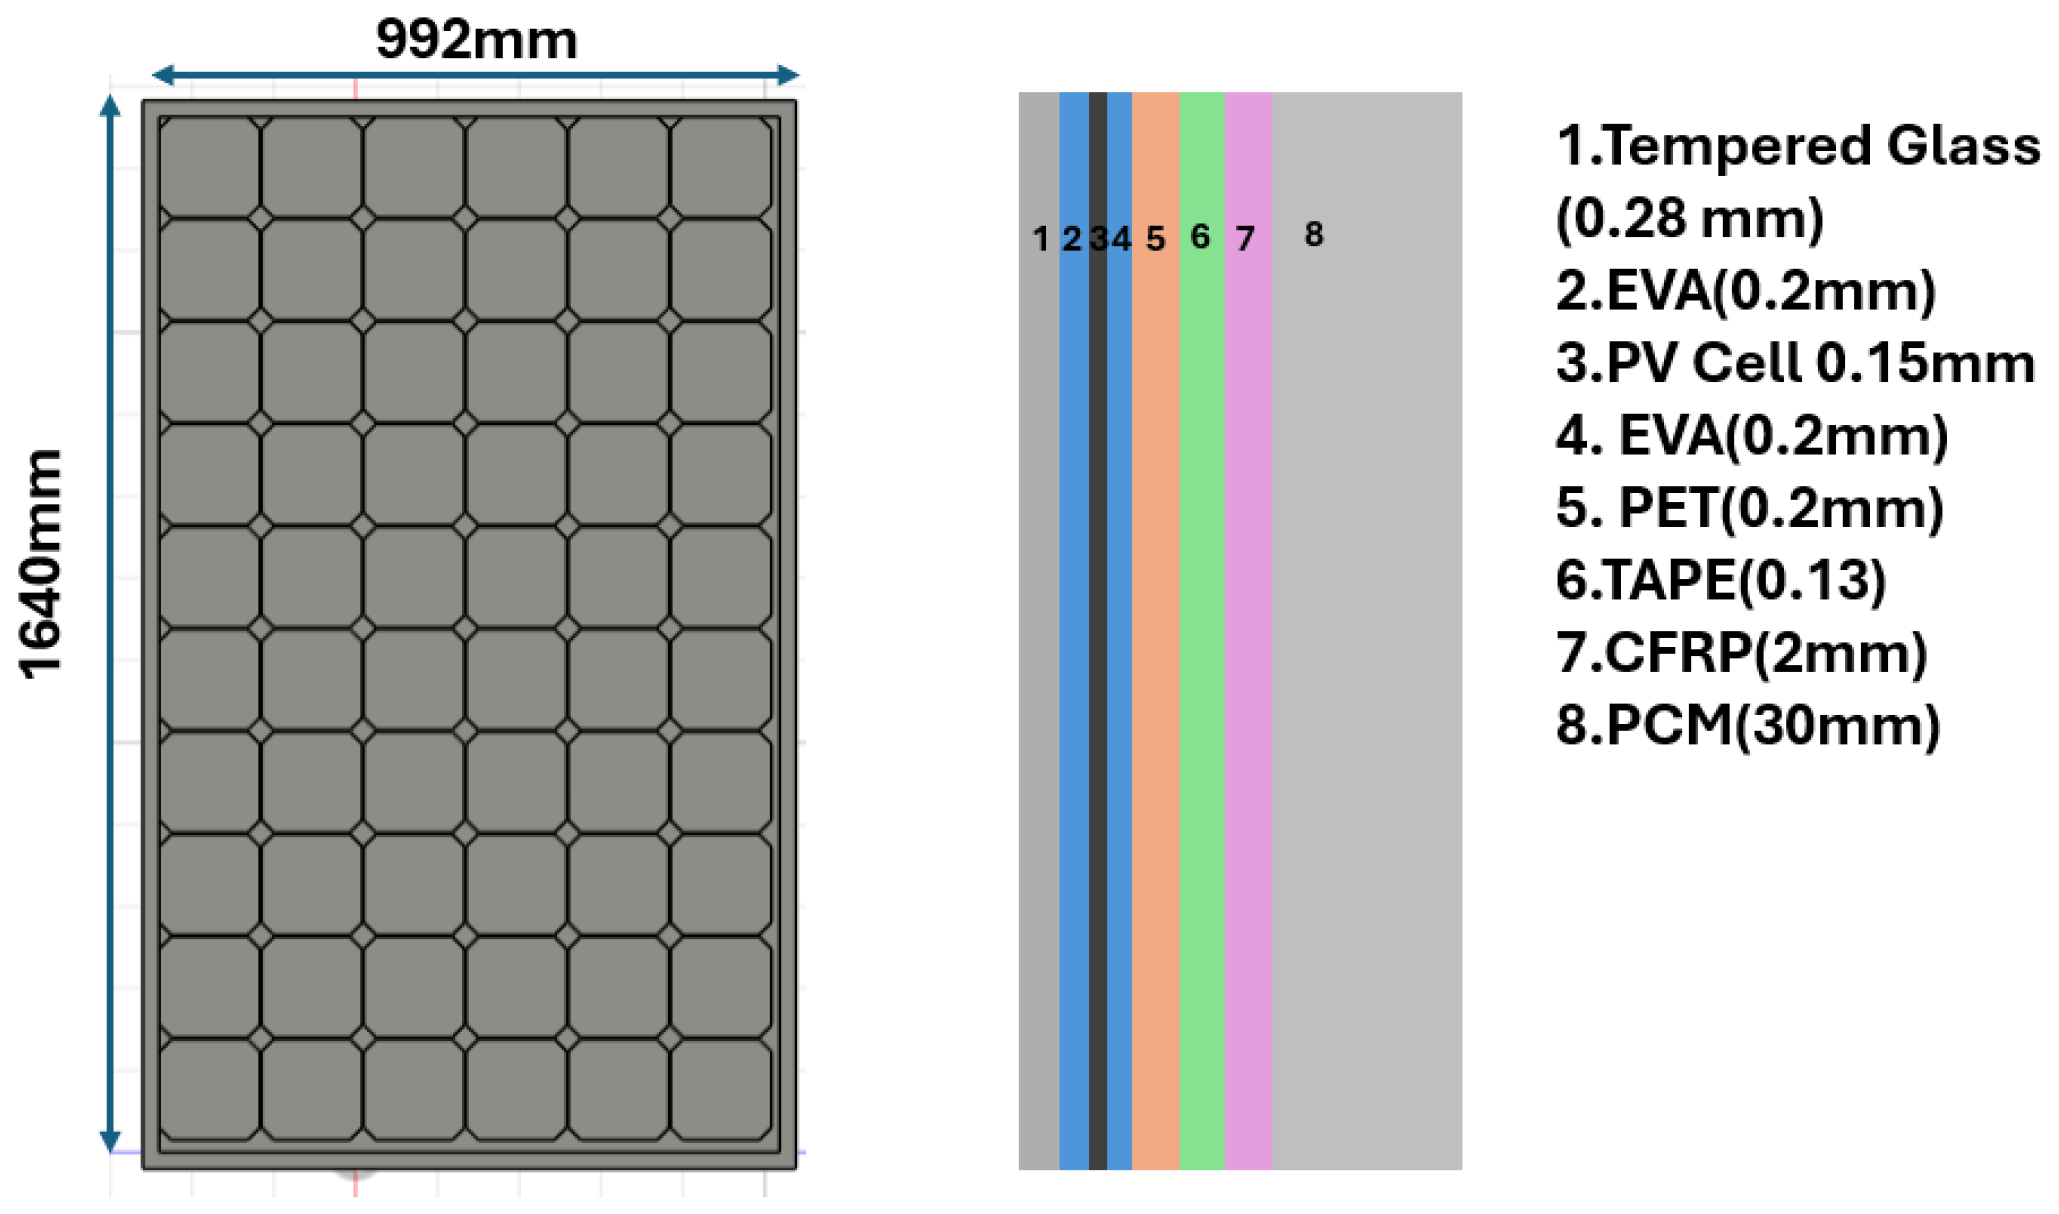
The hybrid module footprint is a standard 250 W photovoltaic panel measuring 1640 mm in height and 992 mm in width. From front (sun-facing) to back, the cross-sectional layers are shown in
Figure 1. Under the Standard Testing Conditions (1000 W/m
2 irradiance, AM 1.5 spectrum, cell temperature 25 °C), the 60-cell Canadian Solar CS6P-250M module is rated for a maximum power output of 250 W. At this peak power point, the module operates at 30.4 V and 8.22 A, with an open-circuit voltage of 37.5 V and a short-circuit current of 8.74 A [
15]:
The PCM container is bonded directly to the CFRP layer, covering the full panel area (1.640 m × 0.992 m). The 30 mm-thick PCM layer yields a volume of 0.0488 m3. For this study, we selected RT35.
3. Mathematical Modeling
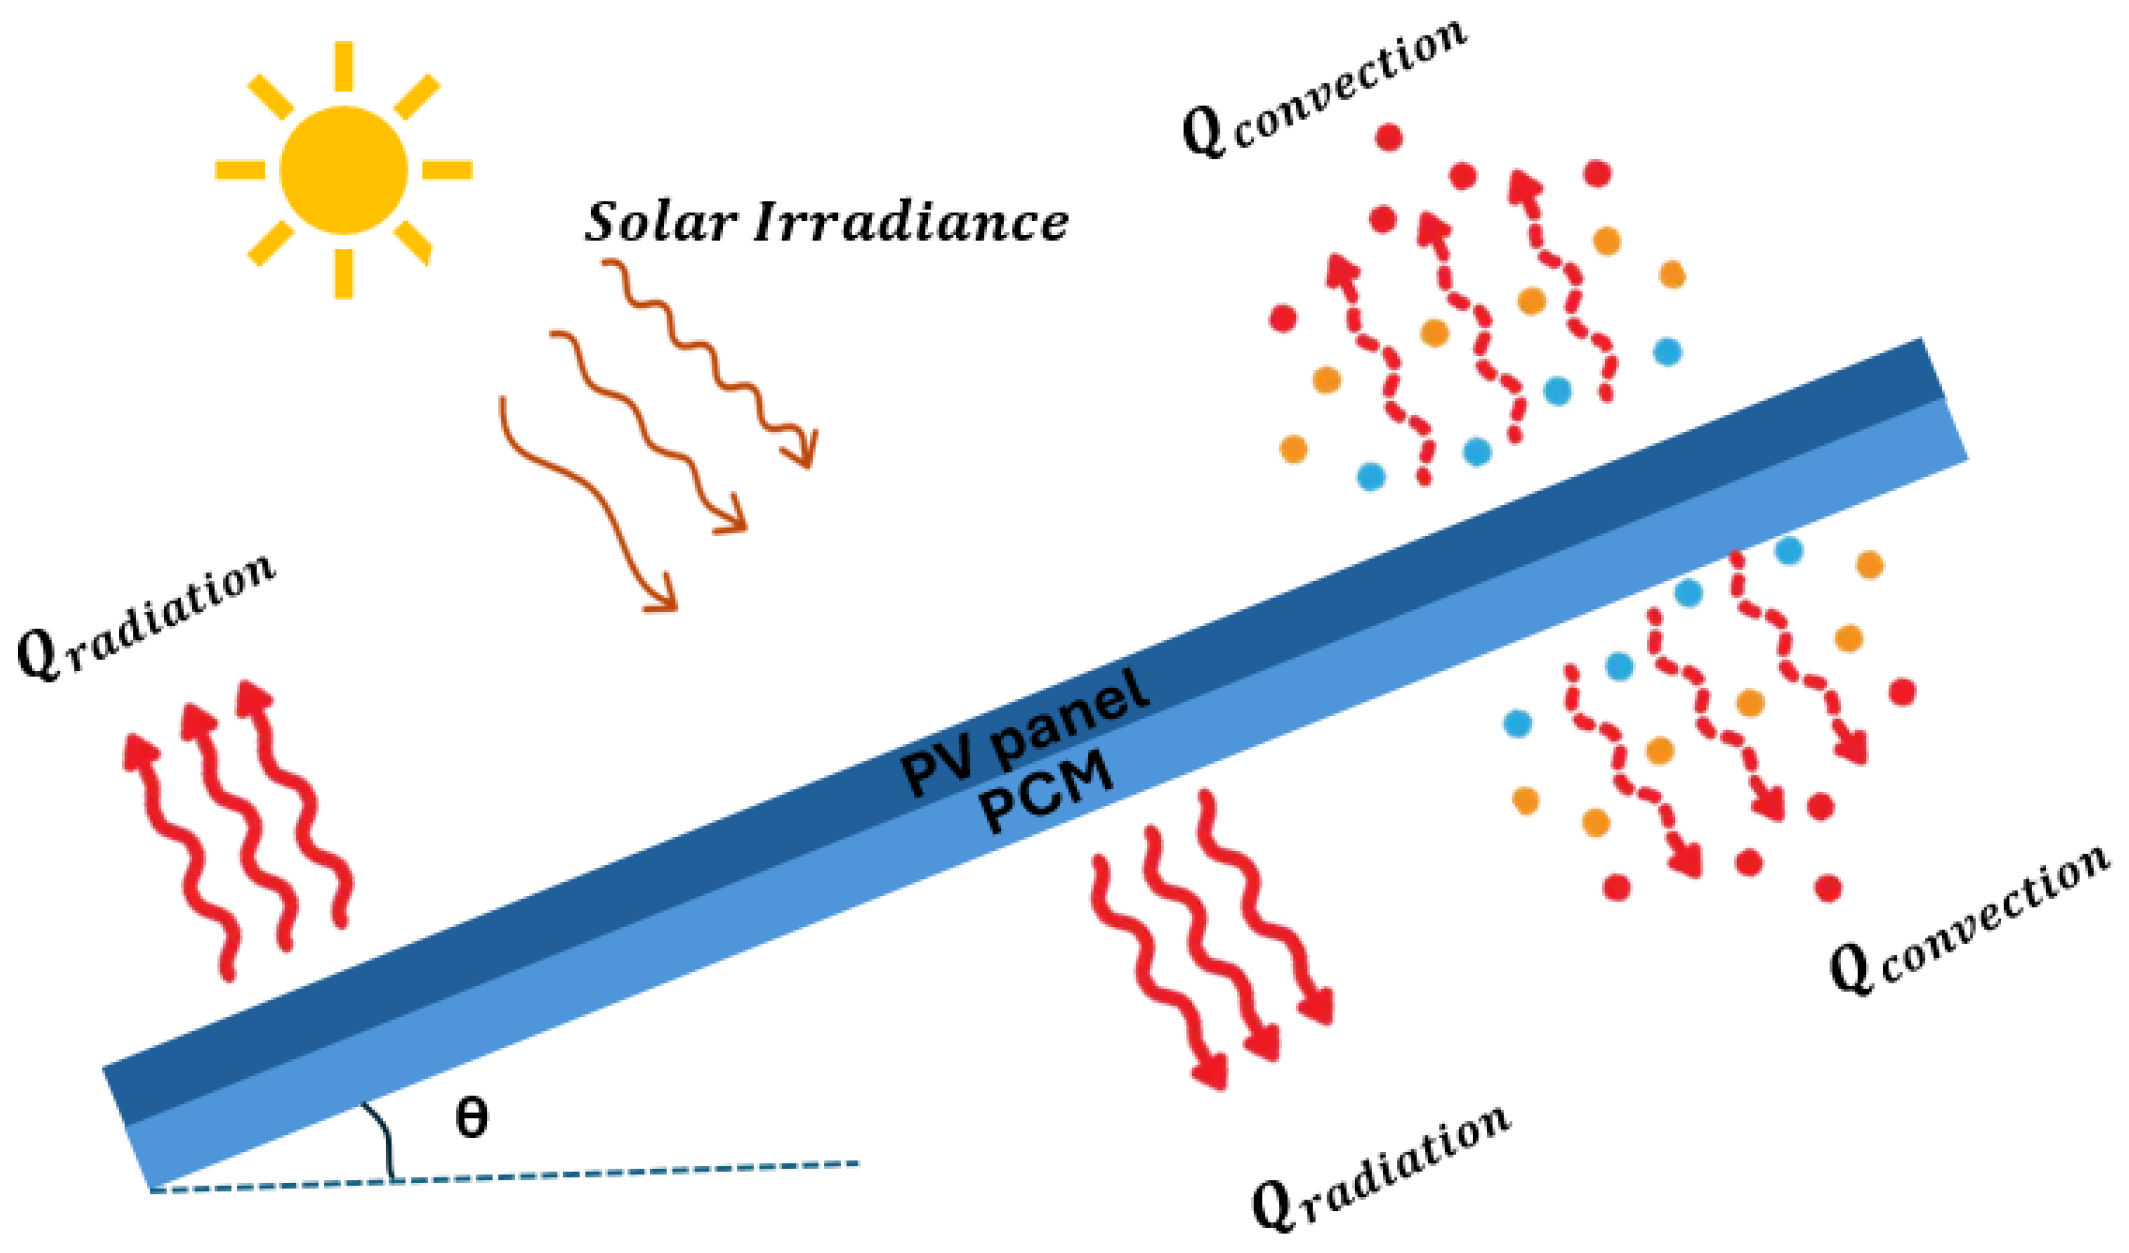
Our study develops transient thermal models for two configurations: a bare photovoltaic (PV) panel and a PV–PCM hybrid, both inclined at an angle θ to the horizontal as shown in
Figure 2. Each system is driven by real-time boundary conditions—hourly solar irradiance G(t) and ambient temperature T∞ (t) recorded in Islamabad from April through June. When sunlight strikes the panel, a fraction α is absorbed while the remainder (1 − α) is reflected. The absorbed energy raises the PV cell temperature, but heat is simultaneously lost by convection to the surrounding air and by long-wave radiation to the sky and ground. In the PV–PCM case, additional conduction transfers heat into the PCM layer, where latent storage further moderates’ temperature rise.
Taking all these effects into account, the lumped-parameter energy balance for the PV cell reads:
where the absorbed solar power is found by:
Convection heat losses are determined by:
And radiation heat losses can be calculated by:
Now consider the PV system with PCM.
Then the energy balance equation is.
where the heat conduction from the PV to PCM is:
The melt fraction is determined by:
where
is the solidus temperature, under which the PCM remains entirely in a solid state
is the liquidus temperature, beyond which the PCM is completely liquid
f ranges from 0 (completely solid) to 1 (entire liquid) and is interpolated linearly in the mushy (phase change) region.
If the PCM will be in solids state and if
4. Numerical Analysis
The transient thermal performance of both the conventional photovoltaic (PV) system and the modified PV panel integrated with phase change material (PV–PCM) was analyzed using three-dimensional simulations performed in ANSYS Fluent. To represent realistic climatic conditions, hourly solar irradiance data for each month were averaged across all days to generate a typical 24 h irradiance profile. This averaged profile was then used to run a 24 h transient simulation for each of the selected months. Accordingly, separate 24 h simulations were conducted for April, May, and June to evaluate the thermal behavior of both systems under varying seasonal conditions. The geometric model comprised the PV layers (glass, cell, EVA sheet, PET, TAP, and CFRP) and, for the PV–PCM configuration, an additional PCM enclosure beneath the panel. The systems were mounted at an inclination angle θ = 35 to represent realistic installation conditions in Pakistan.
The 3D geometry was discretized using a structured hexahedral mesh, with a mesh element size of 3 mm applied throughout the domain as illustrated in
Figure 3. Mesh sensitivity analysis was conducted to ensure solution accuracy, confirming that further mesh refinement had less than 1% impact on the predicted maximum PV cell temperature. The material properties of PV panel are listed in
Table 1 and thermal properties of PCM RT35 are provided in
Table 2.
The boundary conditions applied included time-dependent solar heat flux (averaged over each month and distributed over 24 h) shown in
Figure 4. Using the UDF on the top surface of the PV module, accounting for both the absorption factor and panel tilt. Heat losses through natural convection and long-wave thermal radiation to the environment were included on all exposed surfaces as shown in
Figure 5.
Model Validation
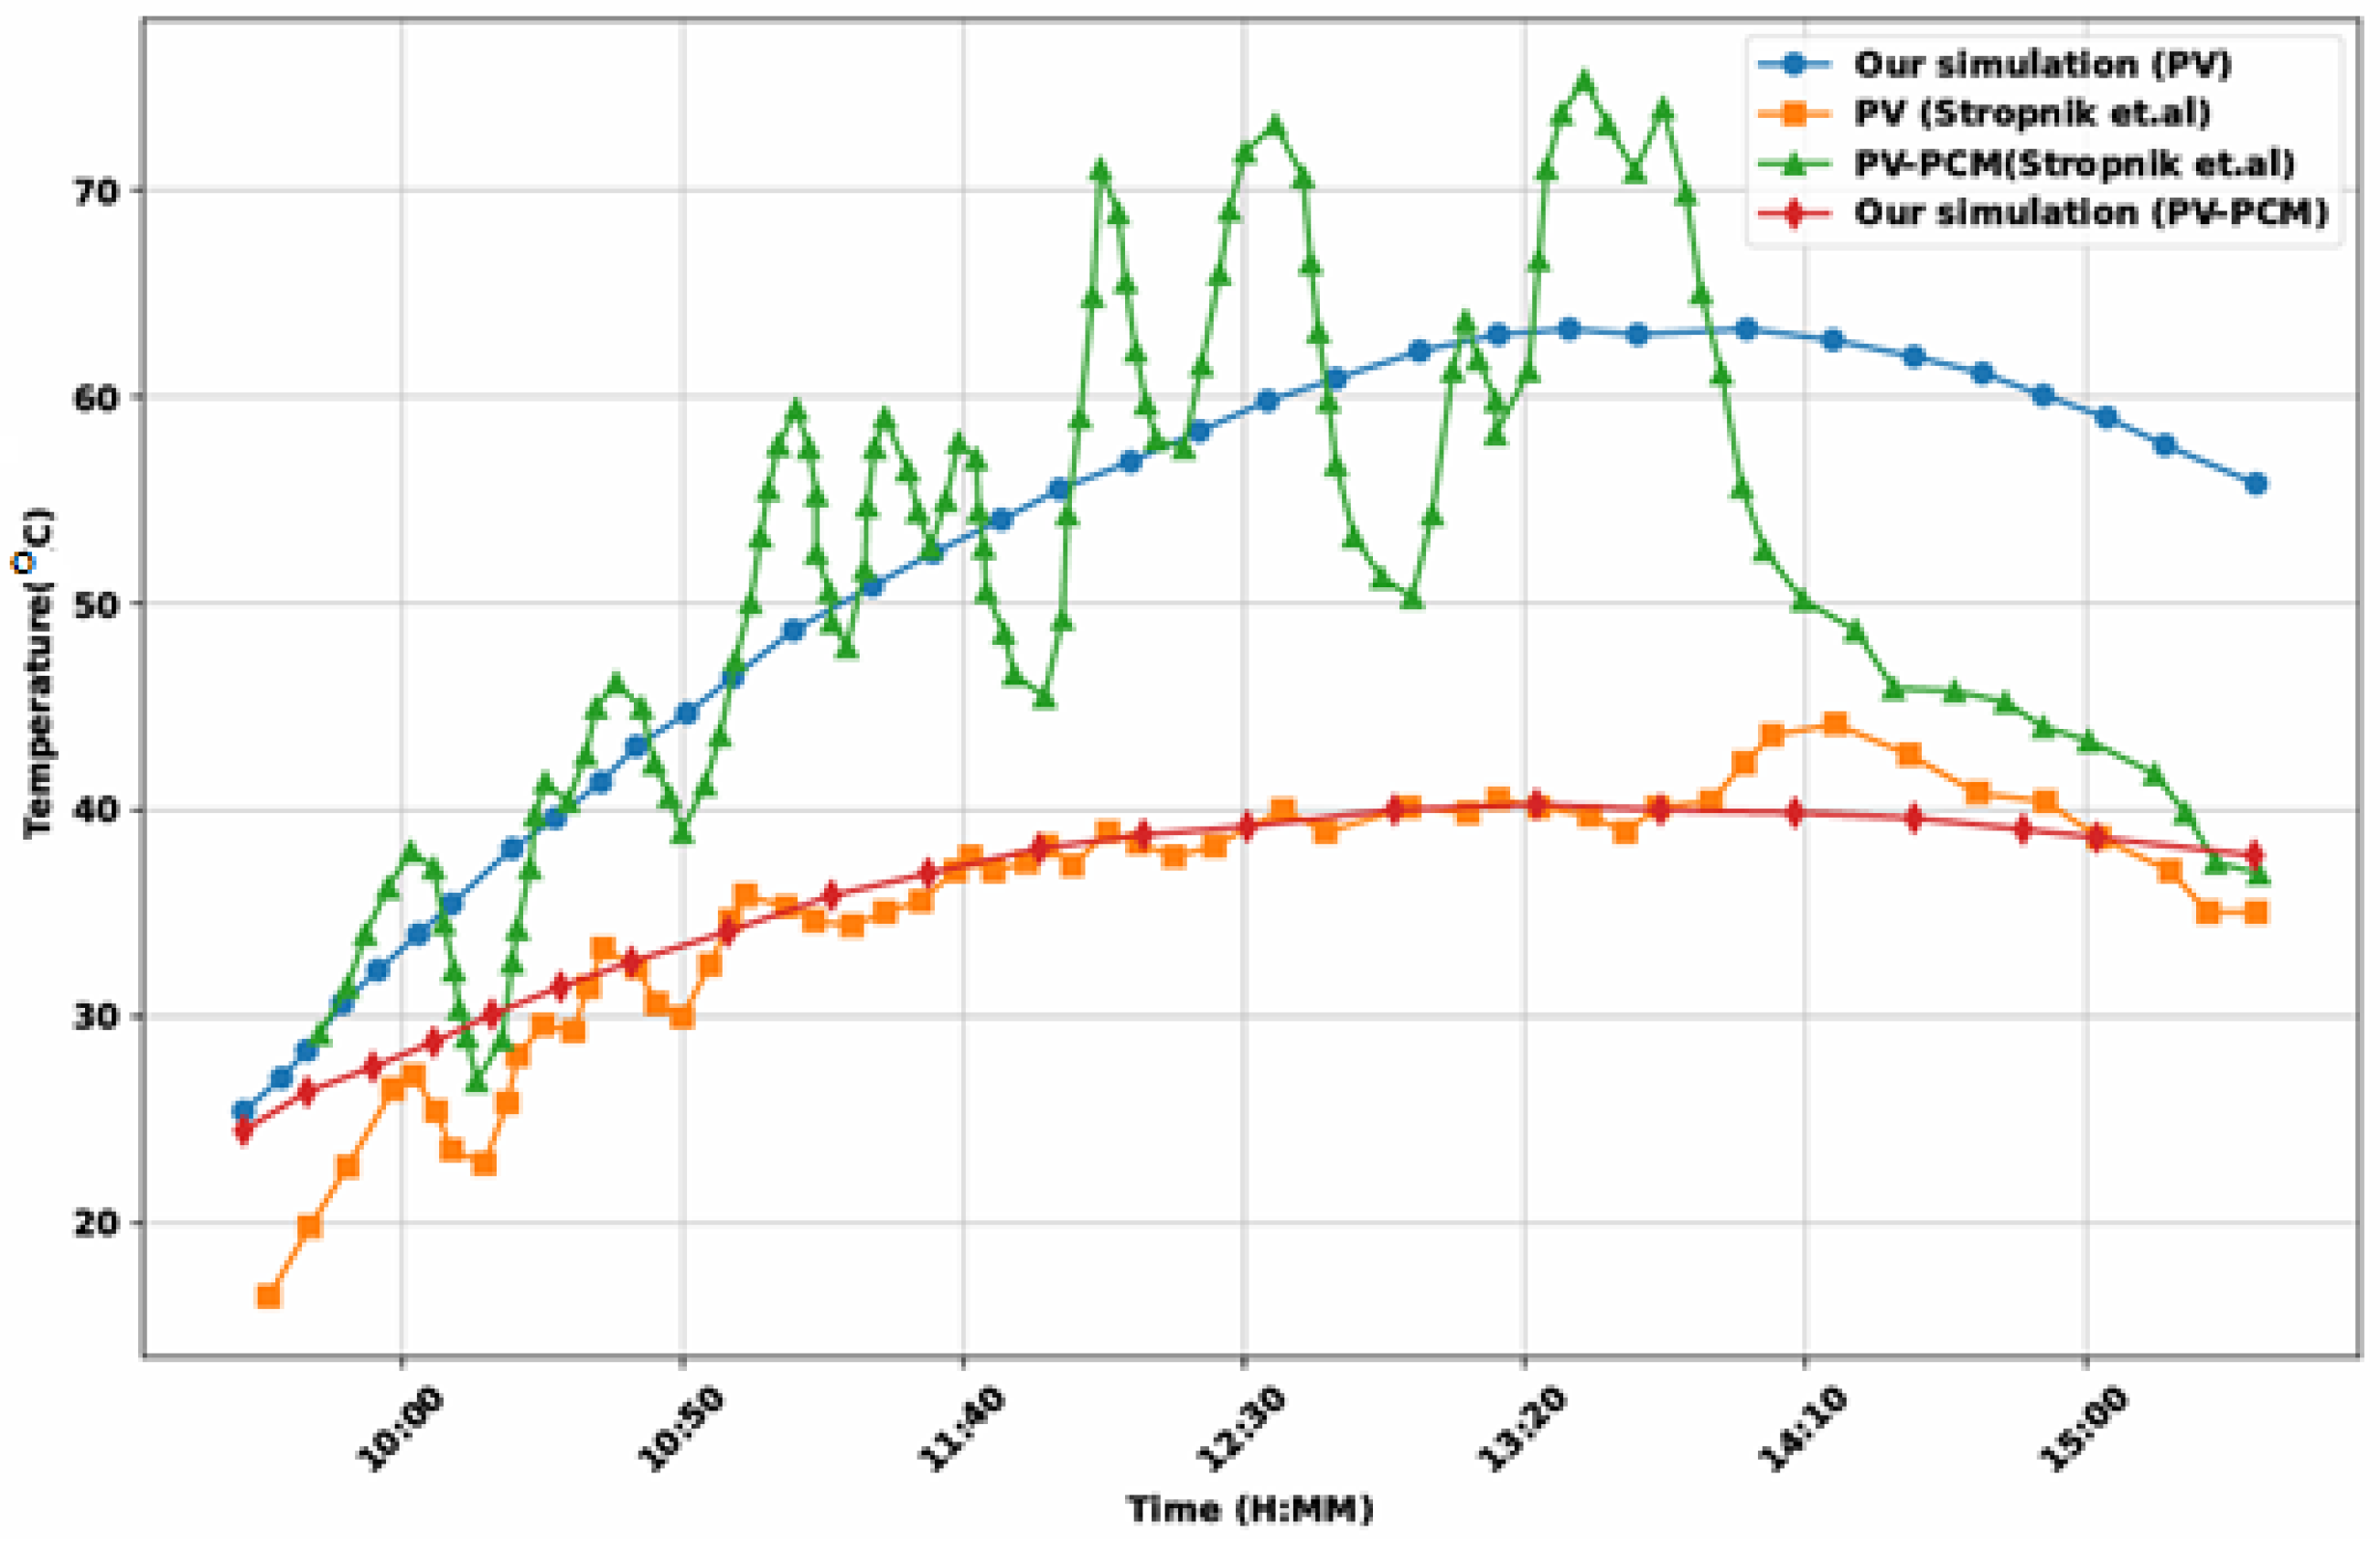
Prior to presenting the validation results, the transient ANSYS Fluent-2021 R1 model was benchmarked against the experimental results reported by Stropnik et al. [
15]. The comparison focused on the module’s surface temperature and PV-PCM system under the same irradiance and ambient conditions. Simulated temperature profiles closely followed the experimental data, as shown in
Figure 5.
5. Result and Discussion
The solar irradiance average monthly profile is shown in
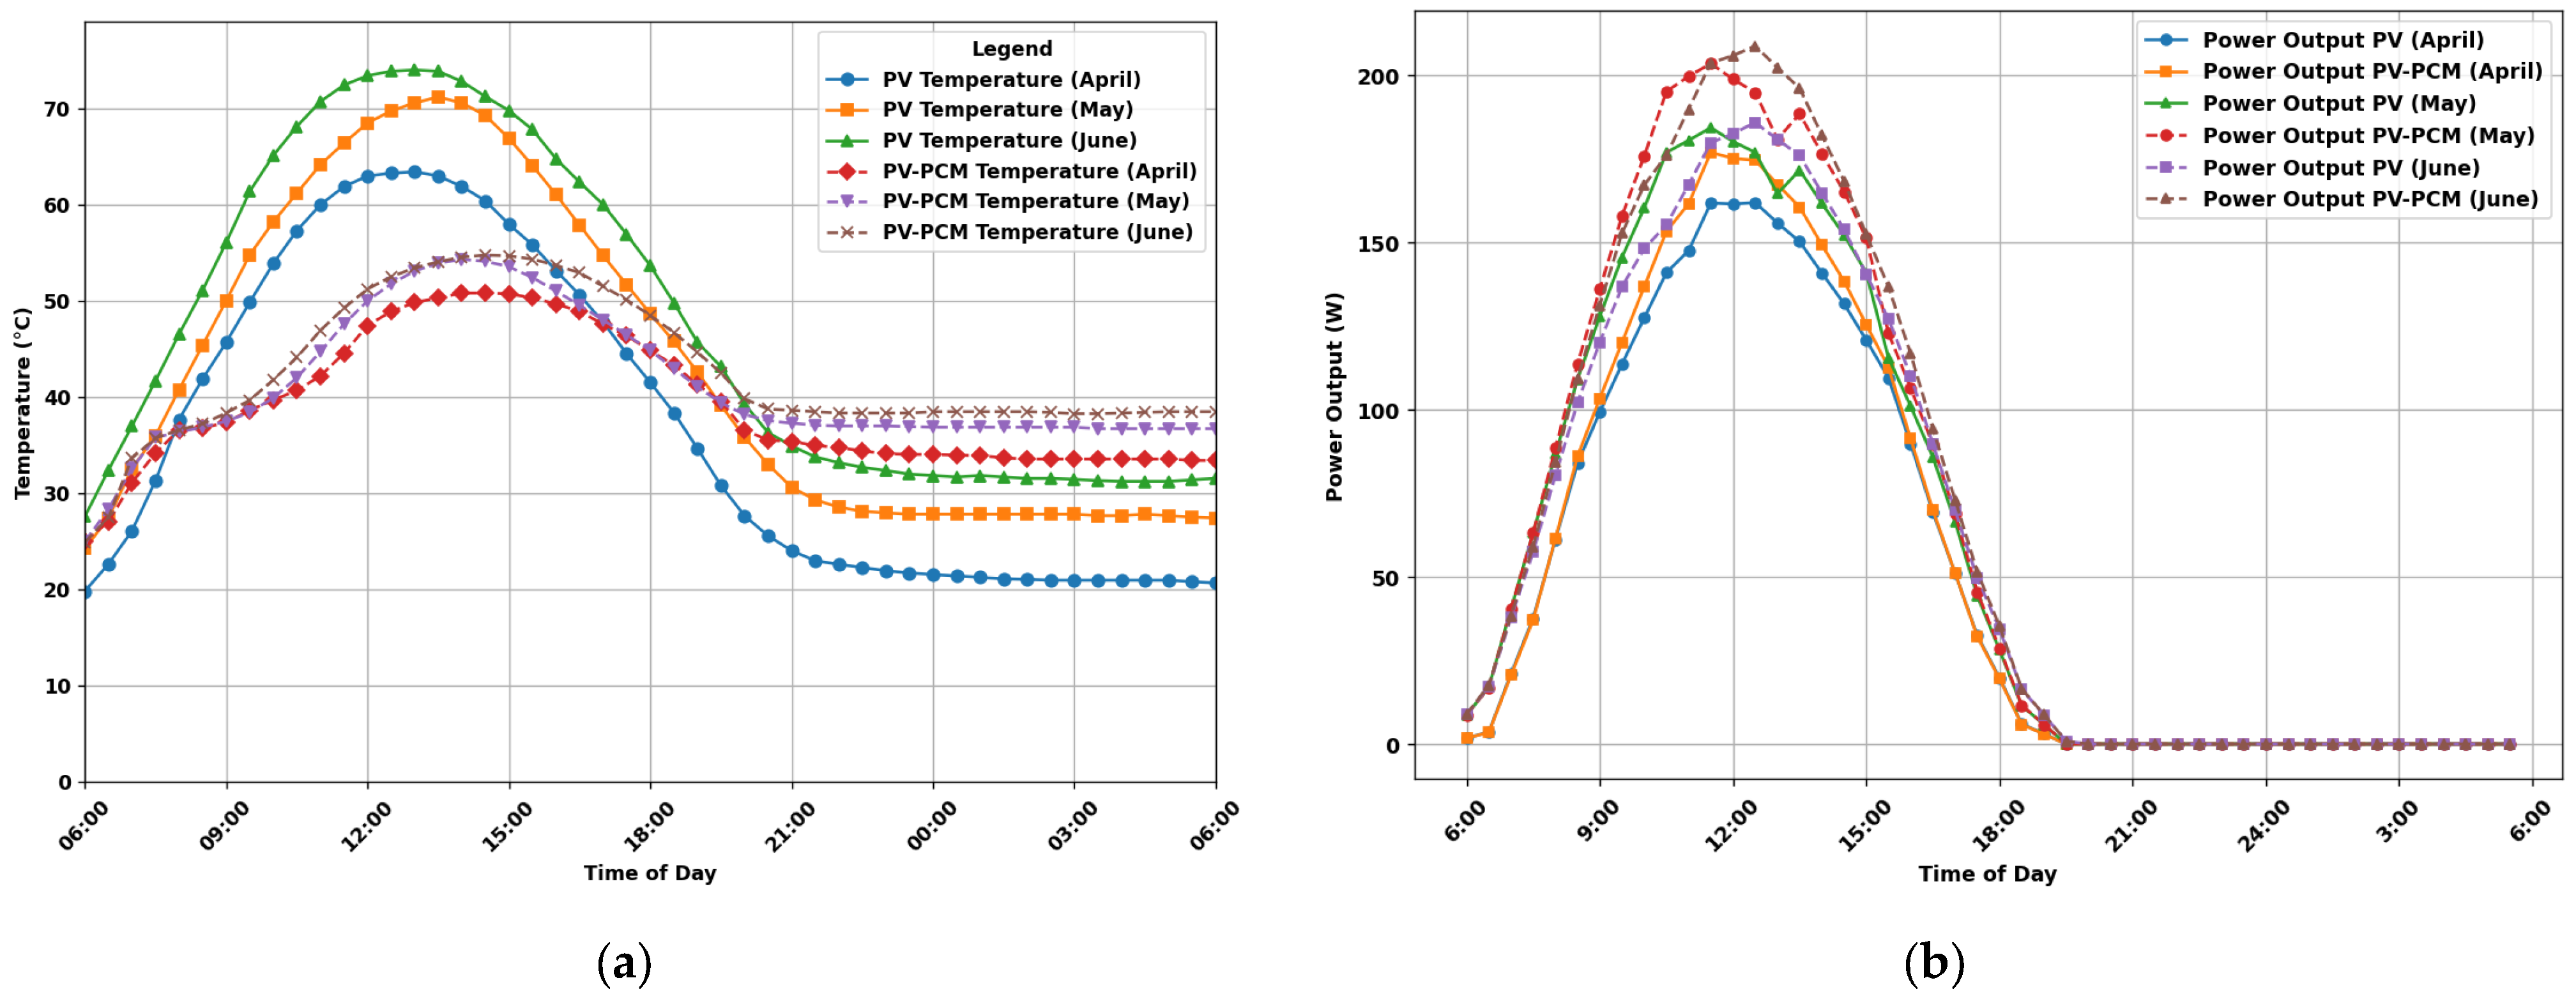
Figure 6. The thermal performance of the photovoltaic (PV) panel was then assessed for the months of April, May, and June under these real weather conditions in Islamabad. The temperature profiles of the PV panel (without PCM) demonstrate a clear diurnal trend, rising sharply from early morning and peaking around 13:00–14:00. As shown in
Figure 6, the highest surface temperature is observed in June, reaching approximately 73 °C, followed by May at around 71 °C, and April with a relatively lower peak near 63 °C. This behavior is attributed to increased ambient temperature and solar irradiance in the summer months. The elevated panel temperature directly affects electrical efficiency due to increased thermal losses.
Correspondingly,
Figure 7b presents the variation in power output for the same months, calculated using MATLAB 9.14 R2023a/Simulink 10.7. The transient temperature and irradiance data were obtained from the CFD simulation, where the average surface temperature of the solar cell was recorded every 30 min over a 24 h period. These data were exported into an Excel spreadsheet. This Excel file was then imported into MATLAB 9.14 R2023a, where Simulink 10.7 was used to simulate the electrical behavior of the photovoltaic panel. Specifically, the Simscape Electrical Photovoltaic Array block was employed to model the 250 W solar panel. By feeding the time-dependent temperature and irradiance values into this block, the resulting power output was computed. The maximum power output occurs slightly before the peak temperature, aligning with the period of highest irradiance but before severe thermal degradation sets in. May produces the highest peak power (~195 W), slightly outperforming June despite higher temperatures in June, likely due to optimal irradiance and moderate thermal loss. April shows a smoother curve and lower overall output, in line with its relatively lower irradiance and temperature.
Incorporating phase change material (PCM) beneath the PV panel significantly reduced its operating temperature across all months. As depicted in
Figure 6, the peak temperature in June was brought down to approximately 55 °C, while May and April observed even lower peaks near 54 °C and 51 °C, respectively. This thermal buffering effect of PCM is evident, especially during midday hours, where heat absorption by the PCM delays temperature rise and flattens the peak.
As shown in
Figure 7b, the power output increases, reaching a peak of 195 W in May for the PV system, but when we attached a PCM to the PV we can observe that the power output is increased to 210, which accounts for the increase in the electrical efficiency by 6%.
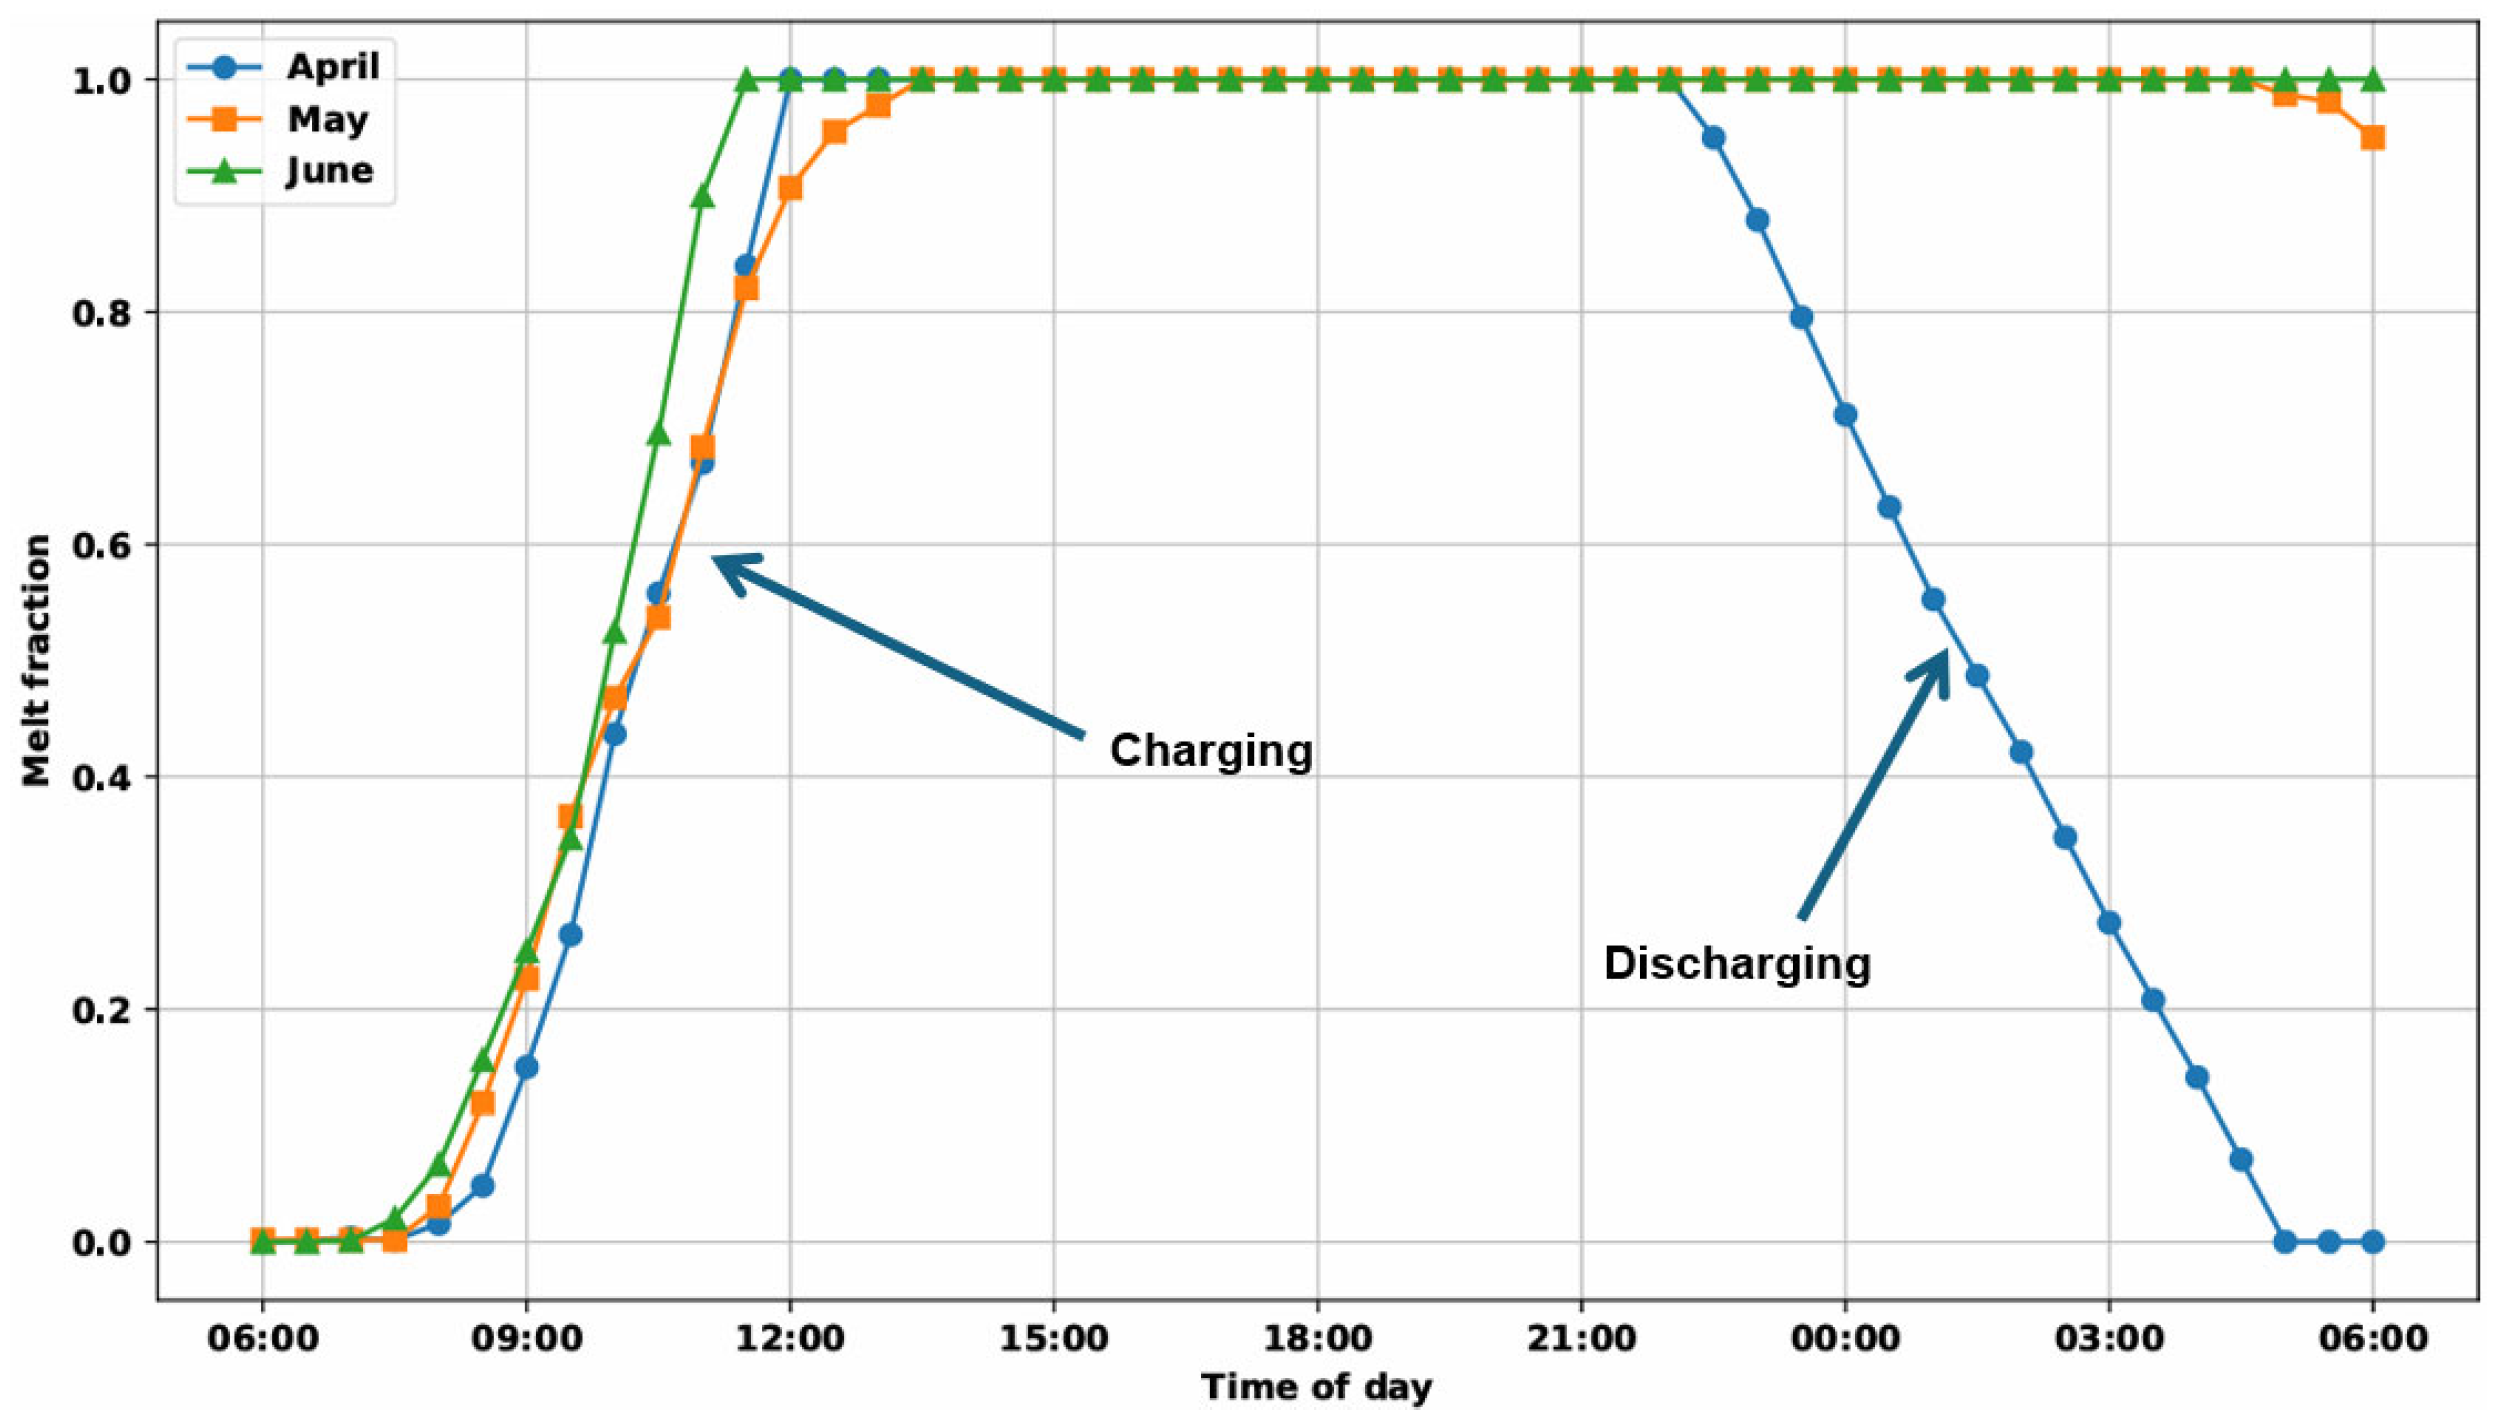
As shown in
Figure 8, all three months reach 100% melting, but complete solidification (the solidification melting is determined by taking the volumetric average of the PCM layer) within a 24-h cycle occurs only in April. In May, resolidification merely begins, and in June, no solidification takes place at all.
Figure 9a shows a contour plot of temperature distribution across the PV panel under peak irradiation. The temperature is lower towards the edges of the PV panel due to greater contact surface, resulting in better heat transfer with the ambient. Away from the ambient, higher temperature in the middle region of the solar panel.
Figure 9b shows the melt fraction contour across a cross-section of the PCM for three different scenarios (10%, 50% and 100% melting). It can be observed that the melting initiates from the top surface and proceeds layer by layer towards the bottom. At any moment, a layer of PCM lying closer to the PV panel exhibits a higher melt fraction than the lower layer, until all of the PCM melts completely.
6. Conclusions
This study presents a detailed numerical investigation of the thermal and electrical performance enhancement of a photovoltaic (PV) panel integrated with phase change material (PCM) under the climatic conditions of Pakistan for the months of April, May, and June. The transient thermal analysis was carried out using ANSYS Fluent 2021 R1, and the resulting thermal profiles were coupled with MATLAB 9.14 R2023a/Simulink 10.7 to evaluate the power output of the system.
The integration of PCM beneath the PV panel led to a significant reduction in panel surface temperature, with a maximum temperature drop of up to 15 °C observed during peak solar hours. This thermal regulation directly contributed to an enhancement in electrical performance, resulting in an average efficiency improvement of approximately 6% compared to the bare PV system. While all three months achieve a 100% melt fraction, only April completes full solidification within a 24 h cycle—May shows just the onset of solidification, and June exhibits no solidification at all over the same period.
Author Contributions
Conceptualization, M.A. (Muzaffar Ali) and G.L.; methodology, N.U.H.S. and M.A. (Mohsin Ali); software, M.A. (Mohsin Ali) and N.U.H.S.; validation, M.A. (Muzaffar Ali) and A.F.; formal analysis, investigation, resources, and data curation, M.A. (Mohsin Ali) and A.F.; writing—original draft preparation, M.A. (Mohsin Ali); writing—review and editing, M.A. (Muzaffar Ali), N.U.H.S. and G.L.; visualization, M.A. (Mohsin Ali) and A.F.; supervision, M.A. (Muzaffar Ali) and G.L.; project administration, M.A. (Muzaffar Ali). All authors have read and agreed to the published version of the manuscript.
Funding
This research received no external funding.
Institutional Review Board Statement
Not applicable.
Informed Consent Statement
Not applicable.
Data Availability Statement
Dataset is available on request from the authors.
Conflicts of Interest
The authors declare no conflict of interest.
References
- Yadav, A.; Khalid, M.B. The Effect of Temperature on Photovoltaic Power Generation. In Proceedings of the 2023 International Conference on Computational Intelligence and Knowledge Economy (ICCIKE), Dubai, United Arab Emirates, 9–10 March 2023; pp. 473–477. [Google Scholar] [CrossRef]
- Desai, A.; Joshi, T.; Mukhopadhyay, I.; Ray, A. Effect of Temperature on Conversion Efficiency of Single-Phase Solar PV Inverter. In Proceedings of the Photovoltaic Specialists Conference, Fort Lauderdale, FL, USA, 20–25 June 2021; pp. 2376–2381. [Google Scholar] [CrossRef]
- Ale, T.O.; Rotipin, K.J.; Makanju, T.D. Temperature Effects on Optimal Performance of PV Module. J. Eng. Adv. 2022, 3, 162–165. [Google Scholar] [CrossRef]
- Kumar, M.S.; Balasubramanian, K.R.; Maheswari, L. Impact of Temperature on the Effectiveness of Solar Photovoltaic Panels. Res. Dev. Eng. Res. 2023, 3, 89–96. [Google Scholar] [CrossRef]
- Hassabou, A.; Isaifan, R.J. Simulation of Phase Change Material Absorbers for Passive Cooling of Solar Systems. Energies 2022, 15, 9288. [Google Scholar] [CrossRef]
- Mehmood, M.; Shah, N.U.H.; Ali, M.; Biwole, P.H.; Sheikh, N.A. Simplified mathematical model and experimental analysis of latent thermal energy storage for concentrated solar power plants. J. Energy Storage 2021, 41, 102871. [Google Scholar] [CrossRef]
- Maghrabie, H.M.; Hassan, S.E.-D.; El-Maghraby, A.S.; Salem, E.A. Performance enhancement of PV panels using phase change material (PCM): An experimental implementation. Case Stud. Therm. Eng. 2023, 42, 102741. [Google Scholar] [CrossRef]
- Prakash, K.; Sahoo, P.K.; Patel, M.K.; Panda, S.S. Energy and exergy enhancement study on PV systems with phase change material. Sustainability 2023, 15, 3627. [Google Scholar] [CrossRef]
- Sheik, M.A.; Aravindan, M.; Beemkumar, N.; Chaurasiya, P.K.; Jilte, R.; Shaik, S.; Afzal, A. Investigation on the thermal management of solar photovoltaic cells cooled by phase change material. J. Energy Storage 2022, 52, 104914. [Google Scholar] [CrossRef]
- Arifin, Z.; Sopian, K.; Zaidi, S.Y.A.; Al-Waeli, H.A.; Ahmadi, M.H. The effect of soybean wax as a phase change material on the cooling performance of photovoltaic solar panel. Int. J. Heat Technol. 2022, 40, 326–332. [Google Scholar] [CrossRef]
- Al-Waeli, A.H.A.; Sopian, K.; Kazem, H.A.; Chaichan, M.T. Phase change materials for enhanced photovoltaic panels performance: A comprehensive review and critical analysis. Renew. Sustain. Energy Rev. 2024, 191, 114123. [Google Scholar]
- Sathish, D.; Veeramanikandan, M.; Sudhakar, K.; Tamilkkolundu, T. A recent review on thermal management of photovoltaic panels using phase change material based on thermal conductivity enhancers for sustainable energy. J. Energy Storage 2024, 103, 113297. [Google Scholar]
- Abdo, S.; Al-Yasiri, Q.; Abed, Q.M.; Huynh, B.P. Modelling and optimization of phase change materials (PCM)-based passive cooling of solar PV panels in multi climate conditions. Front. Energy Res. 2023, 11, 1121138. [Google Scholar] [CrossRef]
- Firoozzadeh, M.; Ahmadi, G.; Moosavi, A. Thermodynamics assessment on cooling photovoltaic modules by phase change materials (PCMs) in critical operating temperature. J. Therm. Anal. Calorim. 2021, 144, 1239–1251. [Google Scholar] [CrossRef]
- Stropnik, R.; Stritih, U. Increasing the efficiency of PV panel with the use of PCM. Renew. Energy 2016, 97, 671–679. [Google Scholar] [CrossRef]
- Bejan, A.S.; Labihi, A.; Croitoru, C.V.; Catalina, T.; Chehouani, H.; Benhamou, B. Experimental investigation of the charge/discharge process for an organic PCM macroencapsulated in an aluminium rectangular cavity. E3S Web Conf. 2018, 32, 01004. [Google Scholar] [CrossRef]
- NASA Langley Research Center Prediction of Worldwide Energy Resources (POWER) Project. Data Access Viewer (DAV). Available online: https://power.larc.nasa.gov/data-access-viewer/index.html (accessed on 1 August 2025).
| Disclaimer/Publisher’s Note: The statements, opinions and data contained in all publications are solely those of the individual author(s) and contributor(s) and not of MDPI and/or the editor(s). MDPI and/or the editor(s) disclaim responsibility for any injury to people or property resulting from any ideas, methods, instructions or products referred to in the content. |
© 2025 by the authors. Licensee MDPI, Basel, Switzerland. This article is an open access article distributed under the terms and conditions of the Creative Commons Attribution (CC BY) license (https://creativecommons.org/licenses/by/4.0/).
