Abstract
Parkinson’s disease (PD) is one of the most common neurodegenerative diseases, affecting millions of people worldwide, especially among the elderly population. It has been demonstrated that handwriting impairment can be an important early marker for the detection of this disease. The aim of this study was to propose a simple and quick way to discriminate PD patients from controls through handwriting tasks using machine-learning techniques. We developed a telemonitoring system based on a user-friendly application for drawing tablets that enabled us to collect real-time information about position, pressure, and inclination of the digital pen during the experiment and, simultaneously, to supply visual feedback on the screen to the subject. We developed a protocol that includes drawing and writing tasks, including tasks in the Italian language, and we collected data from 22 healthy subjects and 9 PD patients. Using the collected signals and data from a preexisting database, we developed a machine-learning model to automatically discriminate PD patients from healthy control subjects with an accuracy of 77.5%.
1. Introduction
Parkinson’s disease (PD) is one of the most common neurodegenerative disorders in the world, second only to Alzheimer’s disease [1]. The differential diagnosis of PD is still an ongoing challenge for the scientific community: to this day, confirmation of the disease is available only postmortem and the rate of misdiagnosis is high; it has been estimated that 25% of diagnoses are incorrect [2]. The main cause of PD is the lack of dopamine production, and its main motor symptoms are bradykinesia, tremor, and rigidity [3]; neurologists rely on imaging techniques such as MRI (Magnetic Resonance Imaging), CT (Computed Tomography), or PET (Positron Emission Tomography), and patient clinical evaluations [3]. Machine-learning techniques have been studied to help the diagnosis of PD and have shown promising results. Pereira et al. presented a review on recent studies concerning computer-assisted methods to aid PD recognition [4], which included speech, gait, and handwriting analysis. This work is part of a home-monitoring project that aims to aid in PD detection through a combined analysis of graphological and vocal signals [5]. An accuracy of 98.5% was reached through the analysis of vocal data from 55 subjects: 18 healthy control subjects and 33 drug-free and newly diagnosed PD patients.
In this study, we focused on handwriting of PD subjects; handwriting requires a complex coordination of consecutive movements, and the motor symptoms of PD can provoke handwriting impairments in the size of letters, which is referred to as micrographia, and in the pressure and kinematics of the pen [6,7], together with a general difficulty in writing, which involves different graphological patterns. Since “graphology is a discipline that deals with the dynamic study of the graphic gesture” [8], we based our analysis on computational graphology. Several studies have investigated the most relevant writing features and tasks for the diagnosis of PD. Reference [9] presents the state of the art of these studies. It is possible to collect relevant information from drawings (Archimedean spiral [10,11,12,13,14,15], circles [16], meanders [13,14], etc.) and from handwritten words and graphemes. The drawing of an Archimedean spiral (spirography) is a common task for tremor and other movement disorder analysis [10]. Thanks to the development of digitizing tablet technologies, it is possible to analyze not only the offline images, but also the kinematic characteristics of the graphic signal and the pressure applied to the tablet [17,18]. “Online” data are those collected while the user writes, while “offline” data are those available after the writing is completed [19].
In the past decade, important databases have been constructed in order to study handwriting impairments in PD: the PaHaW database [11], which includes real-time data (pen position, pen pressure, and pen inclination) collected from 38 PD patients and 37 control subjects, and the HandPD [13] and NewHandPD [14] databases, which include offline images collected by Pereira et al.
Dròtar et al., analyzing the PaHaW database, obtained an accuracy of 85.61% [20]; they demonstrated the relevance not only of the on-tablet movements, but also of the in-air movements, i.e., the variation of the pen position while the pen is not touching the table. Considering only the spiral task, they obtained an accuracy of 62.8% [12].
The aim of this work was to analyze handwriting signals from both PD patients and control subjects and to propose a way to automatically distinguish these two classes. In order to collect the necessary data, we developed a telemonitoring system based on a user-friendly application for drawing tablets that enabled us to collect real-time information about the digital pen during the experiment and, simultaneously, to supply visual feedback on the screen to the subject. Through this system, data can be collected remotely in order to allow patients to execute tasks in the comfort and safety of their home, reducing the demand on hospital services. We decided to propose a protocol to explore writing and drawing impairments, including specific tasks for subjects who declared Italian as their first language, since, to our knowledge, the literature is lacking in automatic handwriting classification studies with Parkinson’s subjects whose first language is Italian.
2. Methods and Materials
In this study, we collected data from 22 healthy subjects and from 9 PD patients. The data from the PD subjects were collected thanks to a collaboration with the Casa di Cura Le Terrazze institute. All participants were right-handed except for one PD patient, with an age in the range of 60 ± 25 years. Information about subjects’ age, gender, dimensions of the hand, and level of education are collected in Table 1. The educational level was classified according to UNESCO’s ISCED 2011 (International Standard Classification of Education) [21]. This classification distinguishes nine levels of education, from early child education (level 0) to doctoral or equivalent level (level 8). These levels can be aggregated into three categories: low (0–2), medium (3–4), and high (5–8) [22]. The hand dimension was quantified by measuring the distance between the wrist and the top of the distal phalanx of the dominant hand’s middle finger.

Table 1.
Subject data. For each group (healthy control (C) or subject with Parkinson’s disease (PD)), the age and the number of males and females are specified. Information about the anatomical measurements of the hand and the level of education is indicated only for the control group.
Information about the PD patients is collected in Table 2. For every patient, the Hoehn and Yahr Scale level is indicated. The Hoehn and Yahr Scale is a clinical scale used to describe the progressive motor impairment of subjects with PD [23]. This scale goes from 1 to 5 in order of severity of the motor symptoms; the first level corresponds to only unilateral involvement with minimal motor dysfunction, while the fifth and last stage corresponds to a more serious level of motor dysfunction wherein the subject is confined to bed or wheelchair unless aided. Table 2 also indicates the side of the body affected by the motor dysfunction (left, right or bilateral if both sides are involved), years since the diagnosis of PD, and the levodopa-equivalent daily dose (LEDD) corresponding to each PD patient.
Table 2.
This table shows, for every PD patient, the Hoehn and Yahr Scale level (H&Y), the side of the body affected, the years since the PD diagnosis, and the levodopa-equivalent daily dose (LEDD) assumed by the subject.
A commercial Wacom One drawing tablet with a screen was used for this test in order to be able to extract both “online” and “offline” features. Wacom tablets are widely used in handwriting movement analysis, as they offer high spatial and temporal resolution [9].
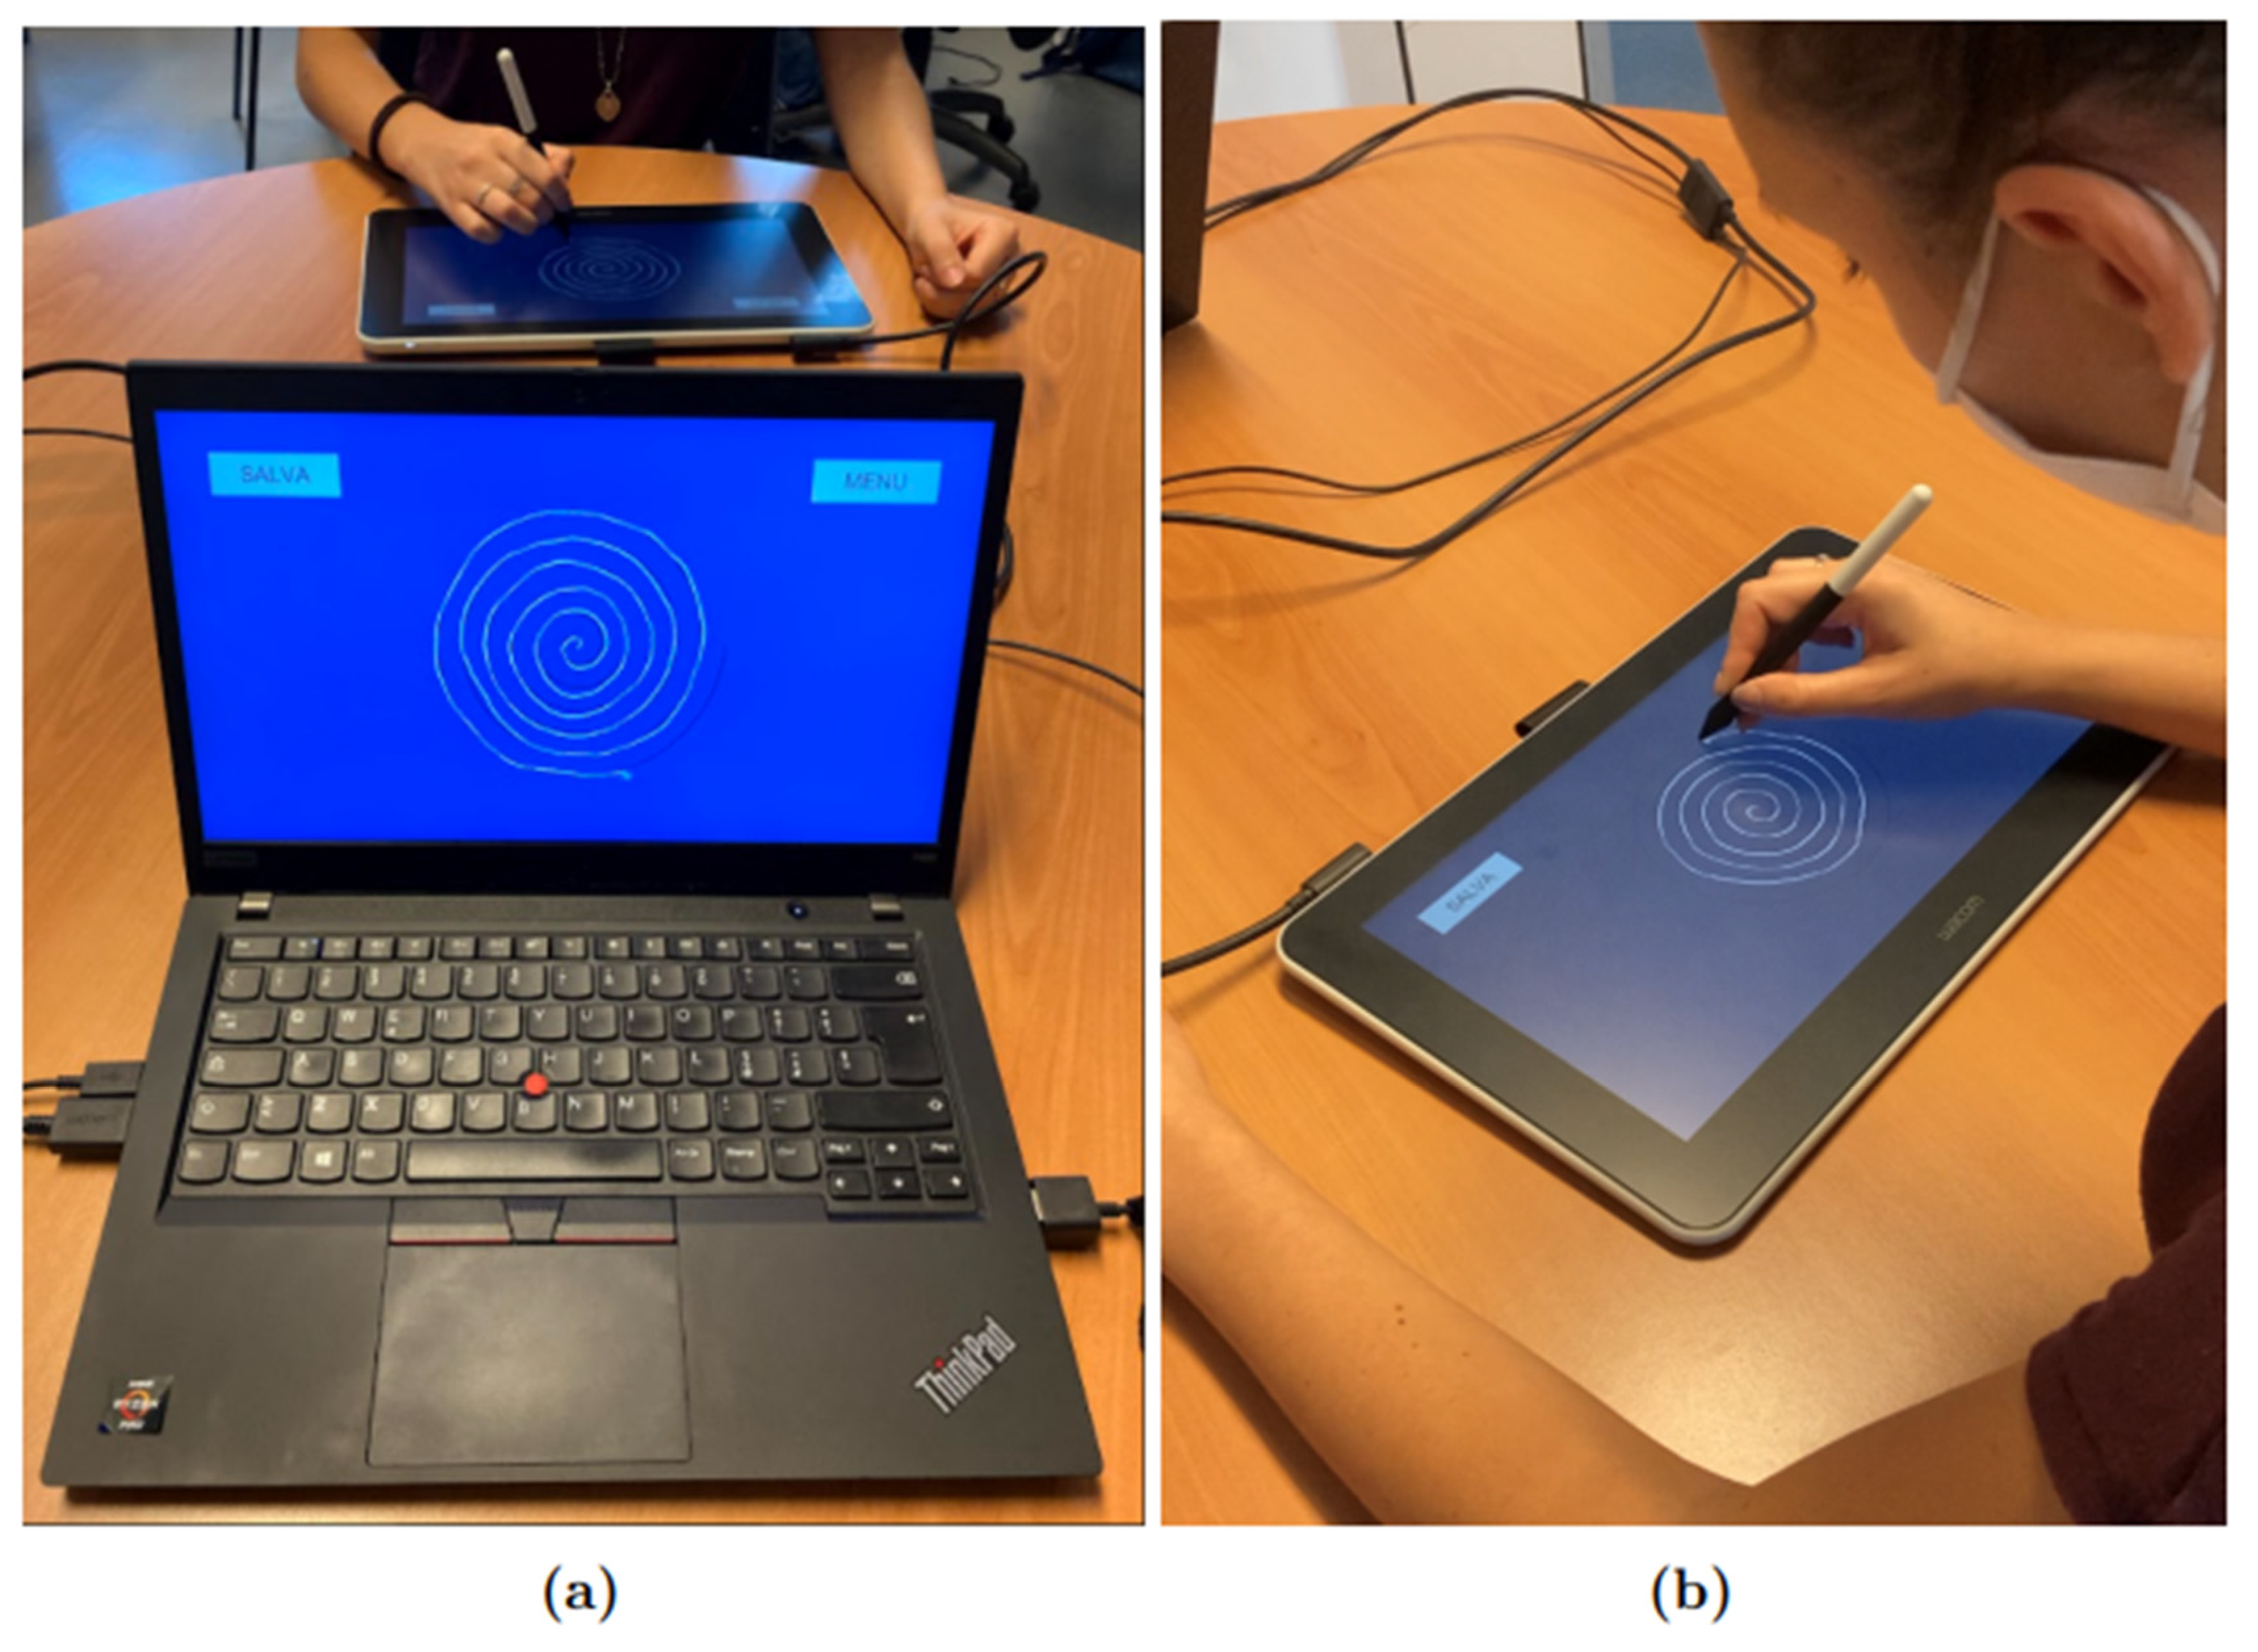
An application was developed by our team using the development platform Unity, which allowed us to collect information about pen position , pressure, and inclination with a frequency of 133 Hz and, simultaneously, to supply visual feedback on the tablet’s screen to the subjects. For the protocol, the Wacom tablet was connected to a Lenovo Thinkpad T495 computer with Windows 10 as the operating system. The “Duplicate” modality was selected in order to have the same screen shown on the computer and the Wacom One tablet, as shown in Figure 1; Figure 1a shows the point of view of the operator, while Figure 1b shows the point of view of the participant.

Figure 1.
Experimental setup: (a) shows the operator’s point of view, while (b) shows the participant’s point of view. The subject uses the Wacom tablet to complete the protocol tasks, while the operator follows the experiment in real time from the monitor of his computer.
The application has a start page where the participant’s ID can be entered and which includes a menu from which the user can choose which task to take. The data are saved locally in different.tsv files for every acquisition.
In order to analyze the data, we used the software MATLAB.
The protocol was divided into four parts: drawing an Archimedean spiral, writing the bigram “le” six times and two Italian sentences, drawing ten concentric circles, and writing seven lines of free text. For each part of the protocol, a different screen was shown to the subject: firstly, an image of an Archimedean spiral was shown and the subject was asked to trace it at a comfortable speed; secondly, a blank screen was shown and the subject was asked to write six times in cursive the bigram “le” and the two Italian phrases: “I fiori sono sul prato” and “Nel cielo ci sono le stelle”. On the third screen, a circle was shown and the subject was asked to draw ten concentric circles inside it. Lastly, a blank screen was shown and the subject was asked to write seven lines of free text in cursive. The overall duration of the test varied between 10 and 15 min from subject to subject. The subjects were given the opportunity to try the tablet before the test. During the execution of the tasks, the subjects were seated in a comfortable position on a chair without armrests, and the tablet was positioned on a table in front of them.
Features were extracted separately from each task.
Data were separated into components, i.e., lines that are traced without lifting the pen from the tablet. In order to do that automatically, indices of the samples where pressure went from positive to zero and vice versa were saved in a vector of markers. Both in-air and on-tablet features were extracted.
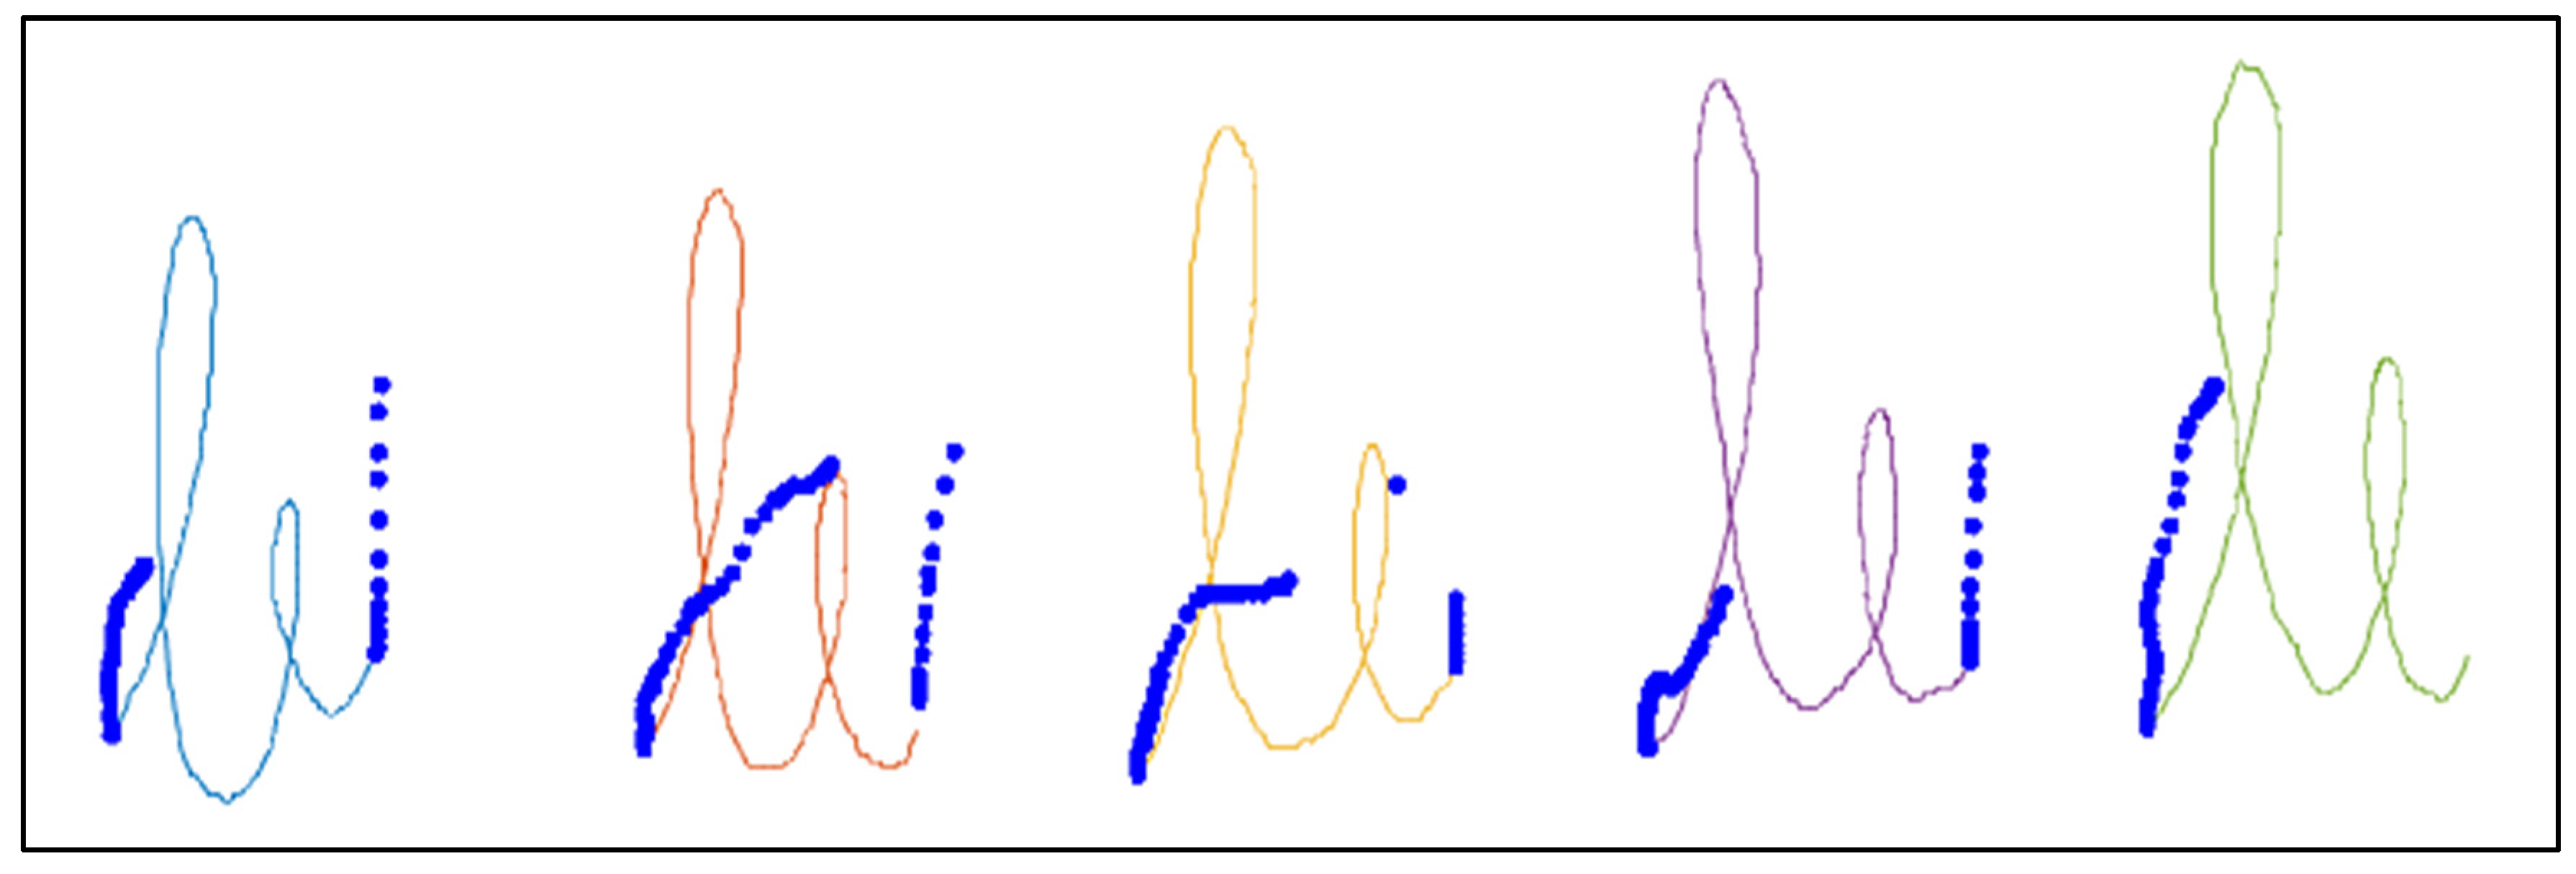
Figure 2 shows an example of the “le” bigram task, where the different components, automatically detected, are represented in different colors and the “in-air” points of the pen position are represented as blue points. For each component, the velocity was calculated as follows:
where and ,
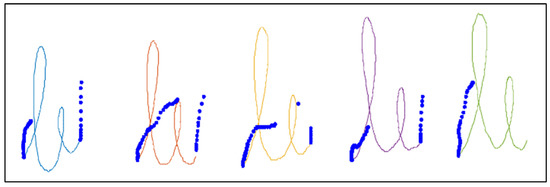
Figure 2.
Image of the “le” bigram task written by a healthy control subject from our dataset. The “in-air” points of the pen position are represented in blue. Different components of the “on-tablet” pen position are represented in different colors.
Where xi, yi, and ti correspond to the pen position along x, pen position along y and time at a specific index i of the recorded data, respectively.
Acceleration and jerk of the components were also calculated. To analyze the spiral, the angular and radial velocity were calculated. Furthermore, the distance of the drawn spiral from the spiral guide was calculated using the following algorithm:
- For each point of the drawn spiral , we found the spiral guide’s closest point to it, .
- We calculated the distance of each couple of points , , as
- We found the parameterthat describes how much the drawn spiral is distant from the spiral guide. A smaller value of p meant a higher precision.
Furthermore, the power spectral density between 4 Hz and 9 Hz of the absolute velocity of the pen during the spiral task was calculated as a feature.
In order to develop a model for automatic classification of PD, we used data from 36 PD subjects and 35 healthy control subjects from the PaHaW dataset and data from the 22 healthy control subjects and 9 PD patients that we collected in our database. Two tasks that the two databases have in common were analyzed: the guided spiral and the bigram “le”. The features that were considered are reported in Table 3.
Table 3.
Features extracted: 1 if the feature was extracted from the spiral task analysis, 2 if the feature was extracted from the “le” bigram task analysis.
After the feature extraction, we proceeded with the selection of the most significant features and the generation of the classification model. In Figure 3, a scheme of the workflow is presented.
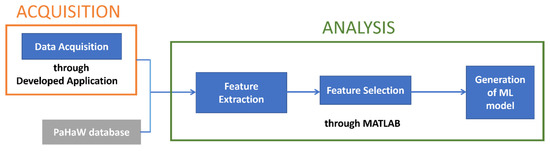
Figure 3.
Workflow diagram of the process.
3. Results and Discussion
In order to discriminate between PD patients and healthy control subjects, three models were constructed: one using only data from the spiral task, one using only data from the “le” bigram task, and one using data from both of them.
We selected the most discriminant features using a Mann–Whitney test (p < 0.05). Table 4 presents the features with the lowest p-scores, divided per task.
Table 4.
Feature ranking. The left column presents the most discriminant features for the spiral task, and the right column presents the most discriminant features for the “le” task.
A 10-fold cross-validation was conducted. Results are reported in Table 5. Accuracy, specificity, sensitivity, F1 score, and precision were calculated in terms of TP (true positive), FP (false positive), TN (true negative), and FN (false negative), as follows:
Table 5.
Model used and classification accuracy, specificity, sensitivity, F1 score, and precision of the two tasks analyzed separately and of the two tasks combined.
Considering the two tasks separately, we obtained a higher accuracy for the “le” bigram tasks than for the spiral tasks.
Moreover, considering the spiral and the “le” bigram task separately, the accuracy that we obtained for the spiral (71.6%) was higher than the accuracy obtained for the spiral by Dròtar et al. (62.8%) and, similarly, considering only the “le” bigram task, the accuracy that we obtained (75.5%) was higher than the accuracy obtained by Dròtar et al. for this task (71%).
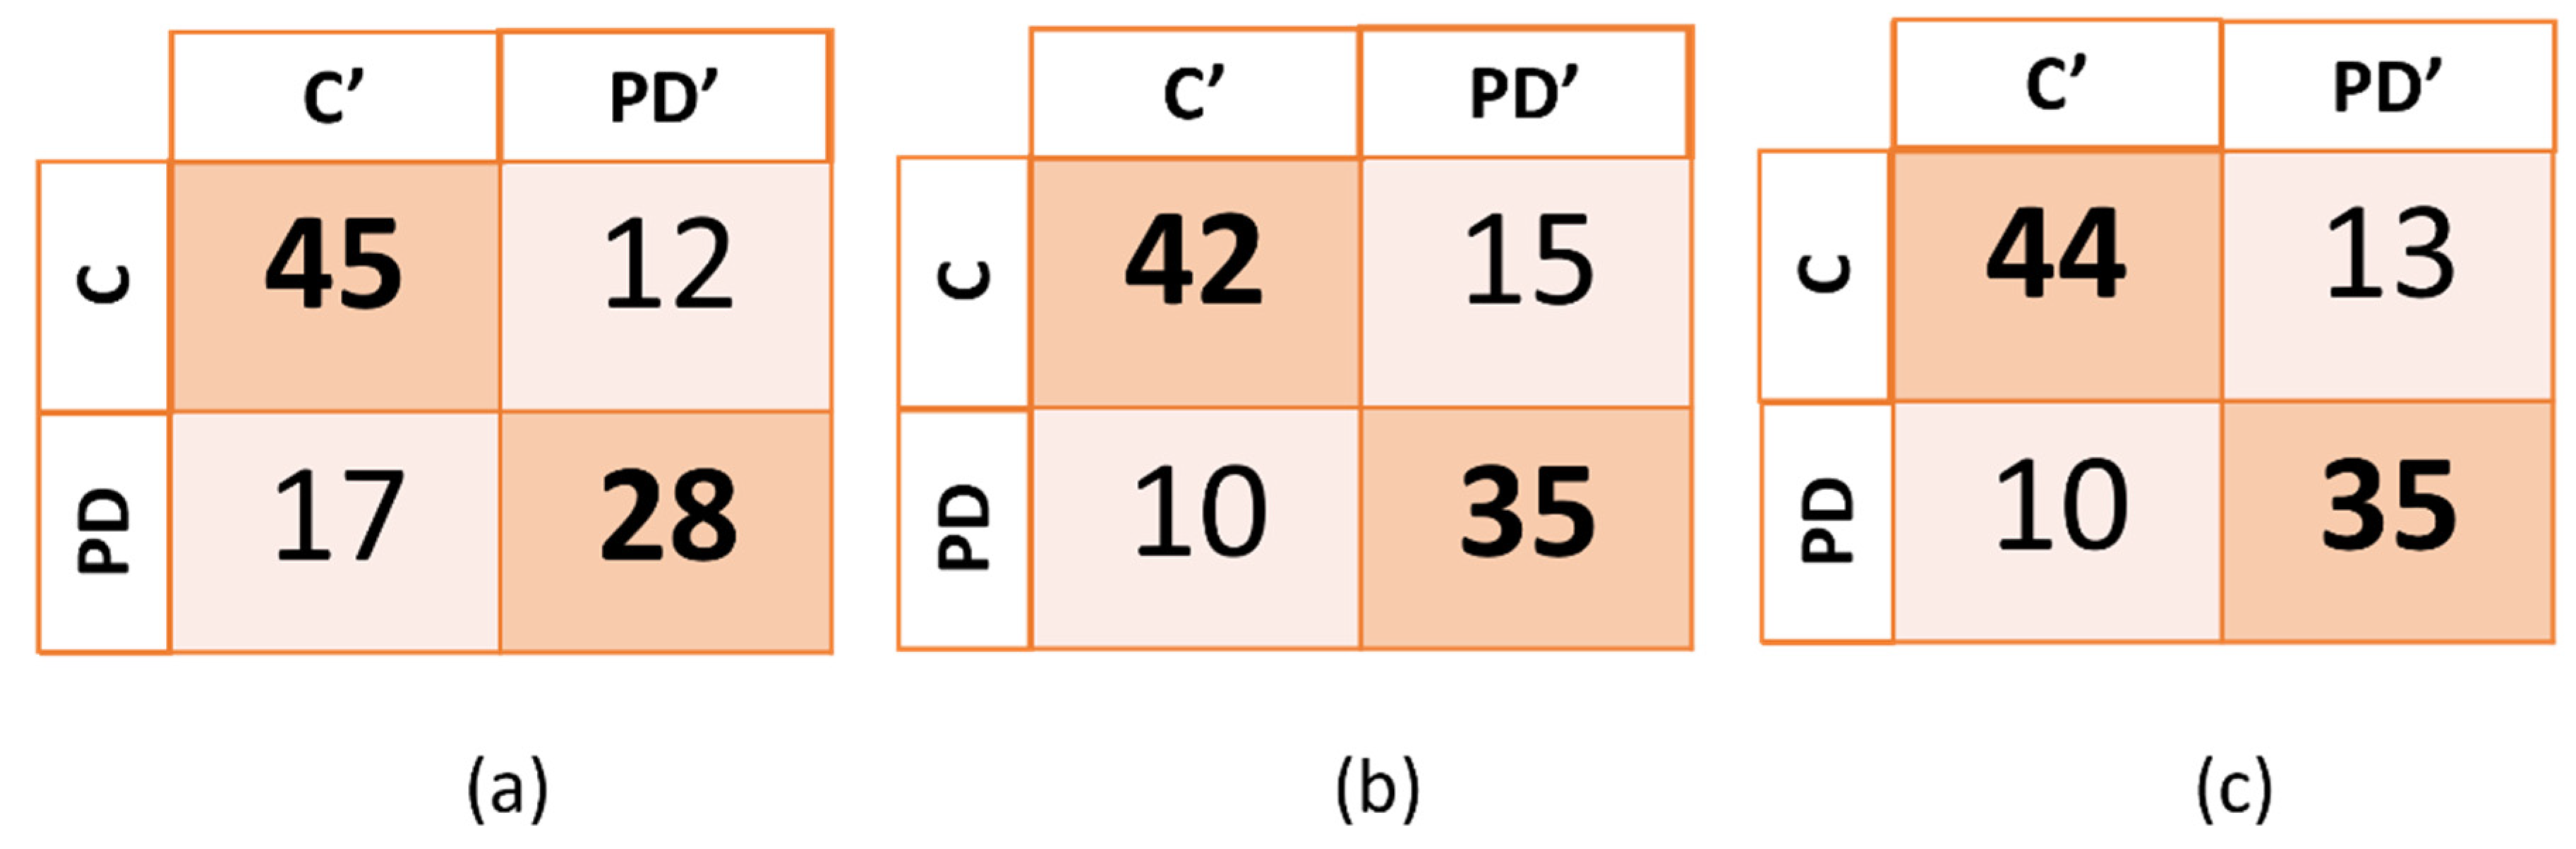
The confusion matrix for each one of the three models (spiral, “le” bigram and combined tasks) are reported on the Figure 4.
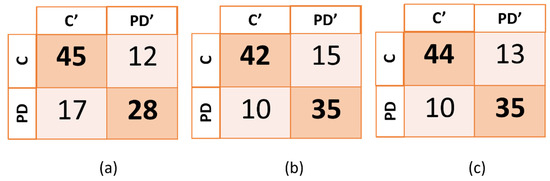
Figure 4.
Confusion matrix of the three models generated. In (a), (b), and (c), PD’ and C’ indicate, respectively, subjects that were predicted to be subjects with PD and control subjects, while PD and C indicate the true categories of the subjects. PD corresponds to PD patients and C corresponds to healthy control subjects.
The highest accuracy (77.5%) and sensitivity (77.8%) were obtained by combining the two tasks, while the highest specificity was obtained when using only the data from the spiral task. The machine-learning algorithms that were employed were the support vector machine (SVM) for the spiral task and the “le” bigram task, and the medium k-nearest neighbors (Medium KNN) for the combined tasks.
4. Conclusions
In this study, an application is presented that allowed us to register data from tablets with a frequency of 133 Hz, in order to aid the recognition of PD through handwriting impairments. The tool that is proposed is simple and easy to use, allowing subjects to complete the test in the comfort of their home.
Data from 22 healthy subjects and 9 PD patients were collected and added to the PaHaW database [11,20], a pre-existing dataset that includes data from PD patients and healthy control subjects. Using only two of the eight tasks that the PaHaW database includes, an accuracy of 77.5%, was obtained, close to the 85.61% accuracy that Dròtar et al. obtained when considering all the eight tasks together [20]. We could not compare the other tasks because the first language declared by our subjects (Italian) was different from the first language of the PaHaW database’s subjects (Czech).
The major limitations of this study are linked to the limited number of subjects involved and to the fact that we compared data from different databases, collected under different experimental conditions, such as the position of the subject during the tasks, and acquired with different devices, which could lead to a bias in the measurements. Moreover, subjects’ characteristics such as age could lead to misclassification; for example, a control subject could present some tremor or bradykinesia not linked to Parkinson’s disease, and for this reason could be misclassified as a PD subject.
However, the protocol that we developed can be used in future studies to collect more data from Italian PD subjects, in order to be able to create a model using only data from our protocol, using the combination of six tasks proposed here (drawing of an Archimedean spiral, writing the bigram “le”, writing two Italian phrases, drawing ten concentric circles, and writing seven lines of free texts.
Moreover, this work is part of a home-monitoring project that aims to aid in PD detection through a combined analysis of graphological and vocal signals [5].. The sets of subjects tested for the vocal tasks and the graphological tasks were different from each other, so we could not create a classification model using combined vocal and graphological data, but the aim of this project is to continue to collect both vocal and graphological data in order to create a single, more complete, classification model.
Author Contributions
Conceptualization, A.P. (Antonio Pallotti), A.P. (Alessandra Paffi) and G.M.; methodology, A.P. (Antonio Pallotti); software, M.F.; validation, M.F., A.P. (Alessandra Paffi), G.M., G.A., G.V. and A.P. (Antonio Pallotti); formal analysis, M.F. and F.C.; investigation, M.F. and A.P. (Antonio Pallotti); resources, M.F., G.A., G.V. and A.P. (Antonio Pallotti); data curation, A.P. (Antonio Pallotti); writing—original draft preparation, M.F. and A.P.(Antonio Pallotti); writing—review and editing, M.F. and A.P. (Antonio Pallotti); visualization, M.F. and A.P. (Antonio Pallotti); supervision, A.P. (Antonio Pallotti), A.P. (Alessandra Paffi) and G.M.; project administration, A.P. (Antonio Pallotti); funding acquisition, A.P. (Antonio Pallotti). All authors have read and agreed to the published version of the manuscript.
Funding
This research received no external funding.
Institutional Review Board Statement
The protocol was approved by the Consorzio Parco Scientifico e Tecnologico Pontino Technoscience, with the code PST/342/P/130422.
Informed Consent Statement
Informed consent was obtained from the subject involved in the study.
Data Availability Statement
The datasets underpinning this work are available from the corresponding author upon request (agreement signing).
Acknowledgments
We thank Joint Research Laboratory "Computational Graphology"(Consorzio Parco Scientifico e Tecnologico Pontino Technoscience and San Raffaele University of Rome)for the support and contribution in the research work.
Conflicts of Interest
The authors declare no conflict of interest.
References
- McKeith, I.G.; Burn, D. Spectrum of parkinson’s disease, parkinson’s dementia, and lewy body dementia. Neurol. Clin. 2000, 18, 865–883. [Google Scholar] [CrossRef]
- Gupta, J.D.; Chanda, B. Novel Features for Diagnosis of Parkinson’s Disease From off-Line Archimedean Spiral Images. In Proceedings of the IEEE 10th International Conference on Awareness Science and Technology (iCAST), Morioka, Japan, 23–25 October 2019. [Google Scholar] [CrossRef]
- Tolosa, E.; Wenning, G.; Poewe, W. The diagnosis of Parkinson’s disease. Lancet Neurol. 2006, 5, 75–86. [Google Scholar] [CrossRef]
- Pereira, C.R.; Pereira, D.R.; Weber SA, T.; Hook, C.; de Albuquerque, V.H.C.; Papa, J.P. A survey on computer-assisted Parkinson’s Disease diagnosis. Artif. Intell. Med. 2019, 95, 48–63. [Google Scholar] [CrossRef] [PubMed]
- Cordella, F.; Paffi, A.; Pallotti, A. Classification-based screening of Parkinson’s disease patients through voice signal. In Proceedings of the 2021 IEEE International Symposium on Medical Measurements and Applications (MeMeA), Lausanne, Switzerland, 23–25 June 2021; pp. 1–6. [Google Scholar] [CrossRef]
- Emamzadeh, F.N.; Surguchov, A. Parkinson’s Disease: Biomarkers, Treatment, and Risk Factors. Front. Neurosci. 2018, 12, 612. [Google Scholar] [CrossRef] [PubMed]
- Zham, P.; Arjunan, S.P.; Raghav, S.; Kumar, D.K. Efficacy of Guided Spiral Drawing in the Classification of Parkinson’s Disease. IEEE J. Biomed. Health Inform. 2018, 22, 1648–1652. [Google Scholar] [CrossRef] [PubMed]
- Mazza, M.; Marano, G.; Traversi, G.; Gaetani, E.; Sani, G.; Mazza, S. Graphology: An Interface Between Biology, Psychology and Neuroscience. Psychol. Disord. Res. 2021, 2020, 1–13. [Google Scholar] [CrossRef]
- Homas, M.; Lenka, A.; Pal, P.K. Handwriting Analysis in Parkinson’s Disease: Current Status and Future Directions. Mov. Disord. Clin. Pract. 2017, 4, 806–818. [Google Scholar] [CrossRef]
- Miralles, F.; Tarongí, S.; Espino, A. Quantification of the drawing of an Archimedes spiral through the analysis of its digitized picture. J. Neurosci. Methods 2006, 152, 18–31. [Google Scholar] [CrossRef] [PubMed]
- Drotar, P.; Mekyska, J.; Rektorová, I.; Masarová, L.; Smekal, Z.; Faundez-Zanuy, M. Evaluation of handwriting kinematics and pressure for differential diagnosis of Parkinson’s disease. Artif. Intell. Med. 2016, 67, 39–46. [Google Scholar] [CrossRef] [PubMed]
- Pereira, C.R.; Pereira, D.R.; Silva, F.A.; Masieiro, J.P.; Weber, S.A.T.; Hook, C.; Papa, J.P. A new computer vision-based approach to aid the diagnosis of Parkinson’s disease. Comput. Methods Programs Biomed. 2016, 136, 79–88. [Google Scholar] [CrossRef] [PubMed]
- Pereira, C.R.; Weber SA, T.; Hook, C.; Rosa, G.H.; Papa, J. Deep Learning-aided Parkinson’s Disease Diagnosis from Handwritten Dynamics. In Proceedings of the 2016 29th SIBGRAPI Conference on Graphics, Patterns and Images (SIBGRAPI), Sao Paulo, Brazil, 4–7 October 2016. [Google Scholar] [CrossRef]
- Sadikov, A.; Zabkar, J.; Mozina, M.; Groznik, V.; Georgiev, D.; Bratko, I. ParkinsonCheck A Decision Support System for Tremor Detection. 2015. Available online: https://ailab.si/parkinsoncheck/pc-tr.pdf (accessed on 24 November 2021).
- Lamba, R.; Gulati, T.; Al-Dhlan, K.A.; Jain, A. A systematic approach to diagnose Parkinson’s disease through kinematic features extracted from handwritten drawings. J. Reliab. Intell. Environ. 2021, 7, 253–262. [Google Scholar] [CrossRef]
- Eichhorn, T.E.; Gasser, T.; Marquardt, T.; Arnold, G.; Schwarz, J.; Oertel, W.H. Computational Analysis of Open Loop Handwriting Movements in Parkinson’s Disease: A Rapid Method to Detect Dopamime tic Effects. Mov. Disordcr Soc. 1996, 11, 3. [Google Scholar] [CrossRef]
- Taleb, C.; Likforman-Sulem, L.; Khachab, M.; Mokbel, C. Feature selection for an improved Parkinson’s disease identification based on handwriting. In Proceedings of the 2017 1st International Work- shop on Arabic Script Analysis and Recognition (ASAR 2017), Nancy, France, 3–5 April 2017; pp. 52–56. [Google Scholar] [CrossRef] [Green Version]
- Senatore, R.; Marcelli, A. A paradigm for emulating the early learning stage of handwriting: Performance comparison between healthy controls and Parkinson’s disease patients in drawing loop shapes. Hum. Mov. Sci. 2019, 65, 89–101. [Google Scholar] [CrossRef]
- Tappert, C.C.; Suen, C.Y.; Wakahara, T. The state of the art in online handwriting recognition. IEEE Trans. Pattern Anal. Mach. Intell. 1990, 12, 787–808. [Google Scholar] [CrossRef] [Green Version]
- Drotar, P.; Mekyska, J.; Rektorová, I.; Masarová, L.; Smékal, Z.; Faundez-Zanuy, M. Analysis of in-air movement in handwriting: A novel marker for Parkinson’s disease. Comput. Methods Programs Biomed. 2014, 117, 405–411. [Google Scholar] [CrossRef]
- UNESCO Institute for Statistics. International Standard Classification of Education: ISCED 2011; UIS: Montreal, QC, Canada, 2021. [Google Scholar] [CrossRef]
- International Standard Classification of Education (ISCED)—Statistics Explained (europa.eu). 2021. Available online: https://ec.europa.eu/eurostat/statistics-explained/index.php?title=International_Standard_Classification_of_Education_(ISCED) (accessed on 25 November 2021).
- Bhidayasiri, R.; Tarsy, D. Parkinson’s Disease: Hoehn and Yahr Scale. In Movement Disorders: A Video Atlas; Current Clinical Neurology; Humana: Totowa, NJ, USA, 2012. [Google Scholar] [CrossRef]

Publisher’s Note: MDPI stays neutral with regard to jurisdictional claims in published maps and institutional affiliations. |
© 2021 by the authors. Licensee MDPI, Basel, Switzerland. This article is an open access article distributed under the terms and conditions of the Creative Commons Attribution (CC BY) license (https://creativecommons.org/licenses/by/4.0/).