Abstract
Ochratoxins are a group of mycotoxins produced as secondary metabolites by several fungi of Aspergillus and Penicillium species. Ochratoxin A (OTA) is the most toxic member of the group and can be found in a large variety of widely consumed foods, such as coffee, cocoa, wine, and flour. Reliable determination of OTA levels in food samples is therefore indispensable to ensure compliance with MRLs set by national/European regulations and minimize health risks for consumers. In the current study, a label-free biosensor based on white light reflectance spectroscopy (WLRS) for the rapid and accurate determination of OTA in cereal flour samples is demonstrated. A Si chip with a 1-μm-thick thermal SiO2 on top plays the role of transducer after the immobilization of an OTA–protein conjugate on its surface. For the assay, a mixture of an in-house-developed anti-OTA antibody with the calibrators or the samples is injected over the chip surface, followed by reaction with a secondary biotinylated antibody and streptavidin for signal amplification. The label-free, real-time monitoring of immunoreactions occurring on the SiO2/Si chip surface is achieved by recording the shift in the reflected interference spectrum caused by the immunoreactions. This shift is converted through appropriate mathematical processing to an effective biomolecular adlayer thickness. After optimization, the sensor is capable of detecting OTA in wheat flour samples at concentrations as low as 60 pg/mL within 25 min. The assay is repeatable, with intra- and inter-assay CVs ≤5.9% and ≤9.0%, respectively. The assay’s excellent analytical characteristics and short analysis time, in combination with the small size of the device, render the proposed WLRS system ideal for the quantitative determination of minute OTA levels at the point-of-need.
1. Introduction
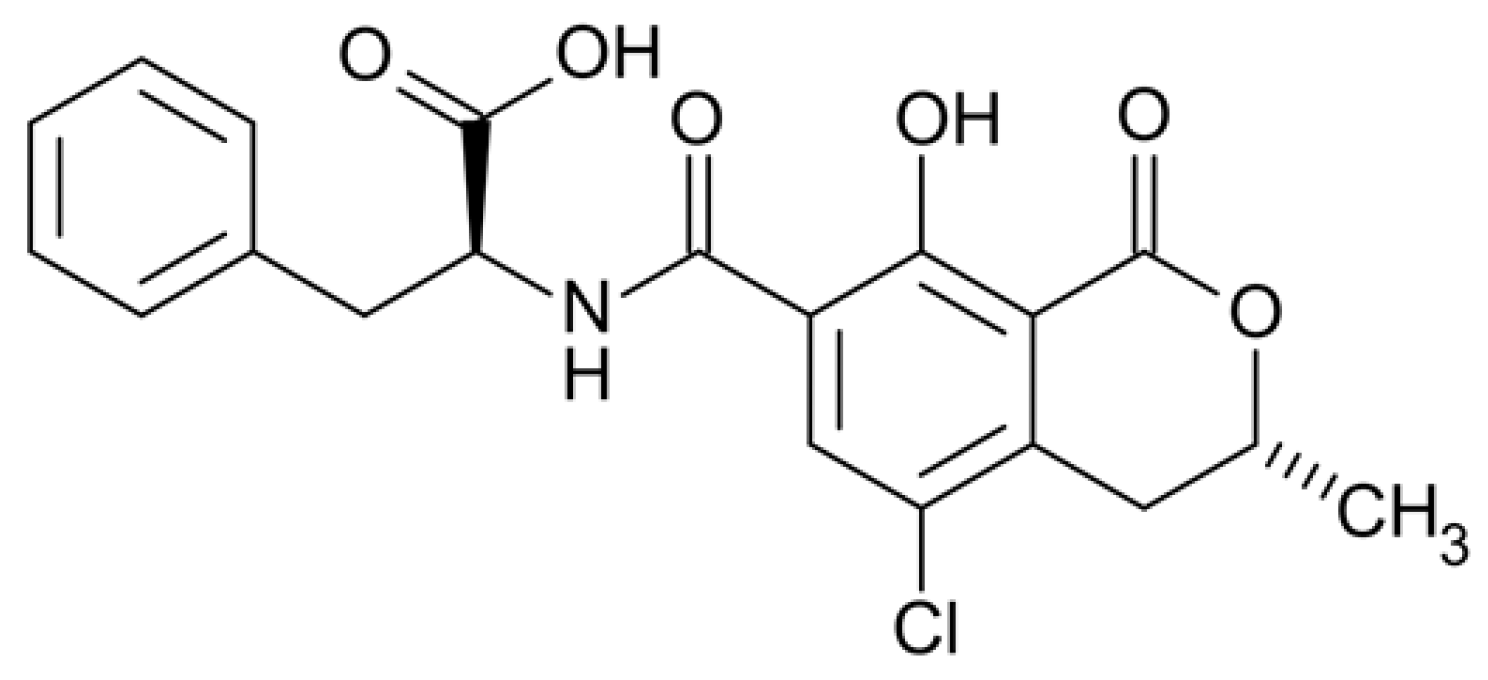
Ochratoxin A (OTA) is a low-molecular-weight mycotoxin (403.81 Da; Scheme 1) produced as a secondary metabolite mainly by filamentous fungi of the genera Aspergillus and Penicillium [1]. Due to the colonization of these species in a plethora of food crops during cultivation, harvest and post-harvest procedures, OTA has been reported to be present in a series of highly consumed agricultural products, such as cereals, coffee, cocoa, beer and wine [2]. OTA is considered harmful for humans and animals, since there is evidence associating its consumption with chronic toxicity (genotoxicity, immunotoxicity, nephrotoxicity, hepatotoxicity, etc.), teratogenicity, mutagenicity and carcinogenicity. In accordance with this, the International Agency for Research on Cancer has classified OTA as group 2B—a possible carcinogen to humans [3]. In order to control and minimize the public health risk, the European Union (EU) has established a strict maximum limit of 2 ng/mL for OTA in cereals and cereal flours, which was adopted by several non-EU countries as well [4].
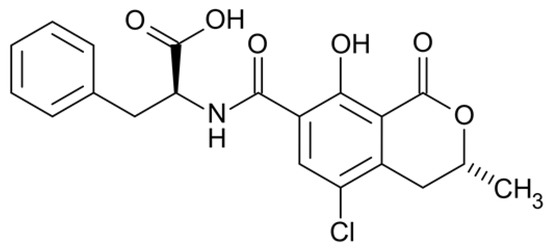
Scheme 1.
Chemical structure of Ochratoxin A.
Nowadays, the analysis of OTA in foodstuffs, including flour, is performed by well-established analytical techniques, mainly high-performance liquid chromatography (HPLC) coupled to fluorescence or mass spectrometry detection [5,6]. These sophisticated techniques are characterized by high reliability, selectivity and sensitivity. However, the high analysis cost, the need for skilled personnel and the bulky instruments are major bottlenecks for the application of these techniques to the routine high-throughput screening and/or point-of-need (PoN) analysis of OTA. In this direction, in the last decade(s), biosensors have raised great expectations as an emerging technology with potential for automation, miniaturization and incorporation into portable setups for the rapid and reliable determination of OTA levels in flours across the production line and up to the retail shelf [7].
In the current work, we present the development of a sensitive and reliable method for the rapid immunochemical detection of OTA in cereal flours based on a white light reflectance spectroscopy (WLRS) optical sensor. The WLRS methodology involves a visible/near-infrared light source, a miniaturized USB controlled spectrometer operating in the 400–750 nm spectral range and a reflection probe of seven optical fibers, of which six are arranged at the periphery of the probe and one at its center. The white light emitted from the light source is guided through the six fibers at the periphery of the reflection probe to the bio-modified surface, and at the same time, the central seventh fiber collects the reflected light and directs it to the spectrometer. The immunochemical reactions take place on top of a 1-μm-thick SiO2 layer grown by thermal oxidation of silicon chips. Thus, the light reflected from the silicon surface passes through the SiO2 and the biomolecular layer and an interference spectrum is received that shifts to higher wavelengths during the course of immunoreactions. The software calculates the effective thickness of the biomolecular layer that caused the spectral shift, and this thickness in nm is the sensor signal. For the determination of OTA, an indirect competitive immunoassay format realized in three steps was implemented. At first, mixtures of an in-house-developed rabbit anti-OTA antibody with OTA calibrators or samples were passed over an amino-silanized chip biofunctionalized with an OTA–protein conjugate; then, a biotinylated secondary anti-rabbit IgG antibody and streptavidin were applied to enhance the signal received by the primary immunoreaction. All assay parameters were optimized in terms of absolute signal, detection sensitivity and total analysis time, aiming at a fast method for the sensitive and reliable determination of OTA in cereal flours.
2. Materials and Methods
2.1. Reagents and Instrumentation
Ochratoxin A (OTA) and the OTA conjugate with ovalbumin (OTA-OVA) were purchased from Aokin AG (Berlin, Germany). Rabbit anti-OTA antibody (primary antibody) was in-house-developed. Biotinylated goat anti-rabbit IgG antibody (secondary antibody), streptavidin and (3-aminopropyl) triethoxysilane (APTES) were obtained from Sigma-Aldrich (Darmstadt, Germany). Bovine serum albumin (BSA) was from Acros Organics (Geel, Belgium). IgG elution buffer was from Thermo Fisher Scientific Inc. (Waltham, MA, USA). All other chemicals were from Merck KGaA (Darmstadt, Germany). The RIDASCREEN® Ochratoxin A 30/15 enzyme immunoassay kit was purchased from R-Biopharm AG (Darmstadt, Germany). Flour samples were provided by Yiotis SA industry.
OTA calibrators with concentrations ranging from 0.05 to 200 ng/mL were prepared from a 2 mg/mL OTA stock solution in absolute ethanol after proper dilution in a 1:9 mixture of ethanol with 10 mM phosphate buffer, pH 7.4, 0.9 % (w/v) NaCl, 0.02 % (w/v) KCl, 0.2% (w/v) BSA (assay buffer).
Four-inch Si wafers were purchased from Si-Mat Germany (Kaufering, Germany). The visible/near-infrared light source of the sensor was a product of ThetaMetrisis SA (Athens, Greece); the miniaturized USB-controlled spectrometer and the reflection probe were obtained from Ocean Insight (Duiven, The Netherlands).
2.2. Chip Biofunctionalization and Assay Protocol
For chip biofunctionalization, an OTA conjugate with OVA was deposited on APTES-modified chips [8] and incubated overnight at RT. The next day, after proper washing with phosphate buffer (washing buffer), the chips were blocked in 2% (w/v) BSA solution in washing buffer for 3 h, washed once more with washing buffer and distilled water, dried under nitrogen flow and used for the assay.
The fluidic module was applied to each biofunctionalized chip, and assay buffer was run to acquire a stable baseline. The assay was performed by flowing 1:1 volume mixtures of calibrators (0.05–200 ng/mL in assay buffer) or flour extracts 2-times diluted with assay buffer, with the rabbit anti-OTA antibody (1 μg/mL in assay buffer) for 15 min (primary immunoreaction). Next, a biotinylated anti-rabbit IgG solution (secondary immunoreaction, 7 min) and a streptavidin solution (3 min) were introduced. Lastly, IgG elution buffer was run over the chip to remove all molecules bound to the OTA–OVA conjugate, followed by assay buffer for surface re-equilibration. The reagent’s flow rate throughout the experiment was 50 μL/min. To prepare the calibration curve, the effective thickness of the biomolecular layer (signal) determined for the calibrators (Sx) was expressed as a percentage of the zero-calibrator signal-maximum signal (S0) and plotted against the analyte concentration in the calibrators.
3. Results and Discussion
3.1. WLRS Assay Optimization
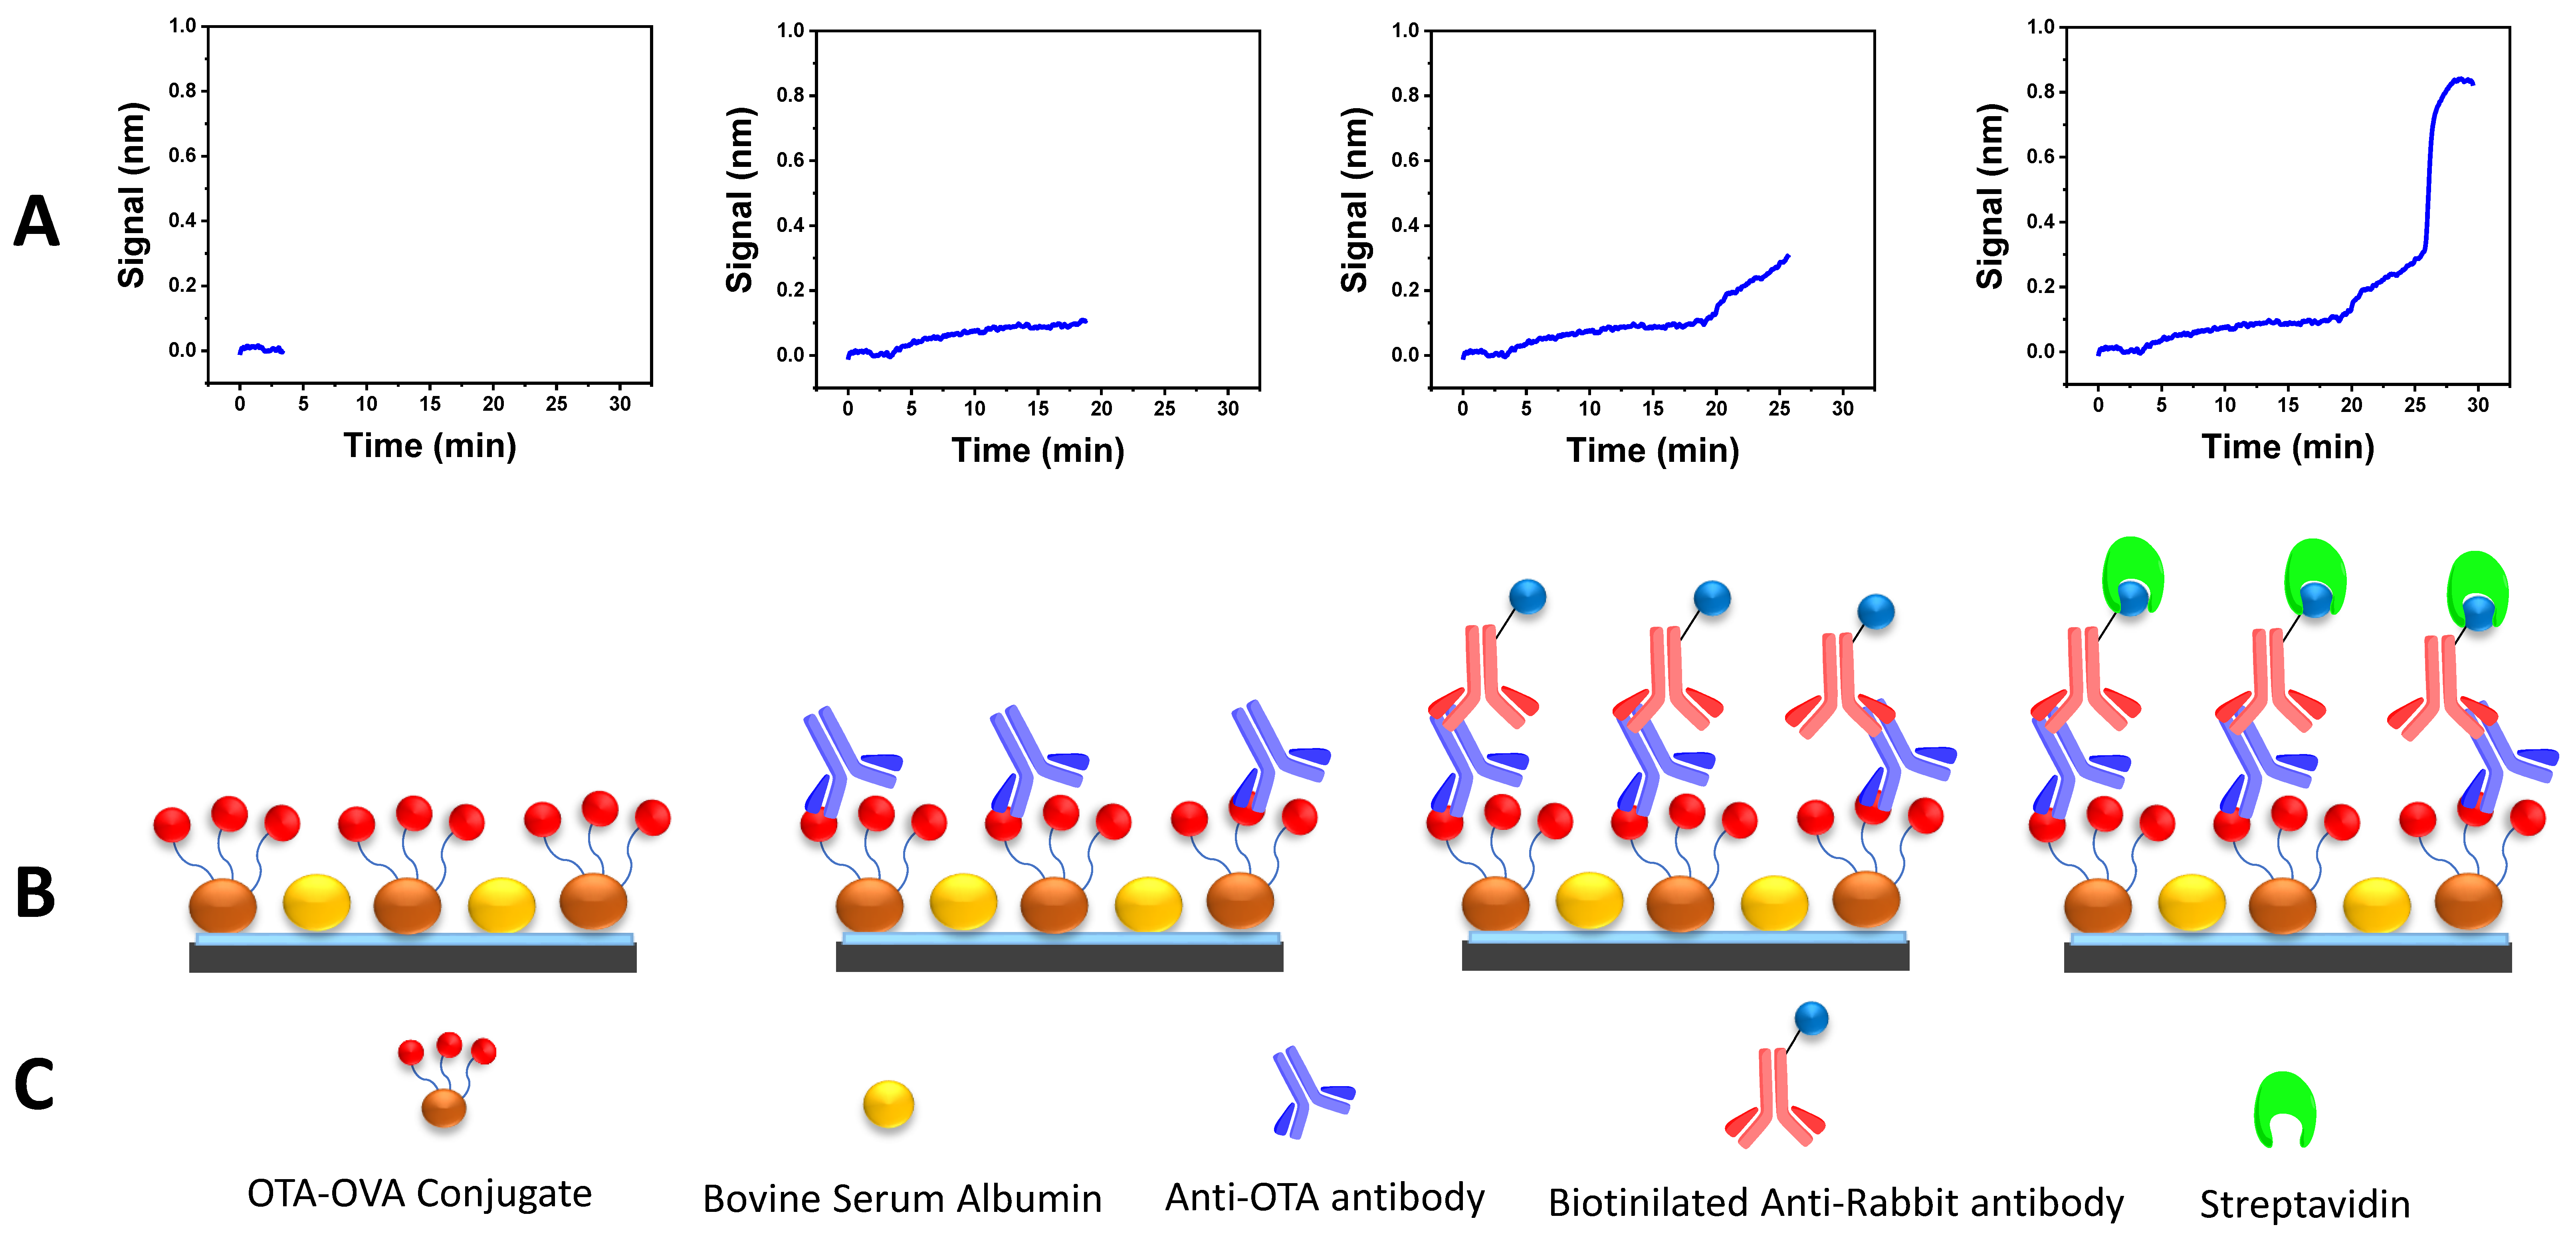
Many assay parameters had to be optimized to establish the sensitive and rapid determination of OTA with the WLRS sensor. Due to the competitive nature of the immunoassay, at first, titration experiments were carried out employing different concentrations of OTA conjugate (50–500 μg/mL) combined with different concentrations of the anti-OTA antibody (0.5–4 μg/mL). The combination that provided a satisfactory analytical signal and assay sensitivity was 200 μg/mL for the OTA conjugate and 1 μg/mL for the anti-OTA antibody. Another parameter to optimize was the duration of the different assay steps with the condition that the total analysis time should be as short as possible. The assay duration was 25 min; it was 15 min for the primary immunoreaction, 7 min for the secondary one and 3 min for the biotinylated secondary antibody and streptavidin reaction step (Figure 1).

Figure 1.
(A) Real-time sensor response at each OTA WLRS immunoassay step; (B) schematic representation of the main immunoassay steps; (C) main immunoassay reagents.
3.2. WLRS Assay Characteristics
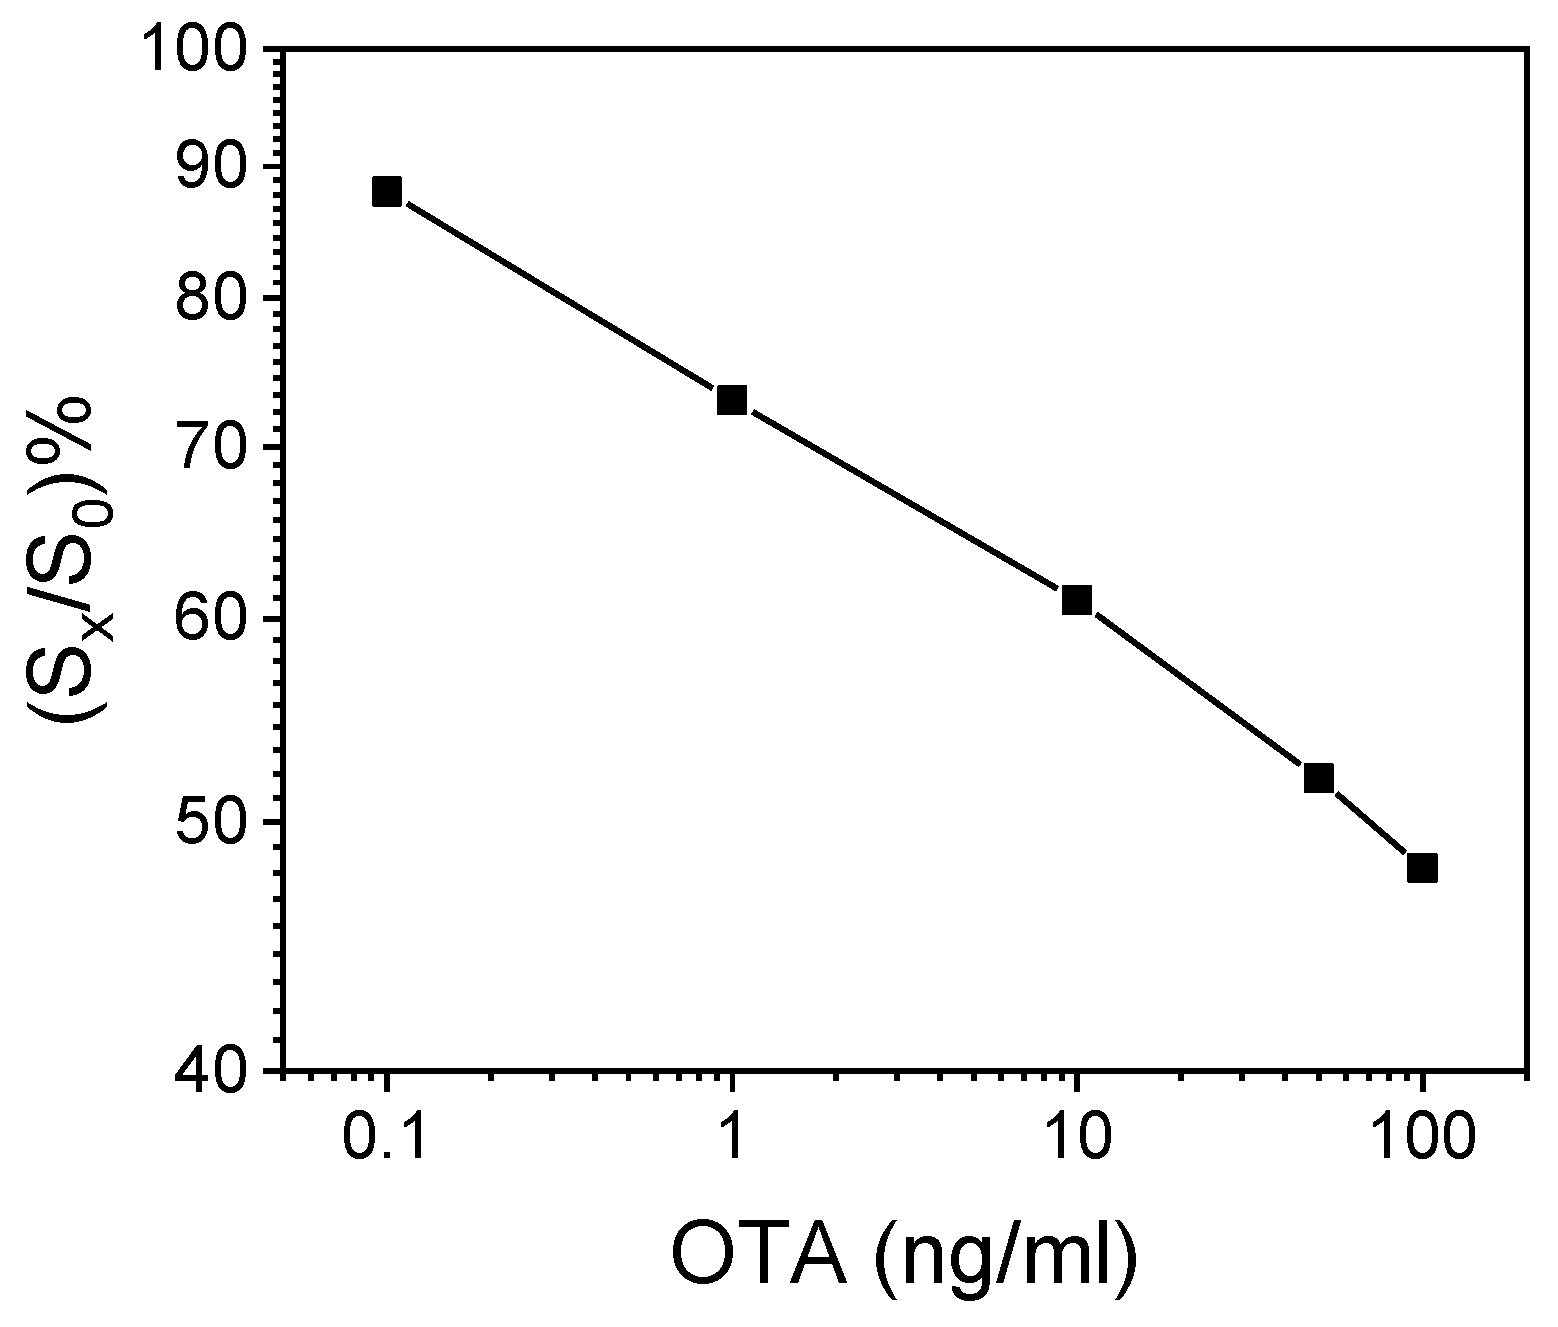
A representative OTA calibration curve obtained with the WLRS immunosensor and calibrators prepared in assay buffer following the final assay protocol is depicted in Figure 2. It should be noted that an identical calibration curve was obtained when the extract from a wheat flour that did not contain detectable concentrations of OTA diluted 1:1 v/v with assay buffer was used as a matrix for the preparation of OTA calibrators.
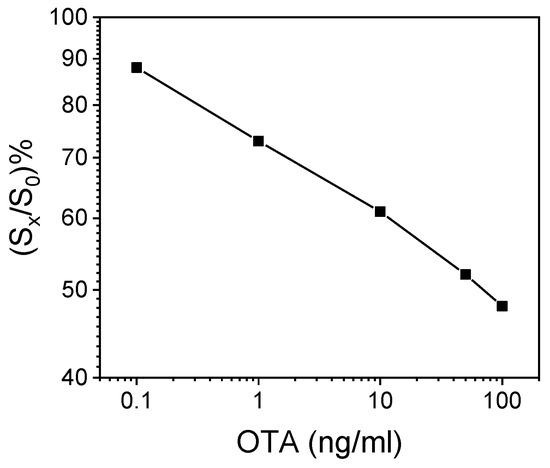
Figure 2.
Typical calibration curve obtained with OTA calibrators prepared in assay buffer. Each point represents the mean value of three independent runs ± SD. S0 = zero-calibrator signal; Sx = calibrator signal.
The proposed immunosensor was sensitive, with an assay limit of detection (LoD) of 30 pg/mL, which corresponded to the mean signal value −3SD of 15 replicates of the zero calibrator. The assay dynamic range extended up to 200 ng/mL. In addition, the assay was reproducible, with intra-assay co-efficient of variation (CV) values ≤5.9%, determined by running three control samples in triplicate within the same day, and inter-assay CVs ≤9.0%, determined by duplicate measurements of the three controls on seven different days.
The OTA assay developed has been applied to the determination of OTA levels in a small number of cereal flour samples. There was a very good correlation of the OTA concentrations determined in these samples with the WLRS assay with the OTA values determined in the same samples using a commercially available immunoassay kit. Evaluation with a larger number of cereal flour samples is underway.
4. Conclusions
In the current work, a WLRS-based biosensing platform was applied to the label-free and real-time immunochemical determination of OTA. The developed sensor enabled the fast (25 min) and sensitive quantification of OTA levels at concentrations as low as 30 pg/mL. The combination of a series of assets, i.e., the high analytical sensitivity, the short analysis time and the small instrument size, resulted in a bioanalytical platform ideal for the quantitative determination of minute OTA levels at the point-of-need.
Author Contributions
Conceptualization, C.-E.K. and G.K.; methodology, I.R., E.L., S.K. and P.P.; software, D.G.; validation, C.-E.K. and G.K.; formal analysis, C.-E.K. and G.K.; investigation, C.-E.K. and G.K.; resources, K.P. and D.L.; data curation, I.R., E.L., S.K. and P.P.; writing—original draft preparation, C.-E.K. and G.K.; writing—review and editing, I.R., E.L., S.K. and P.P.; visualization, I.R.; supervision, P.P. All authors have read and agreed to the published version of the manuscript.
Funding
The work was partially funded by the EU Horizon 2020 project “DIgital TEChnologies as an enabler for a conTinuous transformation of food safety system (DITECT)”, contract number 861915.
Institutional Review Board Statement
Not applicable.
Informed Consent Statement
Not applicable.
Data Availability Statement
The data presented in this study are available on request from the corresponding author. The data are not publicly available due to privacy issues.
Conflicts of Interest
The authors declare no conflict of interest.
References
- Weidenbörner, M. Encyclopedia of Food Mycotoxins, 1st ed.; Springer: Berlin/Heidelberg, Germany, 2001. [Google Scholar]
- Jørgensen, K. Occurrence of ochratoxin A in commodities and processed food—A review of EU occurrence data. Food Addit. Contam. 2005, 22 (Suppl. 1), 26–30. [Google Scholar] [CrossRef] [PubMed] [Green Version]
- Ostry, V.; Malir, F.; Toman, J.; Grosse, Y. Mycotoxins as human carcinogens-the IARC Monographs classification. Mycotoxin Res. 2017, 33, 65–73. [Google Scholar] [CrossRef] [PubMed]
- Commission Regulation (EC) No. 1881/2006 setting maximum levels for certain contaminants in foodstuffs. Off. J. Eur. Union 2006, L 364/5, 5–24.
- Skarkova, J.; Ostry, V.; Malir, F.; Roubal, T. Determination of Ochratoxin A in Food by High Performance Liquid Chromatography. Anal. Lett. 2013, 46, 1495–1504. [Google Scholar] [CrossRef]
- Li, P.; Zhang, Z.; Hu, X.; Zhang, Q. Advanced hyphenated chromatographic-mass spectrometry in mycotoxin determination: Current status and prospects. Mass Spectrom. Rev. 2013, 32, 420–452. [Google Scholar] [CrossRef] [PubMed]
- Srinivasan, B.; Tung, S. Development and Applications of Portable Biosensors. J. Lab. Autom. 2015, 20, 365–389. [Google Scholar] [CrossRef] [PubMed] [Green Version]
- Tsougeni, K.; Ellinas, K.; Koukouvinos, G.; Petrou, P.S.; Tserepi, A.; Kakabakos, S.E.; Gogolides, E. Three-dimensional (3D) plasma micro-nanotextured slides for high performance biomolecule microarrays: Comparison with epoxy-silane coated glass slides. Colloids Surf. B Biointerfaces 2018, 165, 270–277. [Google Scholar] [CrossRef] [PubMed]
Publisher’s Note: MDPI stays neutral with regard to jurisdictional claims in published maps and institutional affiliations. |
© 2022 by the authors. Licensee MDPI, Basel, Switzerland. This article is an open access article distributed under the terms and conditions of the Creative Commons Attribution (CC BY) license (https://creativecommons.org/licenses/by/4.0/).