Proceeding Paper

Multiplexed Quantification of Soil Nutrients Using an AI-Enhanced and Low-Cost Impedimetric Sensor †

by
Antonio Ruiz-Gonzalez
Plantion Ltd., Benfleet SS7 1LS, UK
Presented at the 5th International Electronic Conference on Biosensors, 26–28 May 2025; Available online: https://sciforum.net/event/IECB2025.
Eng. Proc. 2025, 106(1), 7; https://doi.org/10.3390/engproc2025106007
Published: 10 September 2025

Abstract

Soil nutrient monitoring is essential to achieving UN development goals and meeting the projected 70% increase in agricultural production from 2009 values by 2050. This study presents a novel, low-cost impedimetric device for the direct and simultaneous measurement of soil ion bioavailability (Na+, K+), temperature, and humidity. Designed for Arduino integration, the device offers scalable, cost-effective deployment. Different AI algorithms were trained to interpret signals (Support Vector Machine, Random Forest, XBoost), enabling real-time monitoring. Best performance was achieved for XBoost. Calibration was first performed using solutions of known NaCl and KCl concentrations to establish impedance patterns, and benchmarking against fitted Cole model outputs demonstrated high predictive accuracy (R2 = 0.99 for both Na+ and K+). The system operated across a 1–100 kHz impedance range with environmental resolution of ±0.5 °C, ±3% RH, and ±1 hPa, acquiring data every 10 min during in vivo trials. This affordable, AI-enhanced platform has the potential to empower smallholder farmers by reducing reliance on costly laboratory analyses, enabling precise fertiliser application, and integrating seamlessly into smart farming platforms for sustainable yield improvement.

1. Introduction

Global food systems face unprecedented challenges in the 21st century, driven by the dual pressures of a growing population and environmental degradation. To meet the food demands of an estimated 9.7 billion people by 2050, agricultural production must increase by approximately 70% compared to 2009 levels [1,2]. Achieving this target in a sustainable manner requires innovations in soil management practices, as soil health is a fundamental determinant of plant productivity, ecosystem resilience, and food security [3].
Among the key factors influencing soil health are the availability of essential nutrients such as potassium (K+) and sodium (Na+), which play crucial roles in plant metabolism, osmotic balance, and stress tolerance [4,5,6]. Thus, simultaneous measurement of Na+, K+, temperature, and humidity is essential to capture the full context of nutrient bioavailability. Impedance-based platforms can generate real-time, space-time maps of mineral content in situ, revealing dynamic environmental influence on ion behaviour [4,7]. Moreover, temperature and moisture are well-known controllers of soil mineralisation and microbial activity [8], which directly influence how ions like K+ are processed and available to plants.
Accurate determination of ions in situ remains a significant challenge. Conventional techniques such as laboratory-based spectrometric analyses are cost-intensive, laborious, and, in most cases, limited in their ability to reflect real-time fluctuations influenced by dynamic environmental conditions such as soil moisture and temperature. Ion-selective electrodes represent a promising alternative in this field, enabling the continuous quantification of electrolytes. While they allow for real-time monitoring due to the potentiometric nature of ISE signals, they are limited to the determination of a single ion concentration, leading to multiple sensors being required to achieve a complete profiling of soil nutrient availability [9].
Moreover, they exhibit signal drift within hours to days, requiring frequent calibrations to provide reliable measurements, and they need pre-conditioning steps that may last several hours to overnight before stable measurements can be made [10]. Spectrometric methods, on the other hand, offer high specificity and sensitivity. However, they are laboratory-bound, requiring transport to centralised labs, and destructive, leading to a lack of temporal resolution. Finally, Electrical Conductivity (EC) measurements are rapid and inexpensive but nonspecific, as changes reflect the combined ionic strength of all solutes rather than individual nutrient concentrations [11]. Moreover, signals are impacted by a plethora of different factors, including soil moisture, texture, and organic matter, which prevents accurate nutrient quantification without complex correction models [12]. These challenges highlight the need for a technology that combines the real-time performance of ISEs with the multiplexing ability and field deployability required for precision agriculture.
To address these challenges, indirect measurement and multi-modal approaches, such as hyperspectral imaging [13], have been proposed. While these methods offer lower operational costs and non-invasive deployment, they suffer from limited specificity and accuracy due to their sensitivity to confounding factors such as soil texture, organic matter content, and ionic background [14,15,16]. Despite current advances, no current low-cost sensing platform enables real-time, multiplexed quantification of soil ions directly in vivo or in situ. Existing solutions either provide single-ion data (ISEs), delayed laboratory results (spectrometry), or indirect proxies with poor specificity (EC, hyperspectral imaging). As such, there is an unmet need for tools that can simultaneously track multiple nutrient ions with high temporal resolution and field deployability.
A potential approach to allow a multiplexed monitoring of ions in xylem is the measurement of impedance data. However, interpreting complex impedance signals in dynamic soil or plant systems remains challenging. AI, particularly machine learning, offers a powerful alternative, enabling the extraction of nonlinear patterns from heterogeneous, high-dimensional data. For example, in IoT systems, sensor fusion of soil moisture, humidity, temperature, and nutrient levels has been used to generate real-time crop recommendations via ML models [17]. Moreover, a hybrid sensor array (ISEs and EC) processed by ANN achieved high accuracy for multiple ion concentrations in greenhouse hydroponics [18]. More recently, systems that transmit real-time NPK, environmental data, and GPS inputs to train cloud-based ML frameworks have demonstrated the practical value of AI in field-scale crop health monitoring [19].
This manuscript reports an impedimetric sensor system for the real-time, simultaneous monitoring of key soil ions, including K+ and Na+. The device was combined with environmental sensors to determine temperature, humidity, and VOCs concentrations, and could be integrated seamlessly with an Arduino-based platform, enabling low-cost manufacturing and scalable deployment. For validation, the sensor was implanted in vivo in tomato plants, and its signal outputs were processed via an artificial intelligence (AI) algorithm trained to accurately estimate ion concentrations with high accuracy. The novel combination of impedance spectroscopy with machine learning models enables an accurate ion quantification from complex biological signals. We hypothesise that impedance signatures, when analysed with AI, can reliably capture ion dynamics in plant tissues and soils, providing a scalable, low-cost alternative to conventional sensing methods.

2. Materials and Methods

2.1. Materials

Sodium chloride (NaCl) and potassium chloride (KCl) were purchased from Vital Minerals (Lancashire, UK). Wio Terminal and BME680 were purchased from Cool Components(Stockbridge, United Kingdom).

2.2. Plant Growth Conditions

In this proof of concept work, three tomato plants (cv. Moneymaker) were grown in pots with a 2:1 compost-to-peat mix for two weeks under standard growth conditions (maximum and minimum temperatures 27 °C/18 °C day/night). After that, plants were watered daily with either NaCl or KCl solutions at 0, 1, 10, 50, 100, and 150 mM for 48 h, followed by 24 h of resting (watering with distilled water) between each concentration. Impedance was monitored continuously. However, data were used after 72 h of implantation to avoid interferences due to the plant healing process. Moreover, for training, only impedance data of plants after 24 h of exposure to each electrolyte were used. Measurements were collected in a single experimental campaign across the three biological replicates, with continuous acquisition every 10 min over all concentration steps.

2.3. Device Design

The impedance spectroscopy module was implemented using the AD5933 (Analog Devices, Wilmington, NC, USA), configured according to the recommended circuitry. The AD5933 is a fully integrated impedance converter that combines a Direct Digital Synthesiser (DDS), a 12-bit Analogue-to-Digital Converter (ADC), a Programmable Gain Amplifier (PGA), and a Digital Signal Processing (DSP) core on a single chip. The DDS generates a programmable sinusoidal excitation signal (up to 100 kHz), which is applied to the sample under test. Excitation amplitude was set to ~2.0 Vpp (0.70 V RMS) sinusoidal waveform, swept from 1 to 100 kHz in 100 steps. These levels are consistent with prior plant impedance studies [20]. The return signal is digitised by the ADC, amplified by the PGA, and then processed by the DSP using a 1024-point Discrete Fourier Transform (DFT) to obtain the real and imaginary components of the impedance spectrum. These results are stored in internal registers and retrieved via an Inter-Integrated Circuit (I2C) interface. The AD5933 was configured following the manufacturer’s recommendations and prior work [21]. A Wio Terminal microcontroller from Seeed Studio (Shenzhen, China, ARM Cortex-M4F at 120 MHz, 4 MB flash, 192 kB RAM) was used as the main acquisition unit, connected via I2C. Light intensity was measured using the integrated light sensor. Environmental conditions were measured using a Bosch (Gerlingen-Schillerhöhe, Germany) BME680 sensor (resolution: ±0.5 °C for temperature, ±3% RH for humidity, ±1 hPa for pressure, VOC index range 0–500). This device allowed the characterisation of the plant microenvironment, which is key to determining growth conditions (Figure 1a). Both bioimpedance and environmental measurements were acquired every 10 min. To minimise potential electrical coupling via shared power trails, environmental reads were serialised to occur after each impedance sweep, avoiding overlap with the AD5933 DFT window.
Impedance spectra were fitted to a modified Cole model consisting of three resistive elements in series with a constant phase element, representing extracellular medium, cell membrane, and intracellular compartments, following previous modelling approaches in plant tissue [22]. This Cole model was chosen since it provided a simple and physiologically meaningful representation of biological impedance results. The model assumes that tissue can be represented as resistive and capacitive elements reflecting the extracellular fluid, cell membranes, and intracellular compartments. This is consistent with the structure of plant stems, where ionic conduction occurs through xylem and phloem vessels (resistive pathways), while cell membranes contribute capacitive charging effects.
Importantly, the ionic composition of the xylem sap directly influences the impedance characteristics of vascular tissues. Elevated sodium or potassium levels alter osmotic potential, ion channel activity, and the electrochemical environment within xylem vessels, thereby changing both resistive and capacitive components of the circuit. For example, high sodium can disrupt membrane integrity and increase leakage currents, while potassium uptake and transport are tightly coupled to membrane capacitance and ion channel regulation [4,23]. These physiological changes are effectively captured by the modified Cole model, where extracellular resistance reflects ionic concentration in the sap, intracellular resistance reflects cytoplasmic conductivity, and the constant phase element captures distributed membrane polarisation effects. Previous studies have also demonstrated that Cole-type models yield robust and reproducible descriptions of impedance spectra in fruits, leaves, and vascular tissues [21,22]. The model allows linking electrical measurements to physiological processes such as ion transport, water content, and membrane integrity.
Initial guesses were set as Rₑ = 1−10 kΩ, and Rᵢ = 0.1−5 kΩ. Nonlinear least-squares fitting was performed using the impedance.py library in Python v3.10, with Levenberg–Marquardt minimisation. Fits were accepted when convergence was achieved within 200 iterations and χ2 < 0.05. Model quality was evaluated by comparing measured and fitted Nyquist plots and reporting R2 and RMSE of residuals.
In this work, R2 corresponds to the intracellular resistance parameter of the Cole model, which reflects ionic conductivity within the cytoplasm and vascular compartments. This parameter provides a physiologically meaningful index of ion transport activity and cytoplasmic ionic status.

2.4. Implantation Procedure and Probe Design

A custom-made probe was developed to determine the optimal implantation location and depth within the tomato stem. Ionic composition, including K+ distribution, is known to differ across plant organs, such as the stem and leaves [24], making probe positioning critical. The probe was used to detect depth-dependent impedance profiles across stem tissues (cuticle, phloem, xylem, and pith), by inserting it at 10 μm intervals using a micrometre screw gauge. To investigate depth-dependent impedance signatures, electrodes were inserted into the tomato stem incrementally using a micrometre screw gauge, with a step resolution of 10 µm. This allowed mapping of impedance changes across anatomical layers, including cuticle, phloem, and xylem tissues. Superficial tissues were also studied by measuring the surface impedance of plants across the stem in 1 cm increments. This allowed the generation of a heatmap to locate the optimal location for probe implantation. Tissue resistance profiles were numerically differentiated using a central difference to obtain d R / d x at each depth (1 cm spacing). Tissue transitions were operationally defined at local maxima of d R / d x that exceeded the baseline mean plus one standard deviation. Transition sharpness was quantified as the full width at half maximum (FWHM) of each derivative peak, calculated by linear interpolation of the half-height crossing points.
For routine monitoring, electrodes were inserted to a depth of 2–3 mm within the xylem region, based on pilot mapping. Each impedance spectrum was acquired every 10 min continuously during the entire experimental timeline, aligned with environmental measurements. This implantation design ensured reproducibility across plants and provided minimally invasive yet physiologically relevant electrical access to vascular tissues.

2.5. Data Acquisition and AI Modelling

Raw impedance features (flattened frequency sweeps) were concatenated with environmental parameters (temperature, humidity, pressure, and VOC) prior to model training. All performance metrics were reported relative to each plant’s unstressed baseline (0 mM), which served as the within-plant control. Data were split into training (70%), validation (15%), and independent test sets (15%). All features were normalised to zero mean and unit variance. Models were implemented using Scikit-learn (v1.3). Algorithms tested included Random Forest Regressor, Support Vector Regressor, and XGBoost. Hyperparameter tuning was performed via randomised search (100 iterations) for SVM, XGBoost, and Random Forest. Final evaluation metrics (R2, MAE, and RMSE) were reported on the held-out test set. To account for sampling variability, each experiment was repeated with fivefold cross-validation.
Model interpretability was assessed using SHapley Additive exPlanations (SHAP). For each trained model, feature contributions were estimated using the TreeExplainer implementation in Python. A random subsample of the training set was used as the background dataset to compute SHAP values. To ensure robustness, SHAP analyses were repeated across all folds of a fivefold cross-validation procedure. In each fold, features were ranked by their mean absolute SHAP value, and the consistency of these rankings across folds was quantified using Kendall’s rank correlation coefficient (τ). This provided a quantitative measure of the stability of feature importance, complementing the qualitative interpretation of SHAP summary plots.

3. Discussions

3.1. Impedance-Guided Localisation of Xylem Sap

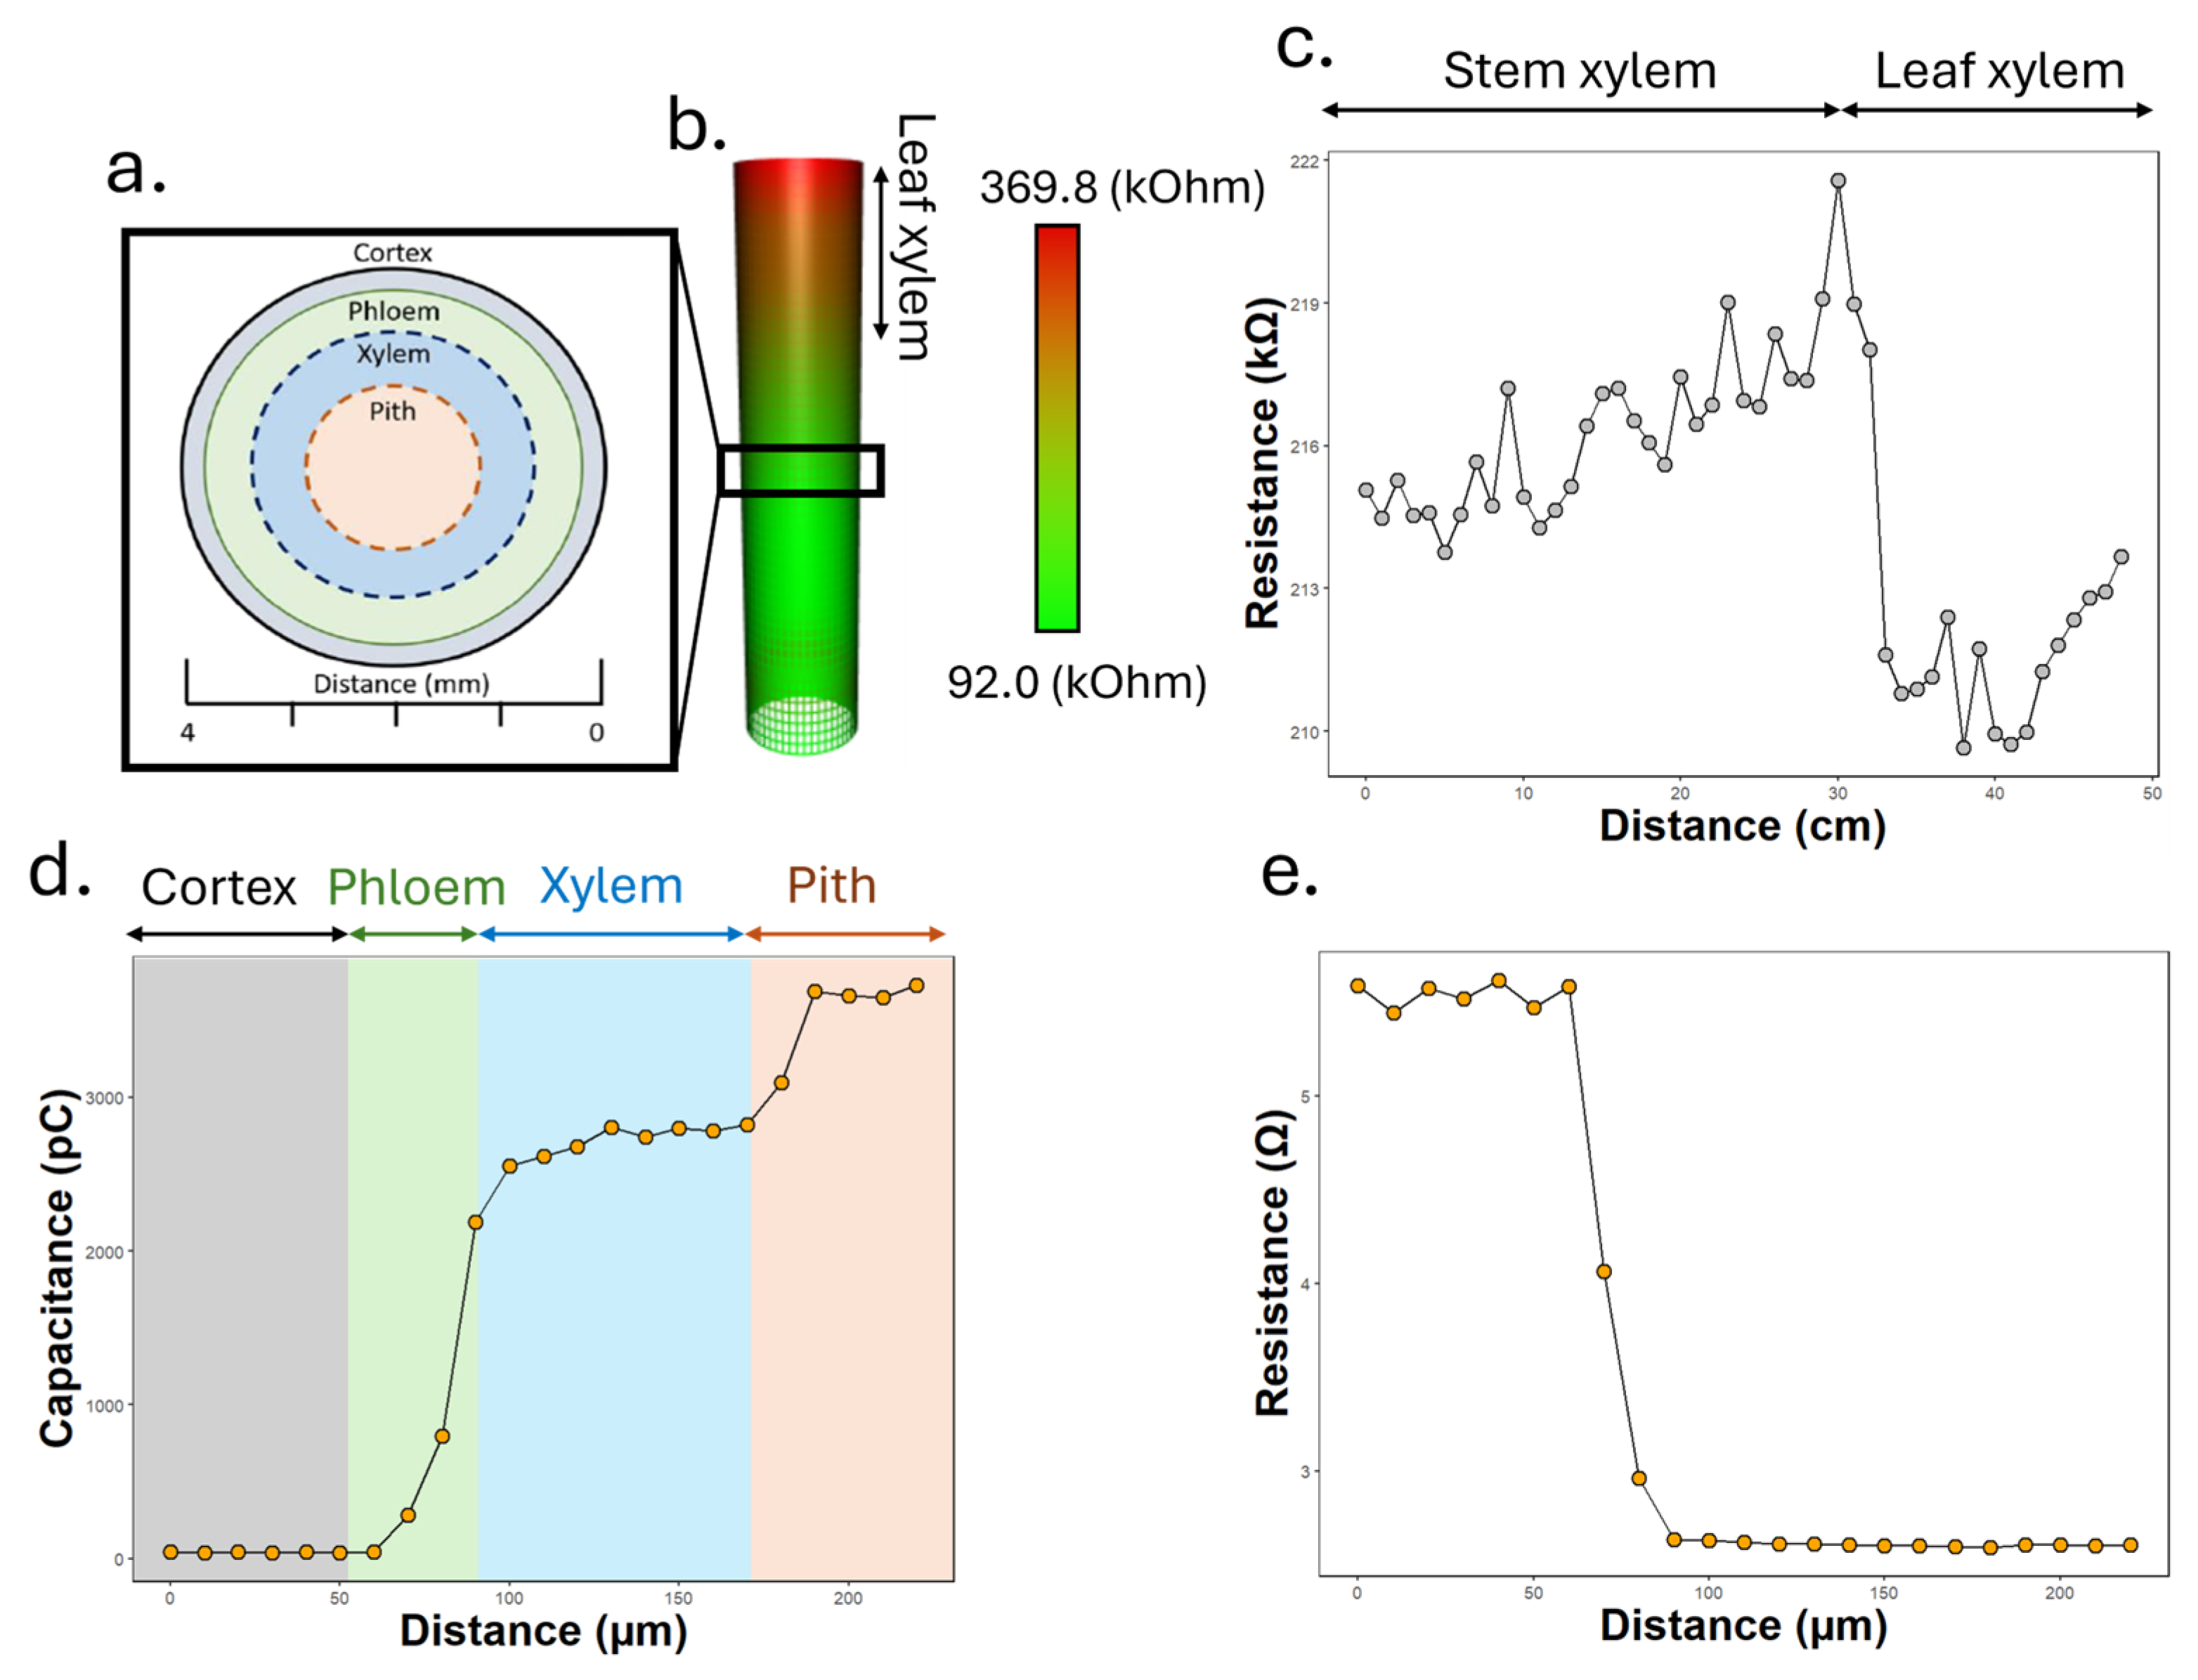
Precise localisation of the measurement site within plant tissue is essential for obtaining reproducible and physiologically relevant impedance data. In this study, we developed a fine-resolution impedance probe capable of detecting external and internal stem structures by sequential insertion at micrometre-scale depths. This allowed us to identify distinct changes in impedance signatures corresponding to key anatomical layers of the tomato stem at relevant sites: the cuticle, phloem, and xylem (Figure 2a).
Initially, the optimal height for consistent implantation was determined non-invasively by measuring the surface impedance of plants across the stem in 1 cm increments (Figure 2b,c). The derivative analysis identifies a impedance transitions at ~29 cm and ~32 cm, corresponding to the change from stem to leaf tissues.
Capacitive impedance was found to be especially sensitive when determining plant tissues across the plant stem cross-section (Figure 2c). Capacitance measurements showed marked transitions at approximately 70 μm and 100 μm, consistent with the entry into phloem and xylem tissues, respectively. These transitions likely reflect changes in membrane integrity, ion transport pathways, and extracellular matrix composition [25,26]. Resistance measurements, while also responsive, exhibited smaller dynamic ranges (Figure 2d). These results highlight the superior tissue discriminative power of capacitive signals. These measurements were used in further experiments to avoid implantation within pith tissues.
This probing strategy reduces the variability introduced by uncontrolled or inconsistent electrode placement. Differences in xylem sap composition across the stem and leaf axes are well documented [24]. By identifying the most stable and conductive zones for sensor implantation, the probe enhances the repeatability of measurements and provides a minimally invasive method for mapping physiological changes across tissue depth.

3.2. Electrolyte Monitoring via Impedance Spectroscopy

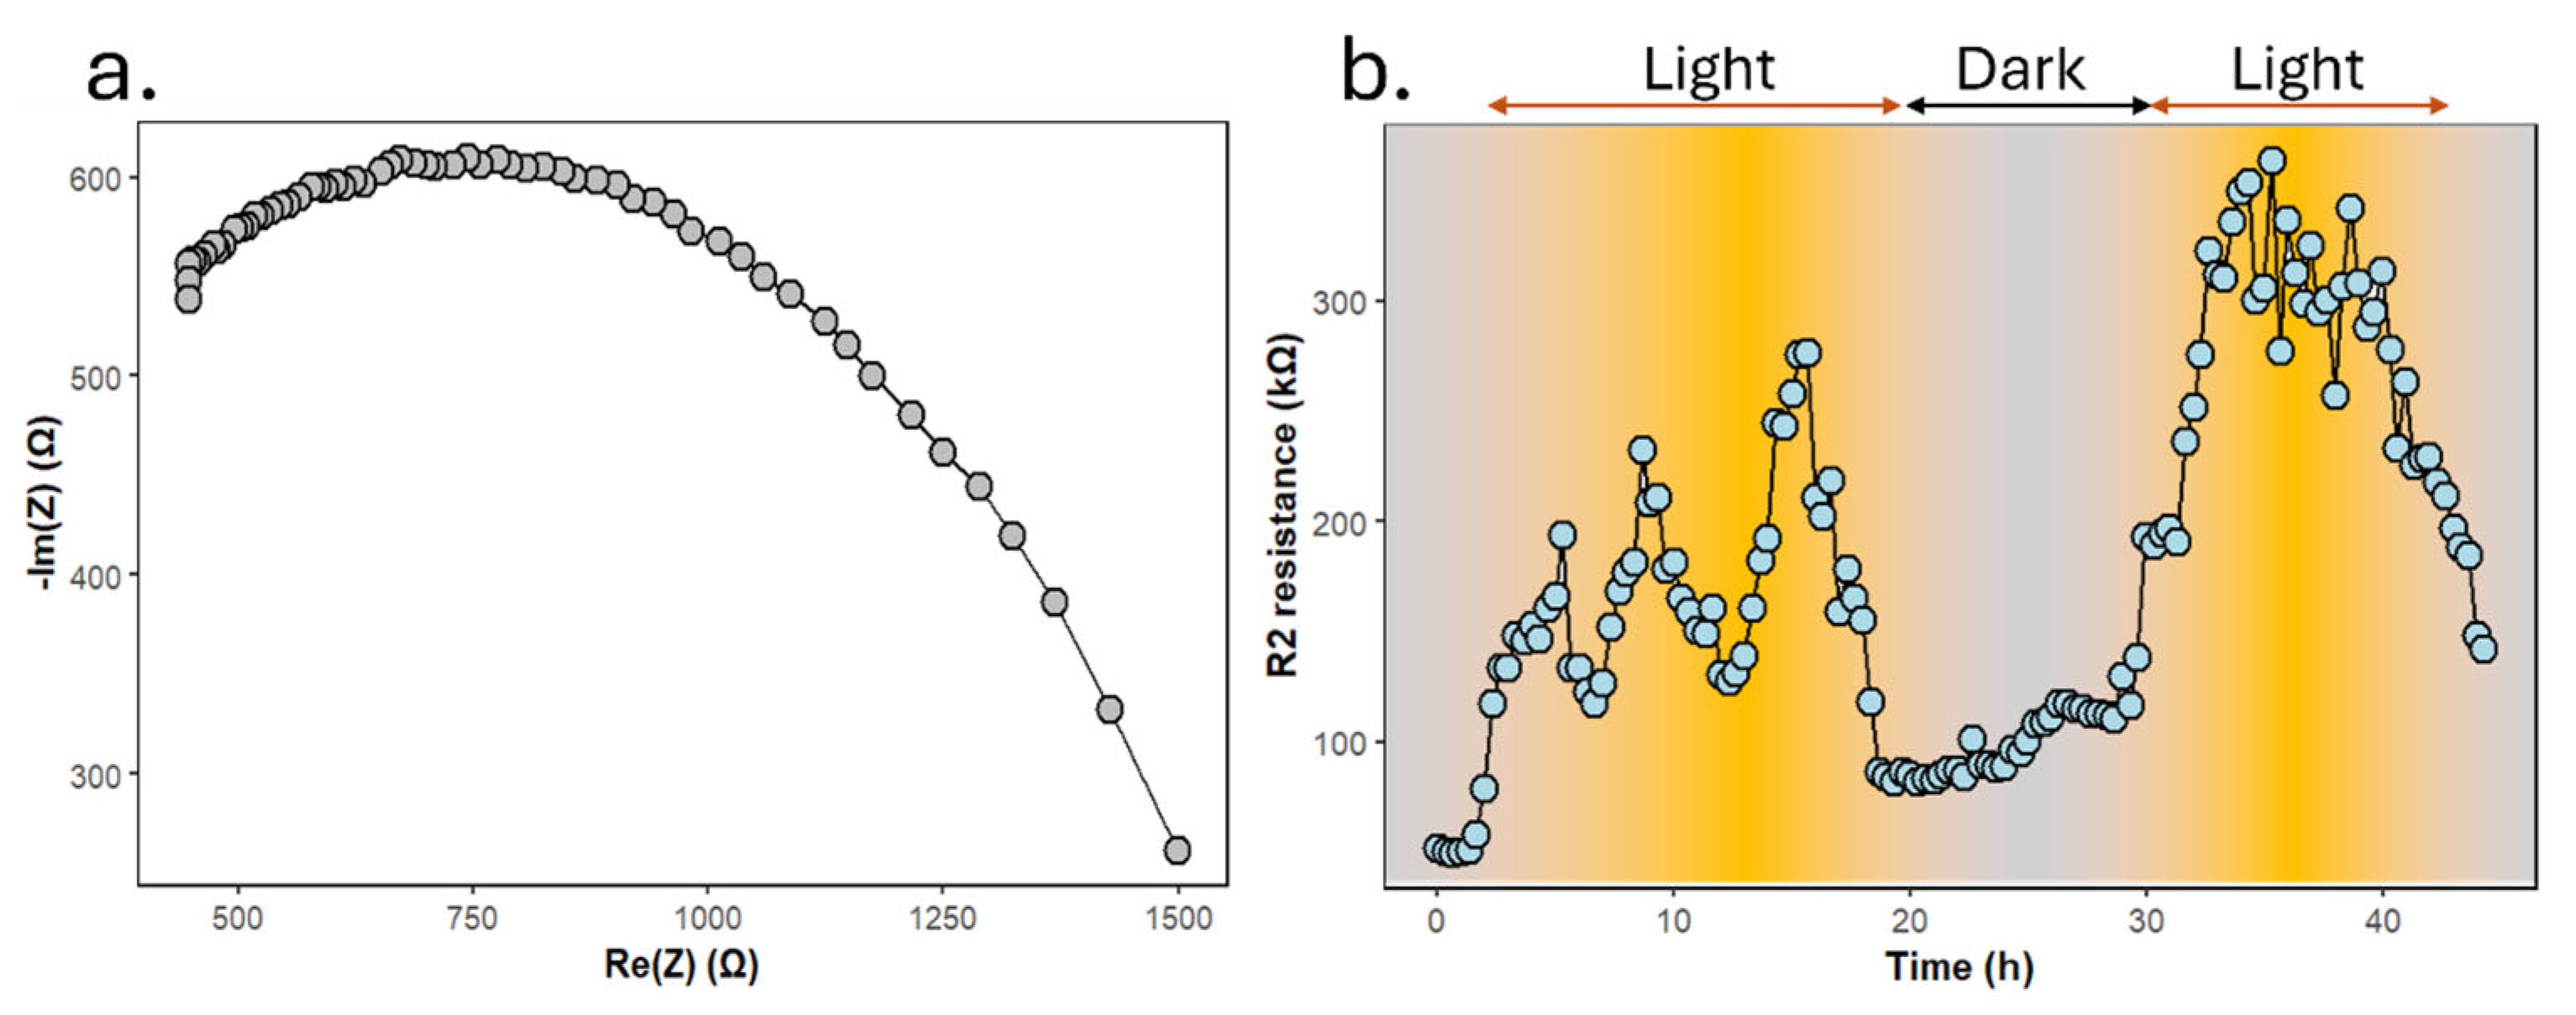
Our system successfully captured dynamic changes in ionic composition within the plant using impedance spectroscopy, offering a non-destructive, label-free method for real-time monitoring. The modified Cole model used in this study enabled robust fitting of the impedance data across the 1–100 kHz range (Figure 3a), allowing separation of resistive and capacitive contributions from different tissue compartments. The semicircular arc observed in Nyquist plots reflects the balance between resistive and capacitive elements in the Cole model. Importantly, the diameter of the arc scales with extracellular resistance, which is strongly modulated by ionic concentration in the xylem sap. In our experiments, increasing NaCl or KCl concentrations produced proportionally larger arc diameters, in line with osmotic and electrochemical shifts in the vascular environment. This correlation between ionic strength and arc size has also been reported in related plant impedance studies [27,28]. To quantify the impedance response beyond qualitative Nyquist plots, the data were fitted to a Cole circuit. Fifty independent spectra were analysed under standard (non-salt, daytime) conditions. The extracted parameters showed consistent values across replicates, with limited variability, confirming the robustness of the measurement (Table S1).
Our data demonstrated a circadian rhythm in resistance values, with peaks during the light period and troughs at night, a pattern consistent with light-driven ion transport and xylem flow (Figure 3b). Different frequency domains in the impedance spectrum correspond to distinct physiological processes in plant tissues. At low frequencies (<10 kHz), current flow is restricted to extracellular pathways, meaning the impedance primarily reflects ionic concentrations in the xylem sap. Mid-frequency ranges capture polarisation across cell membranes, providing information on membrane capacitance and integrity. At high frequencies (>50 kHz), current penetrates cell membranes, revealing intracellular conductivity associated with cytoplasmic ionic content. This frequency-dependent behaviour is consistent with prior applications of Cole-type models in plant bioimpedance studies [22]. Moreover, previously reported work has shown that stomatal conductance, xylem sap velocity, and ion uptake exhibit diurnal fluctuations [29,30], often modulated by external factors such as light intensity and temperature.
The impedance spectrum reflects frequency-dependent contributions from different tissue compartments. At low frequencies (<10 kHz), current predominantly travels through extracellular spaces, and impedance is governed by the ionic composition of the xylem sap. At mid-range frequencies (10–50 kHz), capacitive charging of cell membranes dominates, reflecting membrane integrity and polarisation phenomena. At high frequencies (>50 kHz), current penetrates cell membranes, revealing intracellular resistance associated with cytoplasmic ion conductivity. This partitioning of frequency domains provides a physiologically meaningful link between impedance features and cellular-scale processes [21,26].
To further investigate the origin of the observed oscillations in impedance, a correlation analysis was performed between impedance-derived resistance values and environmental parameters (temperature, humidity, light intensity, and VOC index). Results are shown in Figure S1. Strong correlations were identified with temperature (R2 = 0.88) and humidity (R2 = 0.81), while a moderate correlation was found with light intensity (R2 = 0.45), and only a weak correlation with VOC index (R2 = 0.16). These findings indicate that the oscillatory patterns are primarily driven by temperature and humidity, consistent with their known role in stomatal regulation and transpiration dynamics [31,32]. Light appeared to play a secondary role, likely acting indirectly by modulating stomatal aperture through circadian rhythms and photosynthetic activity. The weak correlation with VOCs suggests minimal direct involvement in the observed impedance fluctuations. These results support the interpretation that impedance oscillations reflect environment-driven stomatal and ion transport processes, with temperature and humidity exerting the dominant influence.
To enhance the interpretability of the complex signals generated by the sensor, a machine learning pipeline was developed using Scikit-learn. This algorithm could be used to determine Na+ and K+ concentrations using impedance and environmental data.
Different models were tested, including Random Forest, SVM, and XGBoost. A total of 4000 datapoints were used on each case for training. In addition to the conventional performance metrics (R2, MAE, and RMSE), a more comprehensive evaluation of model reliability was performed. Fivefold cross-validation was conducted, and mean values with standard deviations across folds are reported in Table 1. Robust predictive accuracy was observed across the different splits of the dataset, confirming the stability of the model. Among tested algorithms, XBoost yielded the highest performance across all metrics, achieving R2 values of 0.98 for Na+ and 0.99 for K+, with low RMSE values. This is consistent with previously reported work showing that RF’s ensemble learning is particularly well-suited for high-dimensional, nonlinear datasets and is relatively robust to noise and overfitting [33].
Residual analyses were also carried out. Histograms of residuals indicated an approximately symmetric distribution around zero for both Na+ and K+, while residuals versus predicted plots did not reveal systematic bias. Errors appeared randomly distributed and did not increase markedly with prediction magnitude, suggesting that the model was well-calibrated and not prone to overfitting within the tested range of conditions (Figure S2). The minimum detectable change was finally estimated following the conventional 3σ criterion. Residuals were obtained as the difference between predicted and measured concentrations in the test dataset. The standard deviation (σ) of residuals corresponding to baseline (0 mM) samples was used as an estimate of the measurement noise, and the noise floor was defined as 3σ. The MDC was then calculated by dividing this noise floor by the slope of the calibration curve obtained from linear regression. For sodium, the noise floor was 3.69 mM equivalent with a calibration slope of 0.9743 predicted units per mM, resulting in an MDC of 3.79 mM. For potassium, the noise floor was 1.90 mM equivalent with a calibration slope of 0.9986 predicted units per mM, yielding an MDC of 1.91 mM.
Interestingly, model predictions were consistently more accurate for potassium than for sodium. This difference can be explained by both physiological and electrical factors. From a physiological perspective, potassium is an essential macronutrient with tightly regulated transport mechanisms, including voltage-gated K+ channels and carrier proteins, which result in stable, circadian-linked patterns of uptake and translocation [4,34]. By contrast, sodium is less tightly regulated, and its movement through xylem is largely passive, making its dynamics more variable and less predictable. Moreover, from an electrical perspective, K+ ions exhibit higher mobility and contribute strongly to capacitive charging of cell membranes, particularly in the low-frequency domain of impedance spectra, which may enhance the sensitivity of Cole-model parameters and improve ML feature extraction. These factors could explain the superior accuracy of K+ predictions compared to Na+.
SHAP analysis revealed that low-frequency impedance features and temperature were consistently among the most important predictors for potassium concentration, whereas high-frequency impedance features were more influential for sodium concentration. These results are consistent with its passive transport and broader tissue distribution [35,36]. Stability of feature rankings across cross-validation folds was relatively strong, with an average Kendall’s τ of 0.673 for sodium and 0.739 for potassium. These values indicate that, while some variability exists, the relative importance of the top features remained consistent across folds, supporting the robustness of the interpretability framework. The higher τ observed for potassium suggests that its predictive features are somewhat more stable compared to sodium, potentially reflecting the more tightly regulated transport mechanisms of potassium in xylem sap compared to the broader distribution and passive mobility of sodium ions.

4. Conclusions

This work presents the design, development, and in vivo validation of a low-cost, Arduino-compatible sensing system able to simultaneously monitor environmental parameters and quantify nutrient concentrations in soil. A fine-resolution impedance probe that enabled anatomical localisation of implantation sites within tomato stems is also reported. This capability improved consistency and the biological relevance of impedance measurements by ensuring that sensors were placed at physiologically meaningful locations. Capacitive impedance, in particular, proved highly sensitive to tissue transitions and could serve as a valuable tool for plant anatomical mapping in future applications.
Finally, the system was augmented with machine learning, being capable of translating complex impedance and environmental data into accurate estimates of bioavailable Na+ and K+ concentrations in soil. The use of XBoost regression enabled the identification of key features, revealing that low-frequency impedance and temperature were most informative for K+ prediction, while high-frequency impedance contributed more significantly to Na+ detection. Our machine learning model achieved high predictive performance, with R2 values of 0.989 ± 0.004, MAE of 0.944 ± 0.093, and RMSE of 4.336 ± 0.733 for sodium, and R2 values of 0.995 ± 0.002, MAE of 0.415 ± 0.081, and RMSE of 2.554 ± 0.638 for potassium. These results correspond to a minimum detectable change of 3.79 mM for sodium and 1.91 mM for potassium, demonstrating sensitivity in the low millimolar range. Compared with conventional calibration methods, our approach provides improved accuracy and robustness, especially under varying environmental conditions.
As such, this work demonstrates the viability of integrating affordable electronics, impedance analysis, and artificial intelligence to create a robust and scalable solution for plant nutrient monitoring. The use of AI was critical for capturing the complex, nonlinear relationships between impedance spectra, environmental variables, and ion concentrations. Unlike traditional single-parameter calibration curves, the machine learning model was able to integrate hundreds of spectral features alongside environmental factors (temperature, humidity, VOC, and moisture), resulting in more robust and generalisable predictions. This approach reduced calibration drift, improved detection accuracy, and enabled adaptation to real-world variability that conventional regression models struggle to capture.
Analysis of feature importance revealed that specific impedance frequencies, along with environmental variables such as humidity and moisture, were consistently ranked as the strongest predictors of ion concentration. This not only informed sensor optimisation but also provided biological insight into how plant–ion interactions manifest in the electrical domain. In future studies, these feature-level insights could guide the design of targeted biosensors, reduce computational load by focusing on the most informative features, and inspire new hypotheses about plant ion uptake and stress responses.
The resulting platform opens the door to new applications in precision agriculture, plant research, and soil science by providing researchers and farmers with a tool for real-time, high-resolution insight into plant health and nutrient dynamics. Future work could explore more complex models such as recurrent neural networks (RNNs) to capture temporal dependencies, or hybrid physical–AI models that incorporate mechanistic insights from plant physiology to further improve accuracy and generalisability. A separate parallel control cohort maintained without salt stress was not included in this manuscript; future work will incorporate an unstressed control group run in parallel to further isolate treatment effects.

Supplementary Materials

The following supporting information can be downloaded at: https://www.mdpi.com/article/10.3390/engproc2025106007/s1, Table S1: Summary of resistance and capacitance results. Figure S1: Correlation analysis of impedance results with different environmental parameters; Figure S2: Analysis of residuals from the study of K+ and Na+ in tomato plants.

Funding

This research received no external funding.

Data Availability Statement

The raw data supporting the conclusions of this article will be made available by the authors on request.

Conflicts of Interest

Author Antonio Ruiz-Gonzalez was employed by Plantion Ltd. The author declares that the research was conducted in the absence of any commercial or financial relationships that could be construed as a potential conflict of interest.

References

  1. FAO. How to Feed the World in 2050. In Proceedings of the Expert Meeting on How to Feed the World in 2050, Rome, Italy, 24–26 June 2009. [Google Scholar]
  2. van Dijk, M.; Morley, T.; Rau, M.L.; Saghai, Y. A meta-analysis of projected global food demand and population at risk of hunger for the period 2010–2050. Nat. Food 2021, 2, 494–501. [Google Scholar] [CrossRef] [PubMed]
  3. Srivastava, R.K.; Purohit, S.; Alam, E.; Islam, M.K. Advancements in soil management: Optimizing crop production through interdisciplinary approaches. J. Agric. Food Res. 2024, 18, 101528. [Google Scholar] [CrossRef]
  4. Hasanuzzaman, M.; Bhuyan, M.H.M.B.; Nahar, K.; Hossain, M.S.; Mahmud, J.A.; Hossen, M.S.; Masud, A.A.C.; Moumita; Fujita, M. Potassium: A Vital Regulator of Plant Responses and Tolerance to Abiotic Stresses. Agronomy 2018, 8, 31. [Google Scholar] [CrossRef]
  5. Zhou, H.; Shi, H.; Yang, Y.; Feng, X.; Chen, X.; Xiao, F.; Lin, H.; Guo, Y. Insights into plant salt stress signaling and tolerance. J. Genet. Genom. 2024, 51, 16–34. [Google Scholar] [CrossRef]
  6. Gupta, S.; Kaur, N.; Kant, K.; Jindal, P.; Ali, A.; Naeem, M. Calcium: A master regulator of stress tolerance in plants. S. Afr. J. Bot. 2023, 163, 580–594. [Google Scholar] [CrossRef]
  7. Ragel, P.; Raddatz, N.; Leidi, E.O.; Quintero, F.J.; Pardo, J.M. Regulation of K+ Nutrition in Plants. Front. Plant Sci. 2019, 10, 281. [Google Scholar] [CrossRef] [PubMed]
  8. Yun, J.; Chen, X.; Liu, S.; Zhang, W. Effects of Temperature and Moisture on Soil Organic Carbon Mineralization. IOP Conf. Ser. Mater. Sci. Eng. 2019, 562, 012085. [Google Scholar]
  9. Zhai, J.; Luo, B.; Li, A.; Dong, H.; Jin, X.; Wang, X. Unlocking All-Solid Ion Selective Electrodes: Prospects in Crop Detection. Sensors 2022, 22, 5541. [Google Scholar] [CrossRef]
  10. Saha, A.; Mi, Y.; Glassmaker, N.; Shakouri, A.; Alam, M.A. In Situ Drift Monitoring and Calibration of Field-Deployed Potentiometric Sensors Using Temperature Supervision. ACS Sens. 2023, 8, 2799–2808. [Google Scholar] [CrossRef]
  11. Mustafa, R.; Ansari, A. Comprehensive analysis of soil electrical conductivity: An experimental and machine learning approach. Discov. Civ. Eng. 2024, 1, 82. [Google Scholar] [CrossRef]
  12. Su, S.L.; Singh, D.N.; Baghini, M.S. A critical review of soil moisture measurement. Measurement 2014, 54, 92–105. [Google Scholar] [CrossRef]
  13. Qin, J.; Monje, O.; Nugent, M.R.; Finn, J.R.; O’Rourke, A.E.; Wilson, K.D.; Fritsche, R.F.; Baek, I.; Chan, D.E.; Kim, M.S. A hyperspectral plant health monitoring system for space crop production. Front. Plant Sci. 2023, 14, 1133505. [Google Scholar] [CrossRef] [PubMed]
  14. Rengasamy, P. Soil Chemistry Factors Confounding Crop Salinity Tolerance—A Review. Agronomy 2016, 6, 53. [Google Scholar] [CrossRef]
  15. Adamchuk, V.I.; Hummel, J.W.; Morgan, M.T.; Upadhyaya, S.K. On-the-go soil sensors for precision agriculture. Comput. Electron. Agric. 2004, 44, 71–91. [Google Scholar] [CrossRef]
  16. Rossel, R.A.V.; Chen, C. Digitally mapping the information content of visible–near infrared spectra of surficial Australian soils. Remote Sens. Environ. 2011, 115, 1443–1455. [Google Scholar] [CrossRef]
  17. Islam, M.R.; Oliullah, K.; Kabir, M.M.; Alom, M.; Mridha, M.F. Machine learning enabled IoT system for soil nutrients monitoring and crop recommendation. J. Agric. Food Res. 2023, 14, 100880. [Google Scholar] [CrossRef]
  18. Cho, W.-J.; Kim, H.-J.; Jung, D.-H.; Han, H.-J.; Cho, Y.-Y. Hybrid Signal-Processing Method Based on Neural Network for Prediction of NO3, K, Ca, and Mg Ions in Hydroponic Solutions Using an Array of Ion-Selective Electrodes. Sensors 2019, 19, 5508. [Google Scholar] [CrossRef] [PubMed]
  19. Babu, G.R.; Gokuldhev, M.; Brahmanandam, P.S. Integrating IoT for Soil Monitoring and Hybrid Machine Learning in Predicting Tomato Crop Disease in a Typical South India Station. Sensors 2024, 24, 6177. [Google Scholar] [CrossRef]
  20. Freeborn, T.J.; Elwakil, A.; Maundy, B. Electrode location impact on cole-impedance parameters using magnitude-only measurements. In Proceedings of the 2016 IEEE 59th International Midwest Symposium on Circuits and Systems (MWSCAS), Abu Dhabi, United Arab Emirates, 16–19 October 2016. [Google Scholar]
  21. Muñoz, J.D.; Mosquera, V.H.; Rengifo, C.F. A low-cost, portable, two-dimensional bioimpedance distribution estimation system based on the AD5933 impedance converter. HardwareX 2022, 11, e00274. [Google Scholar] [CrossRef]
  22. Freeborn, T.J.; Elwakil, A.S.; Maundy, B. Variability of Cole-model bioimpedance parameters using magnitude-only measurements of apples from a two-electrode configuration. Int. J. Food Prop. 2017, 20 (Suppl. S1), S507–S519. [Google Scholar] [CrossRef]
  23. Zhao, S.; Zhang, Q.; Liu, M.; Zhou, H.; Ma, C.; Wang, P. Regulation of Plant Responses to Salt Stress. Int. J. Mol. Sci. 2021, 22, 4609. [Google Scholar] [CrossRef] [PubMed]
  24. Xu, X.; Du, X.; Wang, F.; Sha, J.; Chen, Q.; Tian, G.; Zhu, Z.; Ge, S.; Jiang, Y. Effects of Potassium Levels on Plant Growth, Accumulation and Distribution of Carbon, and Nitrate Metabolism in Apple Dwarf Rootstock Seedlings. Front. Plant Sci. 2020, 11, 904. [Google Scholar] [CrossRef] [PubMed]
  25. Benson, K.; Cramer, S.; Galla, H.-J. Impedance-based cell monitoring: Barrier properties and beyond. Fluids Barriers CNS 2013, 10, 5. [Google Scholar] [CrossRef] [PubMed]
  26. Abasi, S.; Aggas, J.R.; Garayar-Leyva, G.G.; Walther, B.K.; Guiseppi-Elie, A. Bioelectrical Impedance Spectroscopy for Monitoring Mammalian Cells and Tissues under Different Frequency Domains: A Review. ACS Meas. Sci. Au 2022, 2, 495–516. [Google Scholar] [CrossRef]
  27. Hussain, M.I.; El-Keblawy, A.; Akhtar, N.; Elwakil, A.S. Electrical Impedance Spectroscopy in Plant Biology. In Sustainable Agriculture Reviews 52; Lichtfouse, E., Ed.; Springer International Publishing: Cham, Switzerland, 2021; pp. 395–416. [Google Scholar]
  28. Liu, Y.; Li, D.; Qian, J.; Di, B.; Zhang, G.; Ren, Z. Electrical impedance spectroscopy (EIS) in plant roots research: A review. Plant Methods 2021, 17, 118. [Google Scholar] [CrossRef]
  29. Yang, L.; Liu, H.; Cohen, S.; Gao, Z. Microclimate and Plant Transpiration of Tomato (Solanum lycopersicum L.) in a Sunken Solar Greenhouse in North China. Agriculture 2022, 12, 260. [Google Scholar] [CrossRef]
  30. Lanoue, J.; Leonardos, E.D.; Grodzinski, B. Effects of Light Quality and Intensity on Diurnal Patterns and Rates of Photo-Assimilate Translocation and Transpiration in Tomato Leaves. Front. Plant Sci. 2018, 9, 756. [Google Scholar] [CrossRef]
  31. Fernández, J.E. Plant-Based Methods for Irrigation Scheduling of Woody Crops. Horticulturae 2017, 3, 35. [Google Scholar] [CrossRef]
  32. Azzarello, E.; Mugnai, S.; Pandolfi, C.; Masi, E.; Mancuso, S. Stress Assessment in Plants by Impedance Spectroscopy. Floric. Ornam. Plant Biotechnol. 2006, 3, 140–148. [Google Scholar]
  33. Huang, B.F.F.; Boutros, P.C. The parameter sensitivity of random forests. BMC Bioinform. 2016, 17, 331. [Google Scholar] [CrossRef]
  34. Wang, Y.; Wu, W.-H. Potassium Transport and Signaling in Higher Plants. Annu. Rev. Plant Biol. 2013, 64, 451–476. [Google Scholar] [CrossRef] [PubMed]
  35. Van Haeverbeke, M.; De Baets, B.; Stock, M. Plant impedance spectroscopy: A review of modeling approaches and applications. Front. Plant Sci. 2023, 14, 1187573. [Google Scholar] [CrossRef] [PubMed]
  36. Ozier-Lafontaine, H.; Bajazet, T. Analysis of Root Growth by Impedance Spectroscopy (EIS). Plant Soil 2005, 277, 299–313. [Google Scholar] [CrossRef]
Figure 1. (a) Schematic representation of the device developed in this study for the detection of microclimate (temperature, humidity, pressure, and VOCs), as well as bioimpedance. (b) Modified Cole model was used in this study for the analysis of bioimpedance.
Engproc 106 00007 g001
Figure 2. (a) Schematic representation of the stem axial structure, containing multiple distinguishable tissues. Colour bar representing maximum and minimum values is shown. (b) Heatmap of surface impedance in plants. Values decreased close to the leaf tissue, being consistent with a higher concentration of electrolytes. (c) Values of resistance used for generating the heatmap. (d) Radial distribution of capacitive values, showing changes at distances, indicative of different tissues. (e) By contrast, resistance values showed a lower sensitivity to differences in tissue distribution.
Engproc 106 00007 g002
Figure 3. (a) Typical Nyquist plot of plant xylem tissue, showing the relationship between imaginary and real impedances. Raw data from Nyquist plots were used for the training of AI algorithms. (b) Monitoring of resistance values continuously for 2 days, showing an increase during the day.
Engproc 106 00007 g003
Table 1. Comparison of the performance of different machine learning models in the prediction of sodium and potassium concentrations.
ElectrolyteModelR2MAERMSE
SodiumRandom Forest0.983 ± 0.0050.939 ± 0.1175.378 ± 0.716
Potassium0.994 ± 0.0040.345 ± 0.0832.787 ± 0.830
SodiumSVM0.132 ± 0.05520.609 ± 1.12238.795 ± 2.359
Potassium0.493 ± 0.04011.589 ± 0.62225.960 ± 0.963
SodiumXBoost0.989 ± 0.0040.944 ± 0.0934.336 ± 0.733
Potassium0.995 ± 0.0020.415 ± 0.0812.554 ± 0.638
Disclaimer/Publisher’s Note: The statements, opinions and data contained in all publications are solely those of the individual author(s) and contributor(s) and not of MDPI and/or the editor(s). MDPI and/or the editor(s) disclaim responsibility for any injury to people or property resulting from any ideas, methods, instructions or products referred to in the content.