Abstract
Security checks (SCs) at metro stations are regarded as an effective measure to address the heightened security risks associated with high ridership. Introducing SCs without exacerbating congestion requires a thorough understanding of their impact on passenger flow. Most existing studies were conducted where SCs are mandatory and fixed at certain locations. This study presents a method for advising the scale and placement for SCs under a more relaxed security setting. Using agent-based simulation with heterogeneous profiles for both inbound and outbound passenger flow, existing bottlenecks are first identified. By varying different percentages of passengers for SCs and locations to deploy SCs, we observe the influence on existing bottlenecks and suggest a suitable configuration. In our experiments, key bottlenecks are identified before tap-in fare gantries. When deploying SCs near tap-in fare gantries as seen in current practices, a screening percentage of beyond 10% could exacerbate existing bottlenecks and also create new bottlenecks at SC waiting areas. Relocating the SC to a point beyond the fare gantries helps alleviate congestion. This method provides a reference for station managers and transport authorities for balancing security and congestion.
1. Introduction
Urban rail transit systems, as the backbone of public transportation systems, are essential for daily commuting and connectivity in major cities. As commuting, tourism and entertainment activities return to pre-pandemic level, major metro stations are experiencing congestion—particularly during peak hours and around major public events such as service disruption, concerts and celebrations. Such crowding not only disrupts commuters’ travel efficiency, but also heightens security risks. To address these concerns, security checks (SCs) are considered necessary at metro stations, despite impacting passenger efficiency.
Globally, there are mainly three types of SCs at metro stations depending on passenger coverage:
- Comprehensive: All passengers need to go through door frame metal detectors and their bags need to be checked with handheld metal detectors or X-ray machines.
- Selective: Passengers are randomly checked at selected stations during regular emergency preparedness exercises, major events, or sometimes daily operation.
- Minimal: In this type, passengers are rarely checked upon entering metro stations, hence minimizing the impact on passenger flow.
Due to the varied adoption of SC practices worldwide, there have been limited studies investigating their impact on passenger flow. Most research has been conducted under the comprehensive SC mode. Some researchers focused on enhancing SC efficiency by optimizing facility configurations. Yu et al. modelled passenger flow in a station in Guangzhou using a simulation and found that existing SC facilities cannot meet the requirements of passenger flow in extreme peak hours [1]. They proposed measures such as adding SC machines and ticket vending machines and saw an improvement in crowd density and the number of inbound passengers. Wei et al. suggested an optimal X-ray conveyor belt length to reduce waiting time at SC queues based on the M/M/1/N queuing model [2]. In a subsequent study [3], they recommended suitable combinations of X-ray machines and detector doors that yield the shortest systematic and individual waiting time and least serious congestion. Other studies explored expediting the SC process, such as by adopting a dedicated SC channel [3,4,5] for passengers with small bags or skipping SCs for passengers without bags [6]. These countermeasures have been proven effective in reducing crowd density in areas prior to fare gantries, increasing served passengers and shortening SC waiting time. However, there are still some gaps left to be addressed:
- Most existing studies are conducted in mainland China under the comprehensive SC type. This might be difficult to directly reference for other places where an SC is not a norm, especially on how many passengers should be screened to avoid congestion.
- Since SC facilities in these studies tend to be bulky, the locations for SCs are usually fixed (at station entry points). There is one recent study [7] that considered moving SCs from the station hall to the entrance channel, which is sufficiently long for congestion prevention. However, this might not apply for stations without long entrance channels.
- Most studies only simulate inbound passengers or passenger flow near SCs. Only [7] has modelled alighting, boarding and transfer passengers when identifying bottlenecks.
- While some studies differentiate passenger profiles by luggage, the impact of such heterogeneity on their behaviours is considered only in the context of SC channel selection. More fine-grained behaviours such as passenger sizes, walking speeds and preferences for facilities in the stations were not modelled accordingly.
This study proposes a method to evaluate the impact of SCs on heterogeneous passengers at metro stations where an SC is non-mandatory. An agent-based simulation model with fine-grained passenger profiles and behaviours was built to identify bottleneck areas. By exploring screening percentages of different profiles and varying locations of SCs, we evaluated the influence on key bottleneck areas and suggested a suitable scale and placement of SCs with the least disruption. This method serves as a guidance to station managers or transport authorities for SC deployment.
2. Methodology
2.1. Simulation Environment
In this study, we build a microscopic passenger flow model for a metro station by using AnyLogic software (version 8.9.3), which is widely adopted in research reviewed in the previous section. To demonstrate the proposed method, the station layout, facilities, and passenger statistics in City Hall station in Singapore were taken as an example. It is an underground cross-platform interchange station in the central region of Singapore, connecting two Mass Rapid Transit (MRT) lines, both operating high-capacity 6-car trainsets. The station provides access to shopping malls, office buildings, tourist attractions and public events such as the F1 race, National Day Parade and New Year’s Eve celebrations. During the events, random screenings were conducted.
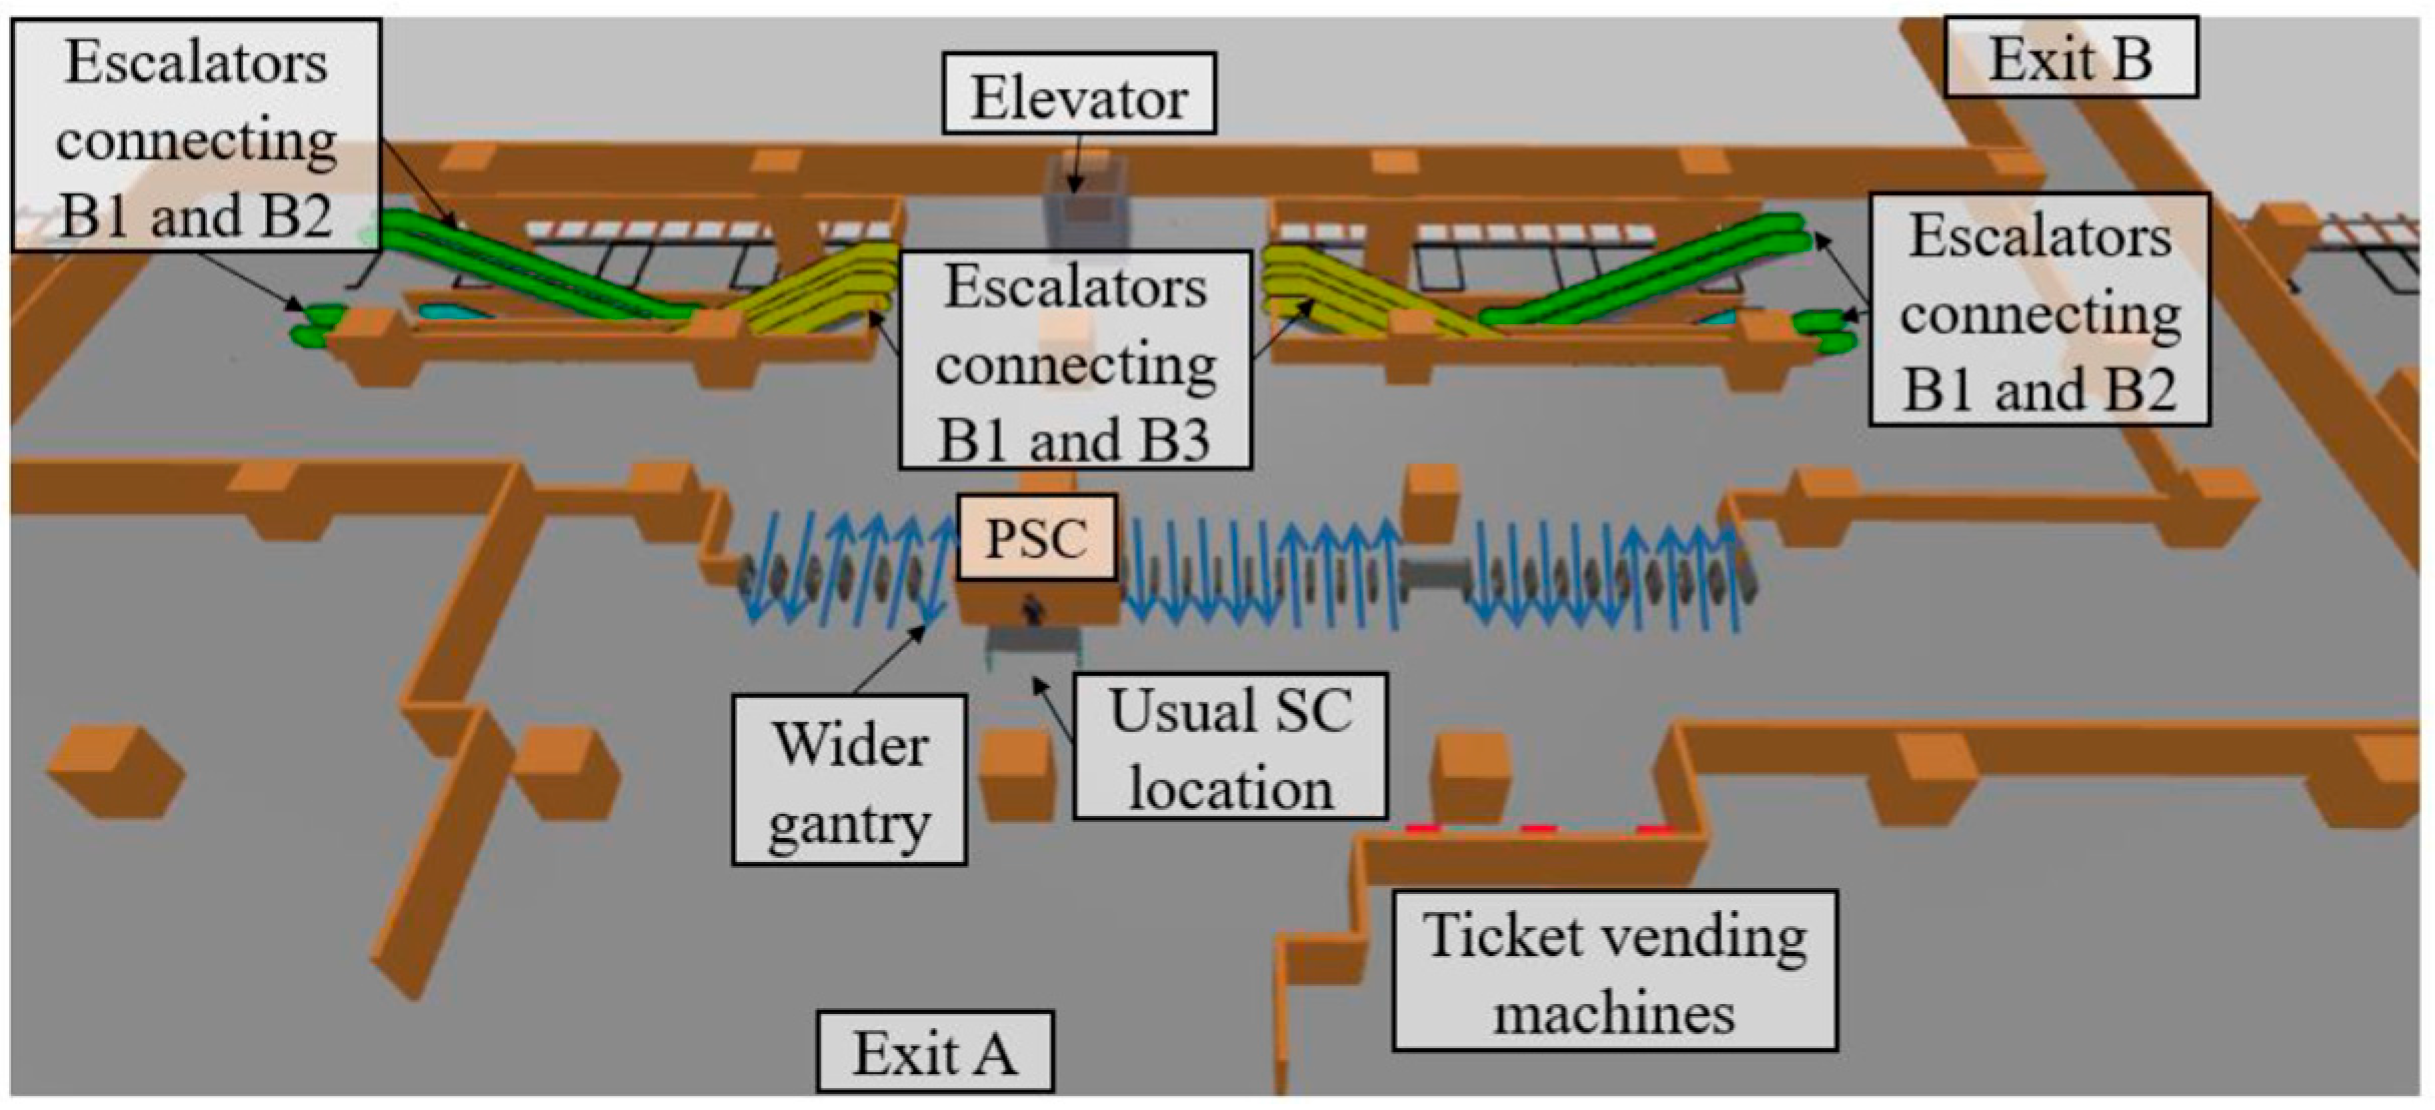
Figure 1 shows the station layout and facilities. The station has three levels, the top concourse level (denoted as B1) and platform levels below (denoted as B2 and B3), arranged in two stacked island platforms. The green escalators on both sides connect B1 and B2 and the yellow escalators, near the elevator, link B1 and B3.

Figure 1.
Concourse layout and facilities.
Based on the farecard transaction data collected over 22 working days, as shared by [8], the average passenger flow at the station peaks between 6 and 7 pm, with 6391 passengers tapping in and 5487 passengers tapping out. In the simulation, we assign these inflow passengers equally to both exits and outflow passengers to trains with a peak headway of 3 min.
There are three sets of fare collection gantries aligned with the passenger service centre (PSC). We adopted an afternoon peak gantry direction setting as shown by the blue arrows in Figure 1, where 12 gantries are dedicated to tapping out and 11 gantries for tapping in. A bidirectional, wider gantry is placed on the left of the PSC for passengers with personal mobility devices (PMDs) such as wheelchairs.
2.2. Passenger Profiles and Behaviour Models
To represent real-life passengers, we defined seven passenger profiles categorized by age group, PMD usage and luggage usage: middle-aged adults (hereafter referred as “adults”) without luggage, middle-aged adults with luggage, elderly adults (hereafter referred as “elders”) without luggage, elderly adults with luggage, children without luggage, children with luggage, and PMD users. We assume the percentage of elders and children and PMD users to be 10%, 10% and 1%, respectively, while the rest are adults. Within each profile, 5% are laden with luggage. Table 1 shows the passenger profiles and their parameters. The embedded social force model [6] is used to model passenger flow. The speed and body diameter of non-PMD users were based on references [9,10]. The speed of PMD users was based on [11] and the diameter was set in accordance with dimension restriction by local authorities [12]. For luggage-laden passengers, the walking speed is reduced by 30% [13] and the diameter is increased by 0.17 m [14] compared to those without luggage.

Table 1.
Passenger profiles with parameters.
We assume all passengers except PMD users prefer the gantry with the shortest queue. If gantries have the same queue lengths, passengers chose the nearest gantry. Further, PMD users choose the wider gantry. Since it is bi-directional, the queue length in this gantry is counted by summing both sides. The time taken for tapping at fare gantries was assumed to follow a uniform distribution between 1 s and 2 s based on our field observation.
PMD users can only choose elevators due to their mobility restrictions. For other passengers, the probability of choosing elevators varies with elders having a higher probability, followed by adults and children. Such a probability is increased if the passenger carries luggage. The probability for elders, adults and children without luggage is assumed to be 10%, 5%, and 2.5%, which is doubled when the passenger is laden with luggage. They will choose escalators instead if their waiting time for elevators exceeds 30 s. The elevator has a capacity of 15 people, operating at 1 m/s. The escalators travel at 0.75 m/s during peak hours as per local guidelines.
Based on field observations, most passengers inspected by security officers carry luggage. To facilitate interpretation, we assume a screening probability of 1 for all luggage-laden passengers and 0 for passengers without luggage. In other words, the screening percentage is equivalent to the percentage of passengers with luggage. The time taken for SCs was assumed to follow a uniform distribution from 7 s to 8 s [4]. More refined risk modelling is underway as future study.
Although passengers can pay travel fares using bank cards, some still use stored-value cards, which necessitates a visit to ticket vending machines for top-ups before proceeding to fare gantries. Given the high traffic volume during peak hours, which may discourage passengers from topping up, we assume these passengers constitute 1% of the simulated population.
2.3. Experimental Design
We initially excluded SCs in the experiment to identify bottleneck areas at the station concourse by observing the crowd density heatmap. Subsequently, SCs are added at the usual location to evaluate their impact in these bottleneck areas. Finally, we experiment on placing SCs at an unconventional location and evaluate congestions caused by SCs by comparing their effect on the bottleneck areas. All experiments are run in Intel (R) Core (TM) i7-1260P 2.10 Ghz Lenovo PC with 16 GB RAM sourced from Singapore.
3. Results and Discussion
3.1. Existing Bottlenecks with and Without SC
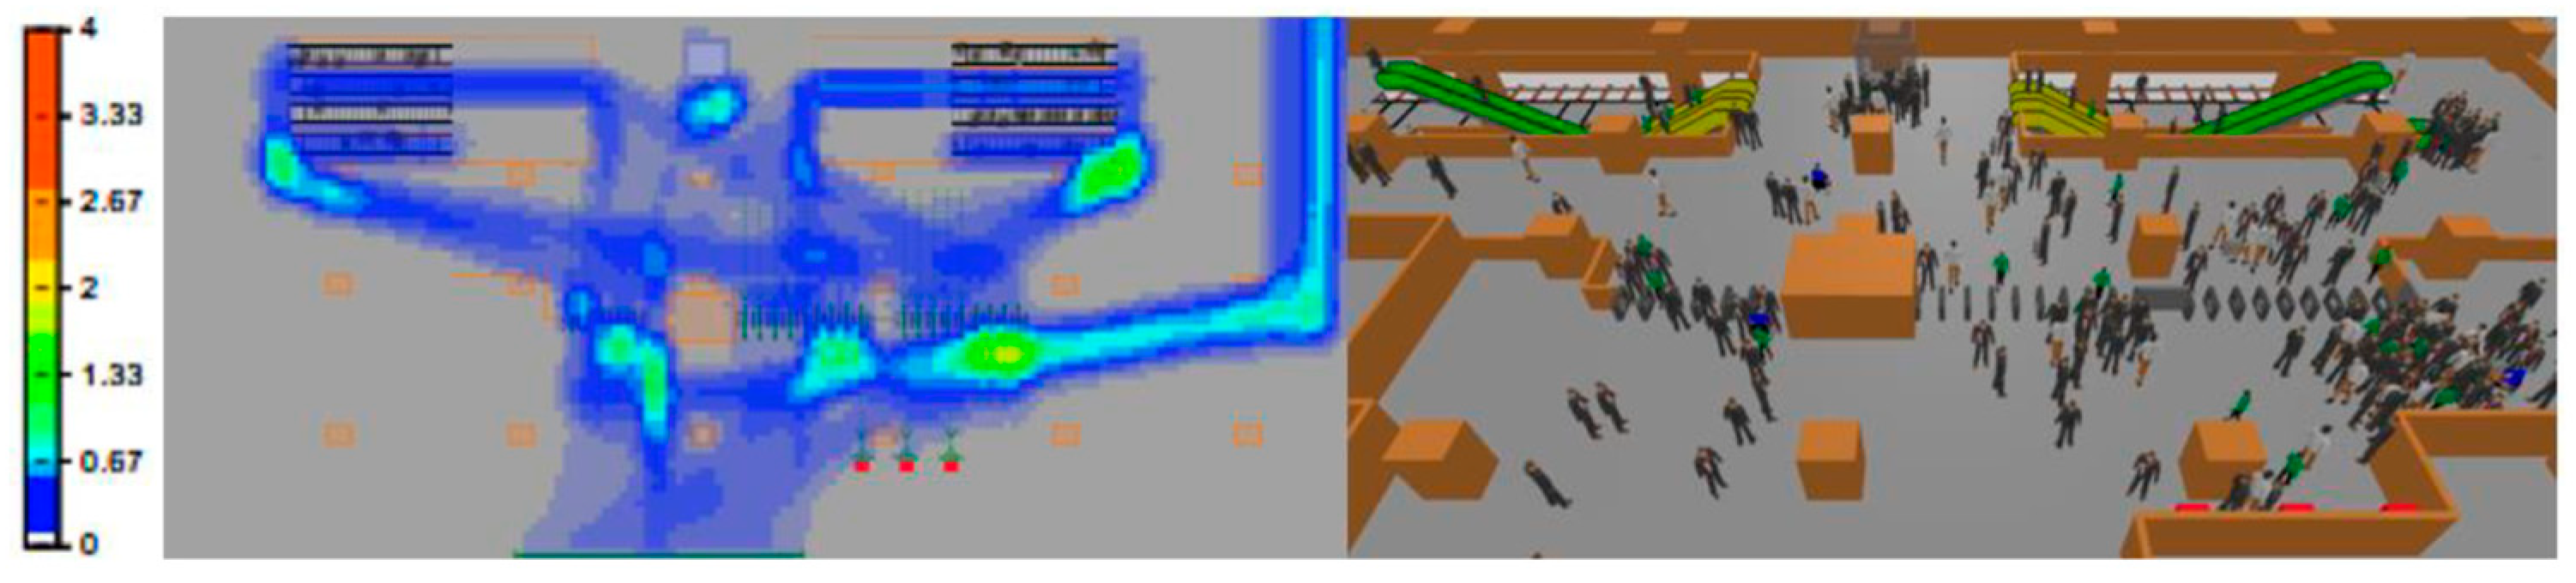
Figure 2 shows a heatmap visualizing the average crowd density without SCs. It is at a logarithmic scale to reflect small variations. As highlighted by areas in yellow and orange, key bottleneck areas occur before tap-in gantries, especially at the right gantry set due to the narrower path. This is probably due to the higher rate of inflow than outflow at fewer gantries. The dense areas near the escalators are caused by merging passengers from both directions, which can be solved by setting guardrails for separation [7]. The noticeably longer queue in front of the wider gantry is likely caused by the slower speed of PMD users and the delay when faced with passengers waiting in the tap-out direction.
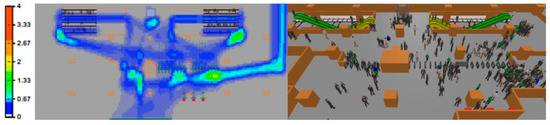
Figure 2.
Crowd density without SC.
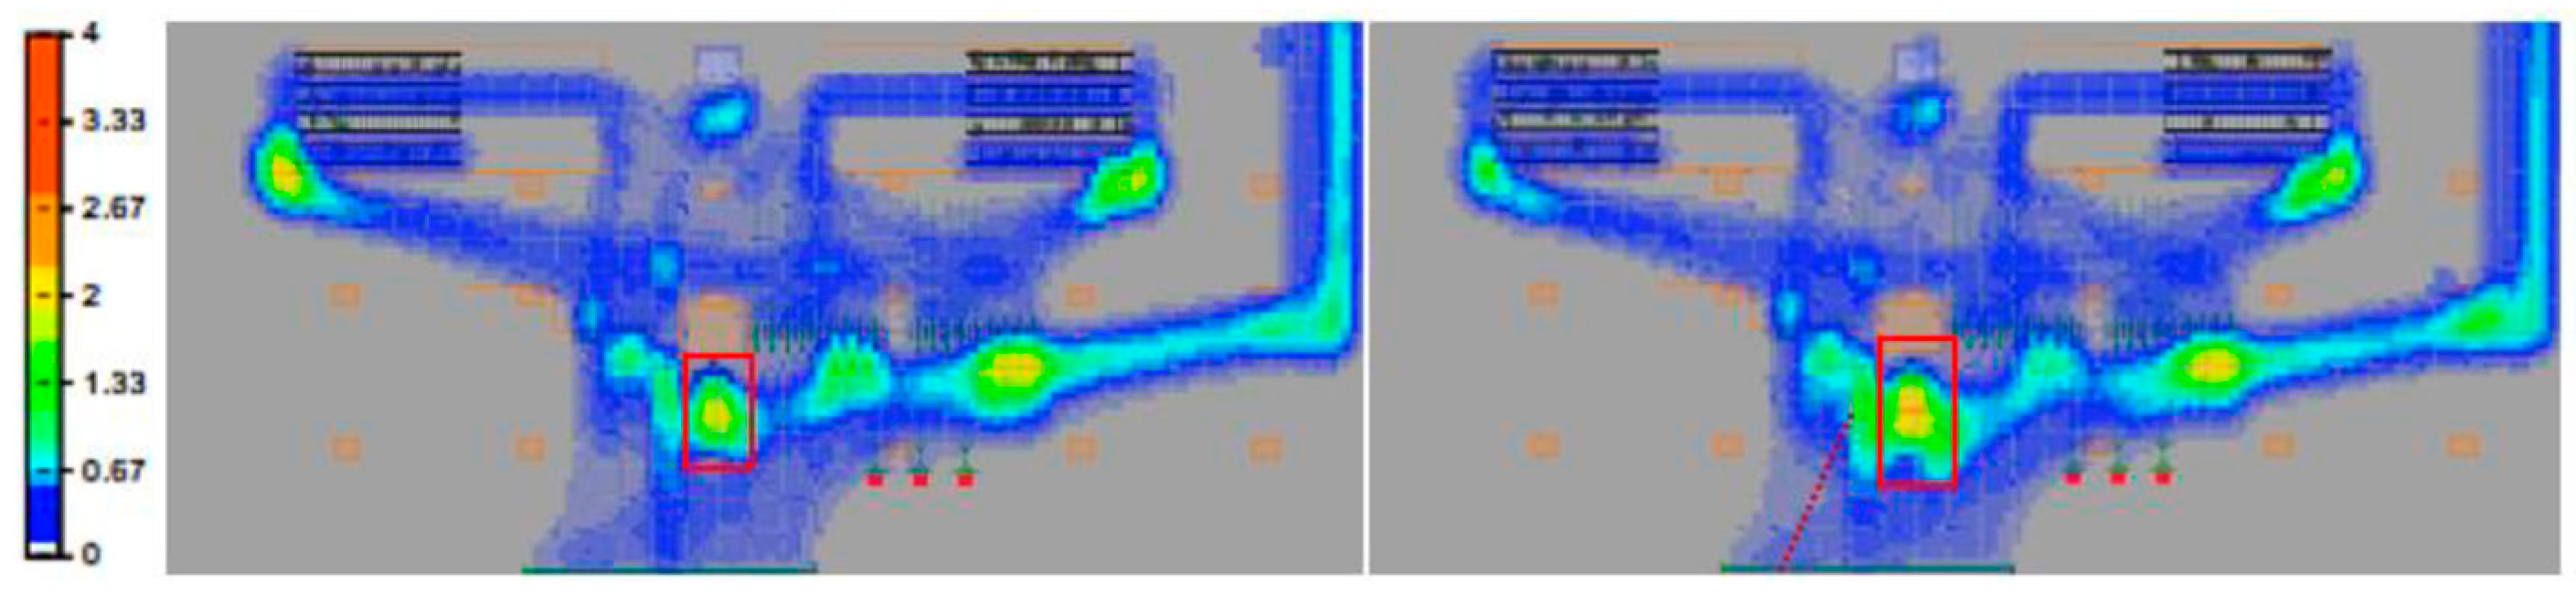
Figure 3 shows the heatmap after setting up a SC at its usual location. The red rectangle highlights the crowd in the SC queuing areas, which is still manageable under 1.33 pax/m2. The crowd density at the right gantry set is increased and widened towards the middle gantry set due to the increased passengers with paths to the SC location.
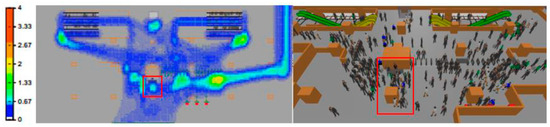
Figure 3.
Crowd density with 5% SC.
3.2. Influence of SC Percentage
Figure 4 shows the congestion heatmap after increasing the SC percentage to 10% and 15%. Significant spillovers to the adjacent gantry sets are observed from 10%, making the queue length of the wide tap-in gantry longer. This causes a greater issue when increasing the percentage to 15%. The SC waiting area reached a higher density beyond 2.67 pax/m2 at a larger area, creating a new bottleneck. Because of the blockage, some passengers exiting from the wide tap-out gantry experienced difficulty in reaching Exit A (shown in the red dotted line).
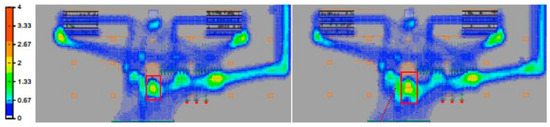
Figure 4.
Crowd density with 10% (left) and 15% (right) SC.
The results suggest that for the current simulation layout and experiment setting, the optimal SC percentage that avoids causing additional congestion is between 5% and 10%. If the percentage exceeds 10%, other SC locations may need to be considered.
3.3. Influence of SC Location
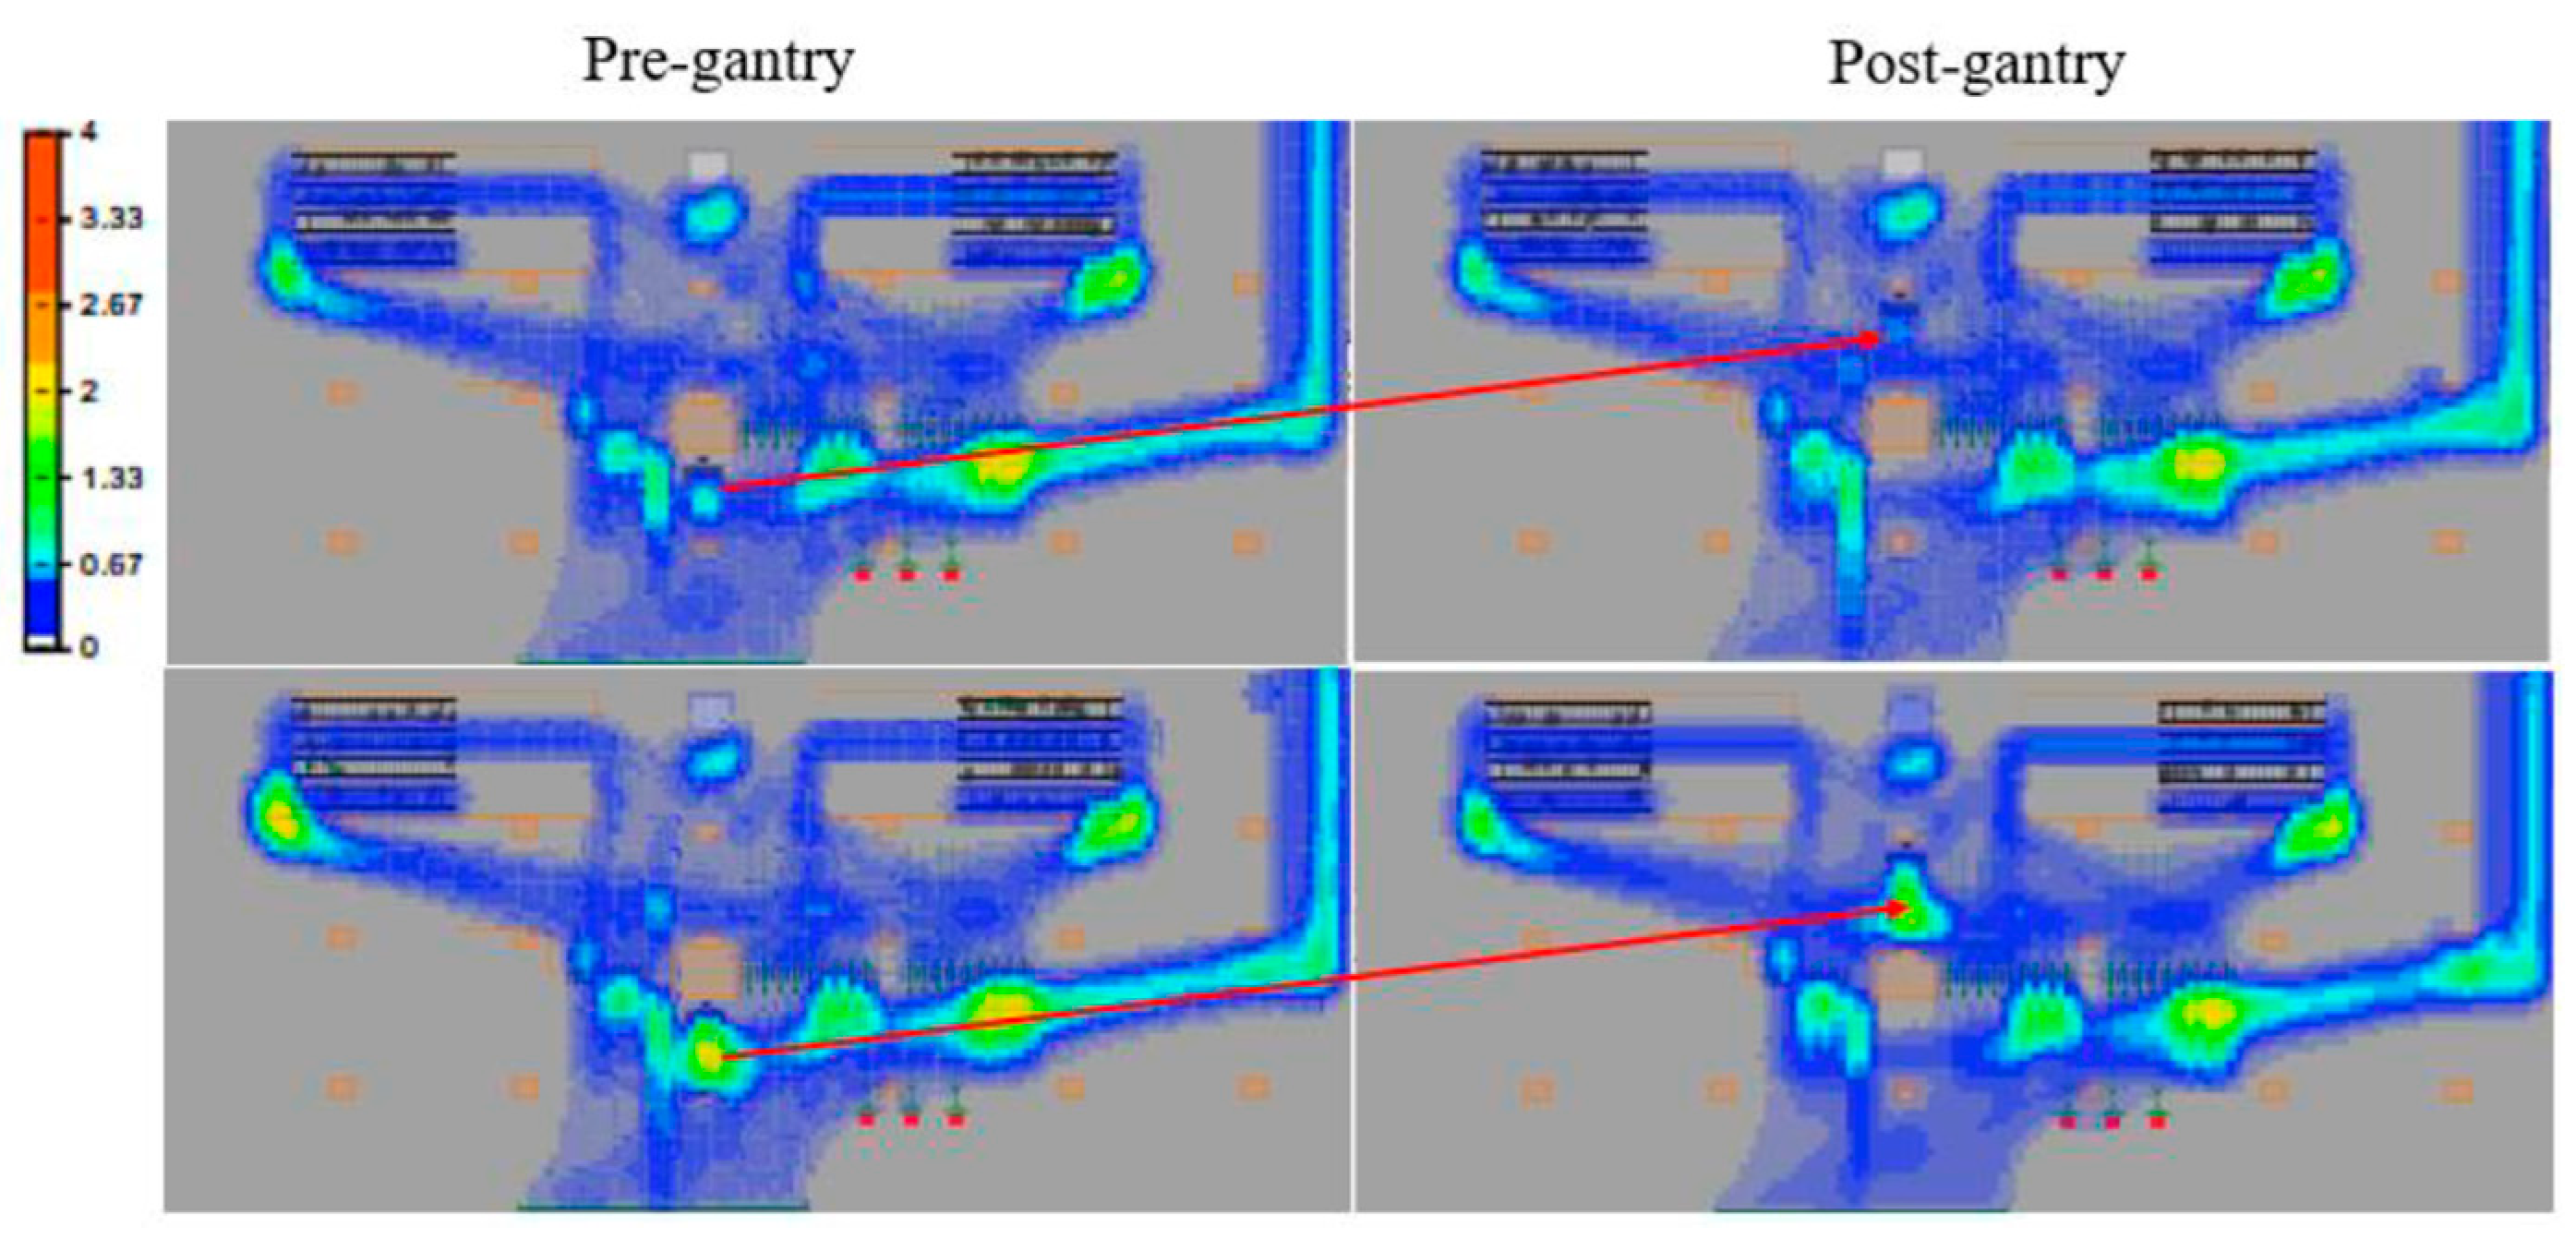
Given the impact of SCs on the non-paying areas, we explored moving SCs to after the fare gantries. Inbound passengers are screened right after they tapped in, without increasing travel distance drastically. Figure 5 shows the comparison under 5% and 10% of the SC percentage. In both cases, the average crowd density in the SC waiting area reduces. This is due to the smaller volume of tap-out passengers at the gantries near the PSC.
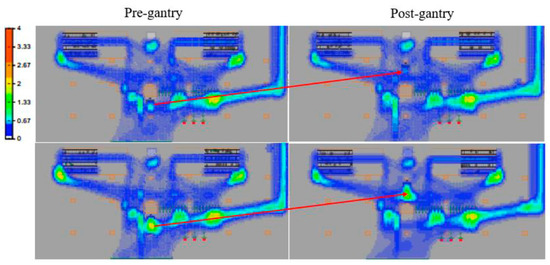
Figure 5.
Crowd density with 5% (top) and 10% (bottom) SC pre- and post-gantry.
If the SC percentage is increased for security concerns, other locations may be considered for SCs. These areas can be at the end of corridor connecting Exit B and corner areas near the escalators connecting to B2. Both may help slow down passengers arriving at existing bottlenecks such as the one in front of the right tap-in gantry set and the escalator clusters, thus reducing crowd density and increasing passenger travel time at the concourse. Identifying the optimal location to balance the trade-off between reducing crowd density and minimizing passenger travel time is one of the key future directions of this ongoing research.
4. Conclusions
This study presents an agent-based modelling methodology to evaluate the influence of the SC scale and location on metro station congestion under heterogeneous passenger profiles. By comparing its influence on existing bottlenecks, we advise a 5–10% SC percentage at the current SC location and suggest exploring post-gantry SCs if the station managers wish to further alleviate congestion at the SC queuing area.
Future research directions include verifying the method at more stations with real-life data, exploring other underutilized areas for SCs, incorporating more diverse congestion evaluation metrics, and changing the SC strategy from by luggage to by risk. Risk modelling can leverage expert experience and be integrated with a computer-vision-based risk detection system at station entrances for enhanced accuracy, facilitating more efficient security screening.
Author Contributions
Conceptualization, Z.M.; methodology, Z.M. and G.L.B.; software, M.Z. and Z.M.; validation, Z.M. and G.L.B.; formal analysis, Z.M.; investigation, Z.M.; resources, Z.M.; data curation, Z.M.; writing—original draft preparation, Z.M.; writing—review and editing, G.L.B. and Z.M.; visualization, Z.M. and M.Z.; supervision, G.L.B.; project administration, G.L.B.; funding acquisition, G.L.B. All authors have read and agreed to the published version of the manuscript.
Funding
This research received no external funding.
Institutional Review Board Statement
Not applicable.
Informed Consent Statement
Not applicable.
Data Availability Statement
Not applicable. The data are not available for sharing.
Conflicts of Interest
The authors are employees of the company Hitachi Asia Ltd. and conducted this research as part of their roles in the company’s Research & Development Centre. The authors declare no other conflicts of interest.
References
- Yu, H.; Wang, Y.; Wang, F.; Qiu, P. Understanding impacts of security check on passenger flow in a metro station and improving measures: A case study in Guangzhou, China. J. Adv. Transp. 2019, 1, 7438545. [Google Scholar] [CrossRef]
- Wei, Z.; Chu, S.; Huang, Z.; Qiu, S.; Zhao, Q. Optimization design of X-ray conveyer belt length for subway security check systems in Beijing, China. Sustainability 2020, 12, 2133. [Google Scholar] [CrossRef]
- Wei, Z.; Liang, J.; Qiu, S.; Wang, S.; Liu, S. How Many Facilities Are Needed? Evaluating Configurations of Subway Security Check Systems via a Hybrid Queueing Model. IEEE Trans. Intell. Transp. Syst. 2021, 23, 8209–8222. [Google Scholar] [CrossRef]
- Zhou, Y.; Zhao, M.; Sun, L. Optimization of bottleneck facilities in subway stations based on WiFi data. In CICTP 2019: Transportation in China—Connecting the World; Zhang, L., Ma, J., Liu, P., Zhang, G., Eds.; American Society of Civil Engineers: Reston, VA, USA, 2019; pp. 6287–6298. [Google Scholar]
- He, B.; Liu, Y.; Gao, X.; An, F.; Lv, X. Passenger Queuing Analysis Method of Security Inspection and Ticket-Checking Area without Archway Metal Detector in Metro Stations. Promet–Traffic Transp. 2023, 35, 772–785. [Google Scholar] [CrossRef]
- Wan, M.; Chen, Z.; Guo, J.; Wan, P. Optimization of security check efficiency in subway station based on Anylogic: A case study of Nanchang Metro. J. Intell. Fuzzy Syst. 2024, 41, 5035–5043. [Google Scholar] [CrossRef]
- Peng, J.; Wei, Z.; Li, J.; Guo, X.; Wang, S. Passenger flow bottleneck decongestion in subway stations: A simulation study. Simulation 2024, 100, 981–995. [Google Scholar] [CrossRef]
- E, J.; Li, M.; Huang, J. CrowdAtlas: Estimating crowd distribution within the urban rail transit system. In Proceedings of the 2021 IEEE 37th International Conference on Data Engineering (ICDE), Chania, Greece, 19–22 April 2021; pp. 2219–2224. [Google Scholar]
- Yeo, S.K.; He, Y. Commuter characteristics in mass rapid transit stations in Singapore. Fire Saf. J. 2009, 44, 183–191. [Google Scholar] [CrossRef]
- Lei, W.; Li, A.; Gao, R.; Hao, X.; Deng, B. Simulation of pedestrian crowds’ evacuation in a huge transit terminal subway station. Phys. A Stat. Mech. Its Appl. 2012, 391, 5355–5365. [Google Scholar] [CrossRef]
- Sonenblum, S.E.; Sprigle, S.; Lopez, R.A. Manual wheelchair use: Bouts of mobility in everyday life. Rehabil. Res. Pract. 2012, 2012, 753165. [Google Scholar] [CrossRef] [PubMed]
- An Inclusive Public Transport System. Available online: https://www.lta.gov.sg/content/ltagov/en/getting_around/public_transport/a_better_public_transport_experience/an_inclusive_public_transport_system.html (accessed on 15 January 2025).
- Ali, M.F.M.; Abustan, M.S.; Talib, S.H.A.; Abustan, I.; Abd Rahman, N.; Gotoh, H. A case study on the walking speed of pedestrian at the bus terminal area. In Proceedings of the E3S Web of Conferences, Penang, Malaysia, 28–29 November 2017; pp. 1–7. [Google Scholar]
- Davis, D.G.; Braaksma, J.P. Adjusting for luggage-laden pedestrians in airport terminals. Transp. Res. Part A Gen. 1988, 22, 375–388. [Google Scholar] [CrossRef]

Disclaimer/Publisher’s Note: The statements, opinions and data contained in all publications are solely those of the individual author(s) and contributor(s) and not of MDPI and/or the editor(s). MDPI and/or the editor(s) disclaim responsibility for any injury to people or property resulting from any ideas, methods, instructions or products referred to in the content. |
© 2025 by the authors. Licensee MDPI, Basel, Switzerland. This article is an open access article distributed under the terms and conditions of the Creative Commons Attribution (CC BY) license (https://creativecommons.org/licenses/by/4.0/).