Proceeding Paper

Design and Construction of an Engine Oil Viscosity Meter with Electronic Control †

1
Department of Mechanical and Instrument Engineering, Faculty of Mechanical Engineering, Technical University of Sofia, Branch Plovdiv, 4000 Plovdiv, Bulgaria
2
Center of Competence “Smart Mechatronic, Eco-and Energy-Saving Systems and Technologies”, 4000 Plovdiv, Bulgaria
3
Department of Transport and Aircraft Equipment and Technologies, Technical University of Sofia, Plovdiv Branch, 25 Tsanko Dyustabanov Street, 4000 Plovdiv, Bulgaria
*
Author to whom correspondence should be addressed.
Presented at the 14th International Scientific Conference TechSys 2025—Engineering, Technology and Systems, Plovdiv, Bulgaria, 15–17 May 2025.
Eng. Proc. 2025, 100(1), 55; https://doi.org/10.3390/engproc2025100055
Published: 22 July 2025

Abstract

This study presents the design and implementation of a novel, sensor-based falling-sphere viscometer specifically tailored for measuring the viscosity of engine oil. The equipment utilizes a metallic sphere and two strategically placed sensors to determine the travel time over a predetermined distance within an oil-filled tube. By applying fundamental principles of fluid dynamics, including Stokes’ law, the system accurately calculates the dynamic viscosity based on the sphere’s velocity and the oil’s density. Experimental validation at particular temperature demonstrates the device’s sensitivity and reliability, which are critical for assessing oil degradation and engine performance. The simplicity and low cost of the design make it an attractive alternative to conventional, more complex viscometers. Furthermore, the automated data acquisition system reduces human error and enhances reproducibility of results. Overall, the developed instrument shows great promise for both laboratory research and practical maintenance applications in the automotive industry.

1. Introduction

Engine oil viscosity is a critical property that significantly influences the performance, durability, and efficiency of internal combustion engines. High-quality lubrication depends on the oil’s ability to maintain an adequate film thickness under varying operating conditions. Specifically, viscosity affects the formation of the hydrodynamic lubrication film, which minimizes friction and wear between moving components while ensuring smooth energy transfer and mechanical protection [1]. Accurate control and measurement of viscosity are therefore essential, as even slight deviations can lead to suboptimal performance, increased fuel consumption, and accelerated engine wear [1,2,3,4].
The appropriate viscosity not only provides a protective barrier between friction parts but also plays a crucial role in heat transfer within the engine, helping to dissipate excess thermal energy generated during combustion and friction processes [2]. Viscosity also influences the behavior of engine oil as it circulates through narrow pathways, seals, and bearing surfaces, where its ability to adapt under pressure and temperature changes is vital for preserving mechanical integrity [2,5]. Inadequate viscosity, whether too high or low, can compromise these critical functions; for instance, a lower-than-required viscosity may fail to form a robust lubricating film, while an excessively viscous oil can lead to higher friction losses and diminished engine efficiency [1,5]. Also, viscosity directly impacts the formation of deposits and sludge accumulation within the engine, affecting not only performance but also long-term reliability and maintenance intervals [6].
Furthermore, understanding oil viscosity is not only pivotal for engine protection but also for the development of next-generation lubricants that can accommodate stricter environmental and efficiency standards. Current research emphasizes the need for oils that maintain optimal viscosity over a wider temperature range, thereby ensuring consistent performance even under extreme operating conditions [7]. Such oils are critical in reducing energy losses, minimizing emissions, and extending engine life—a primary focus in today’s sustainable engineering challenges [7]. Therefore, the measurement and control of engine oil viscosity are not merely routine tasks in engine maintenance but are central to innovative approaches in engine design and environmental sustainability.
Over the years, a variety of techniques have been developed to measure dynamic and kinematic viscosity. Traditional methods include rotational viscometers, capillary viscometers, and falling-ball viscometers, each with their own advantages and limitations [3]. The falling-ball approach, based on the measurement of the time required for a sphere to travel a fixed distance within a fluid, has gained popularity due to its relative simplicity, cost-effectiveness, and accuracy when applied to Newtonian fluids such as engine oils [3,4]. With the increasing demands for precision in modern engine design and the rising complexity of lubrication systems, enhanced measurement techniques have become crucial. Recent advances in sensor technology and digital data acquisition have further improved the falling-ball method by facilitating automated measurement, reducing human error, and ensuring better repeatability in viscosity assessments [3,5]. These innovations have allowed researchers and engineers to obtain more accurate characterization of oil behavior under transient and steady-state conditions, which is essential for modeling engine dynamics and optimizing lubricant formulations [4,5].
Considering the above information the main purpose of the research is to present a custom-built viscosity measurement device that integrates the falling-sphere technique with a modern sensor system.

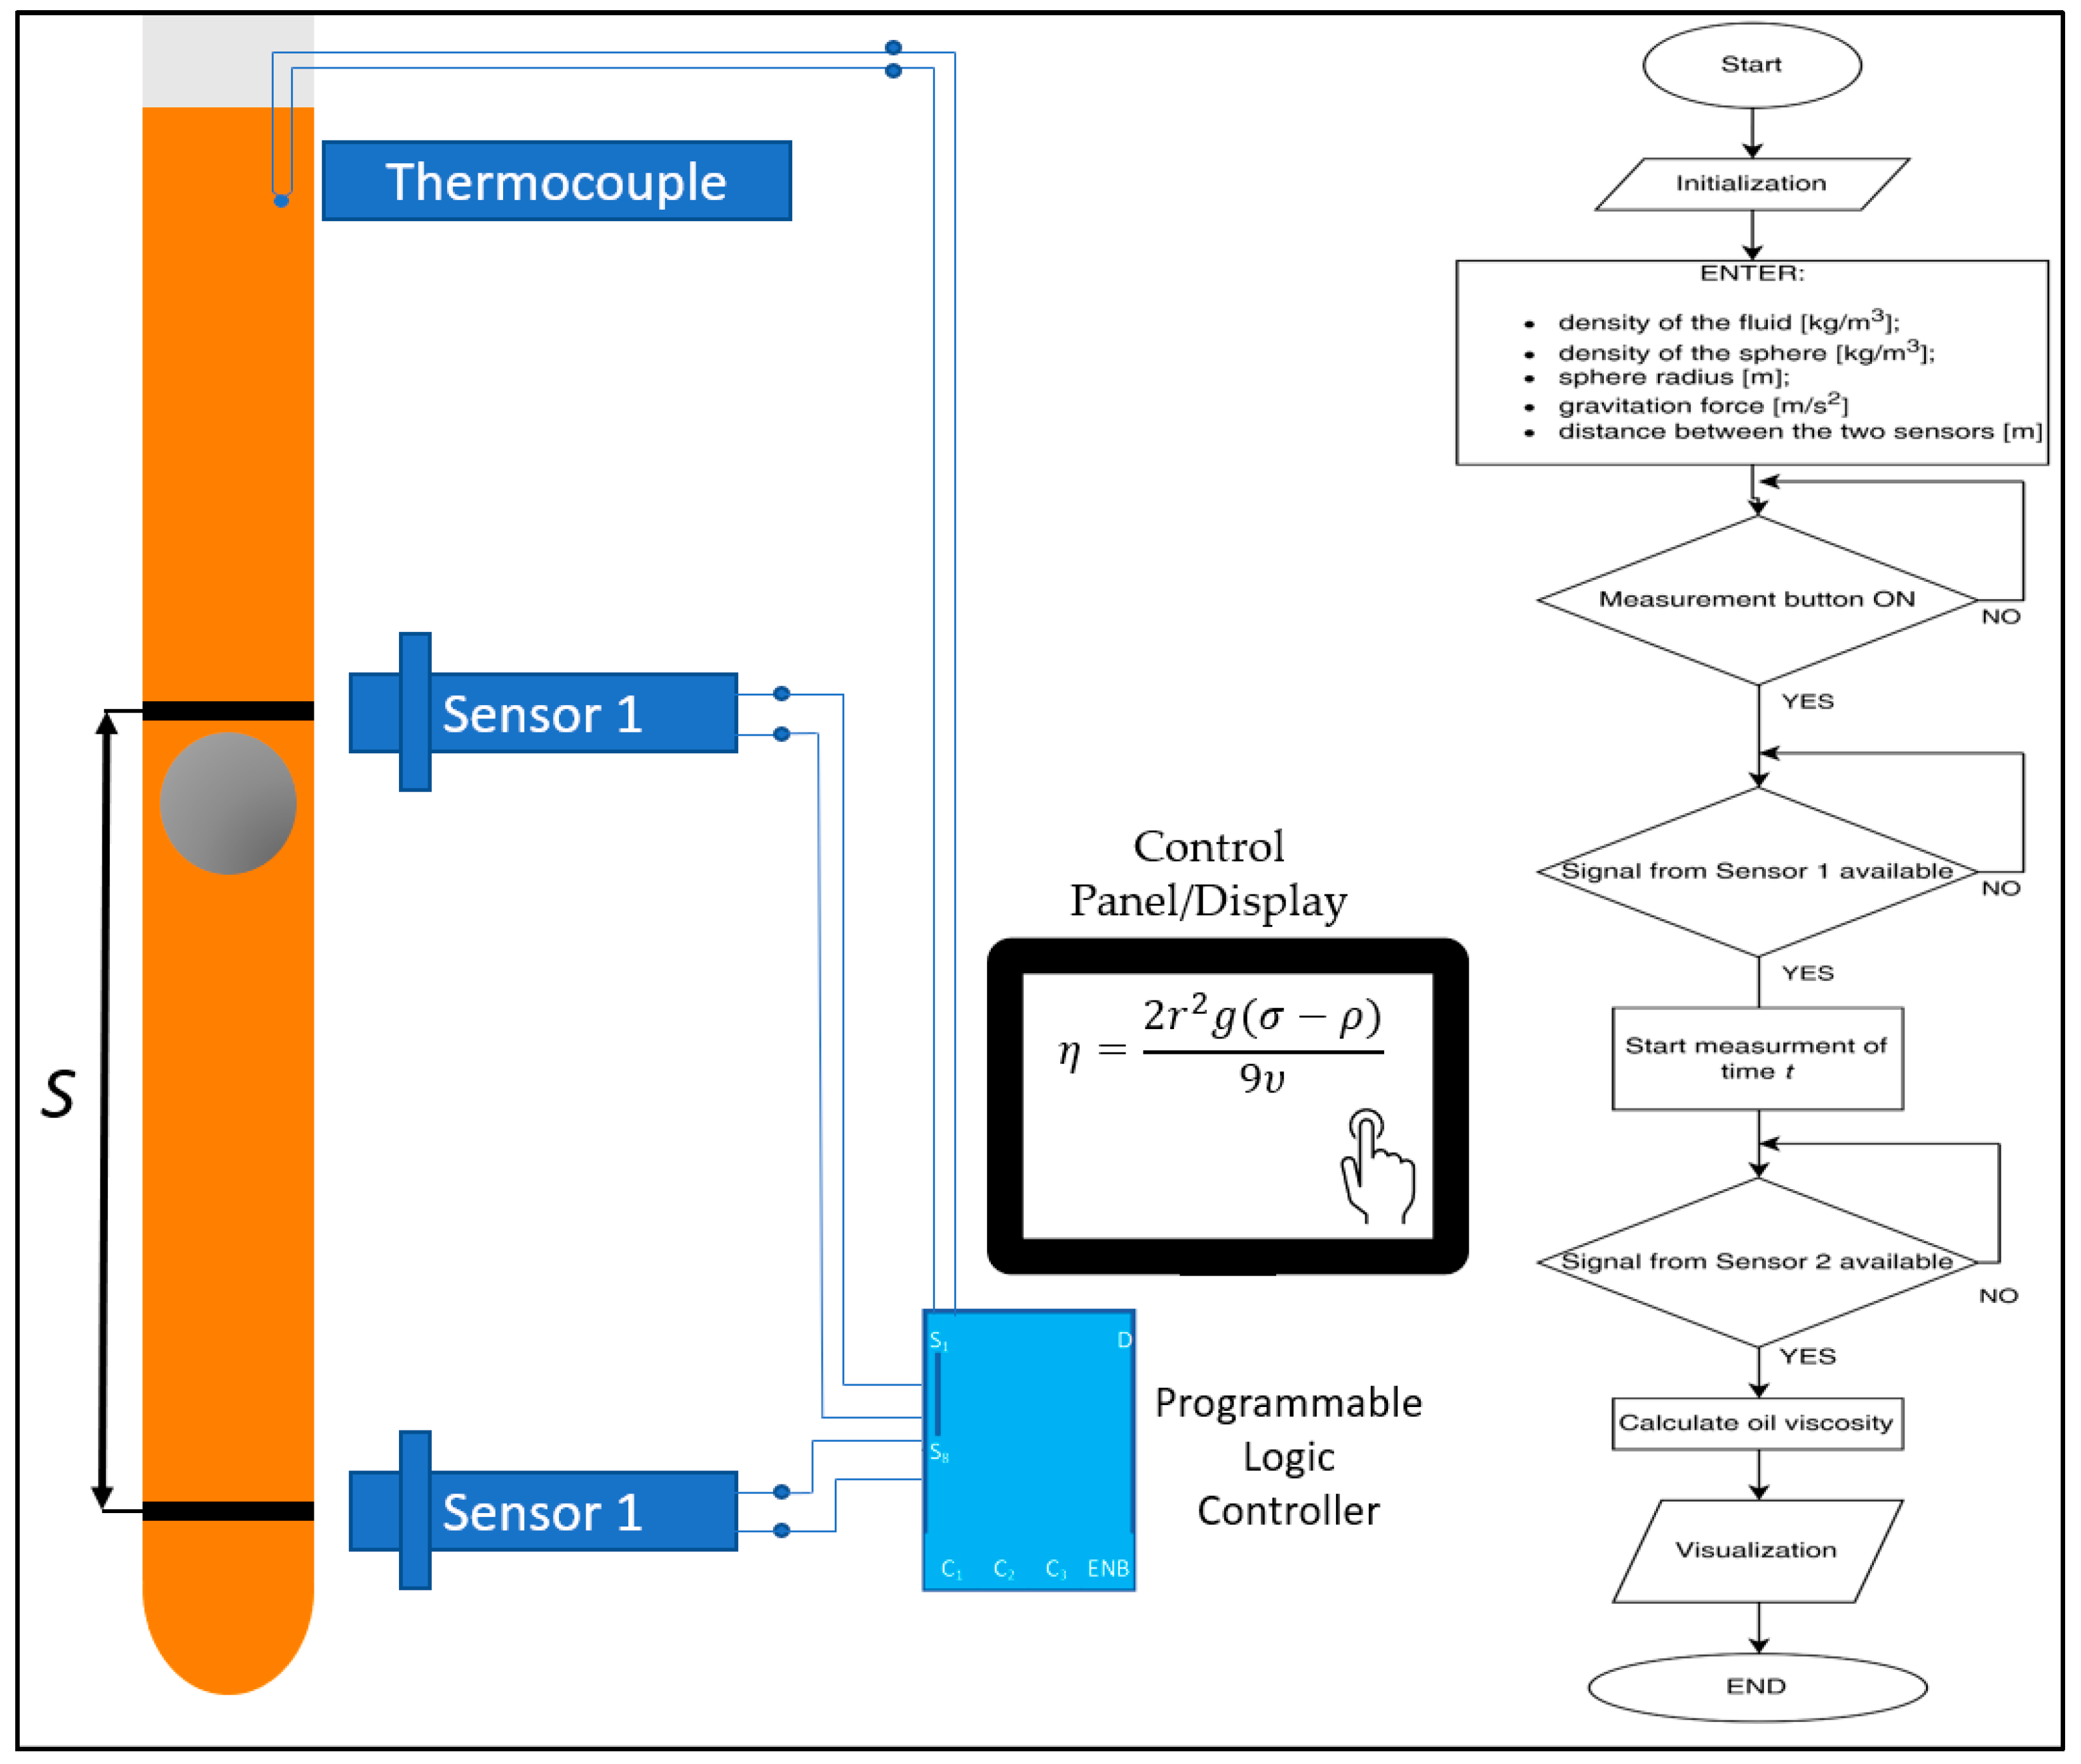
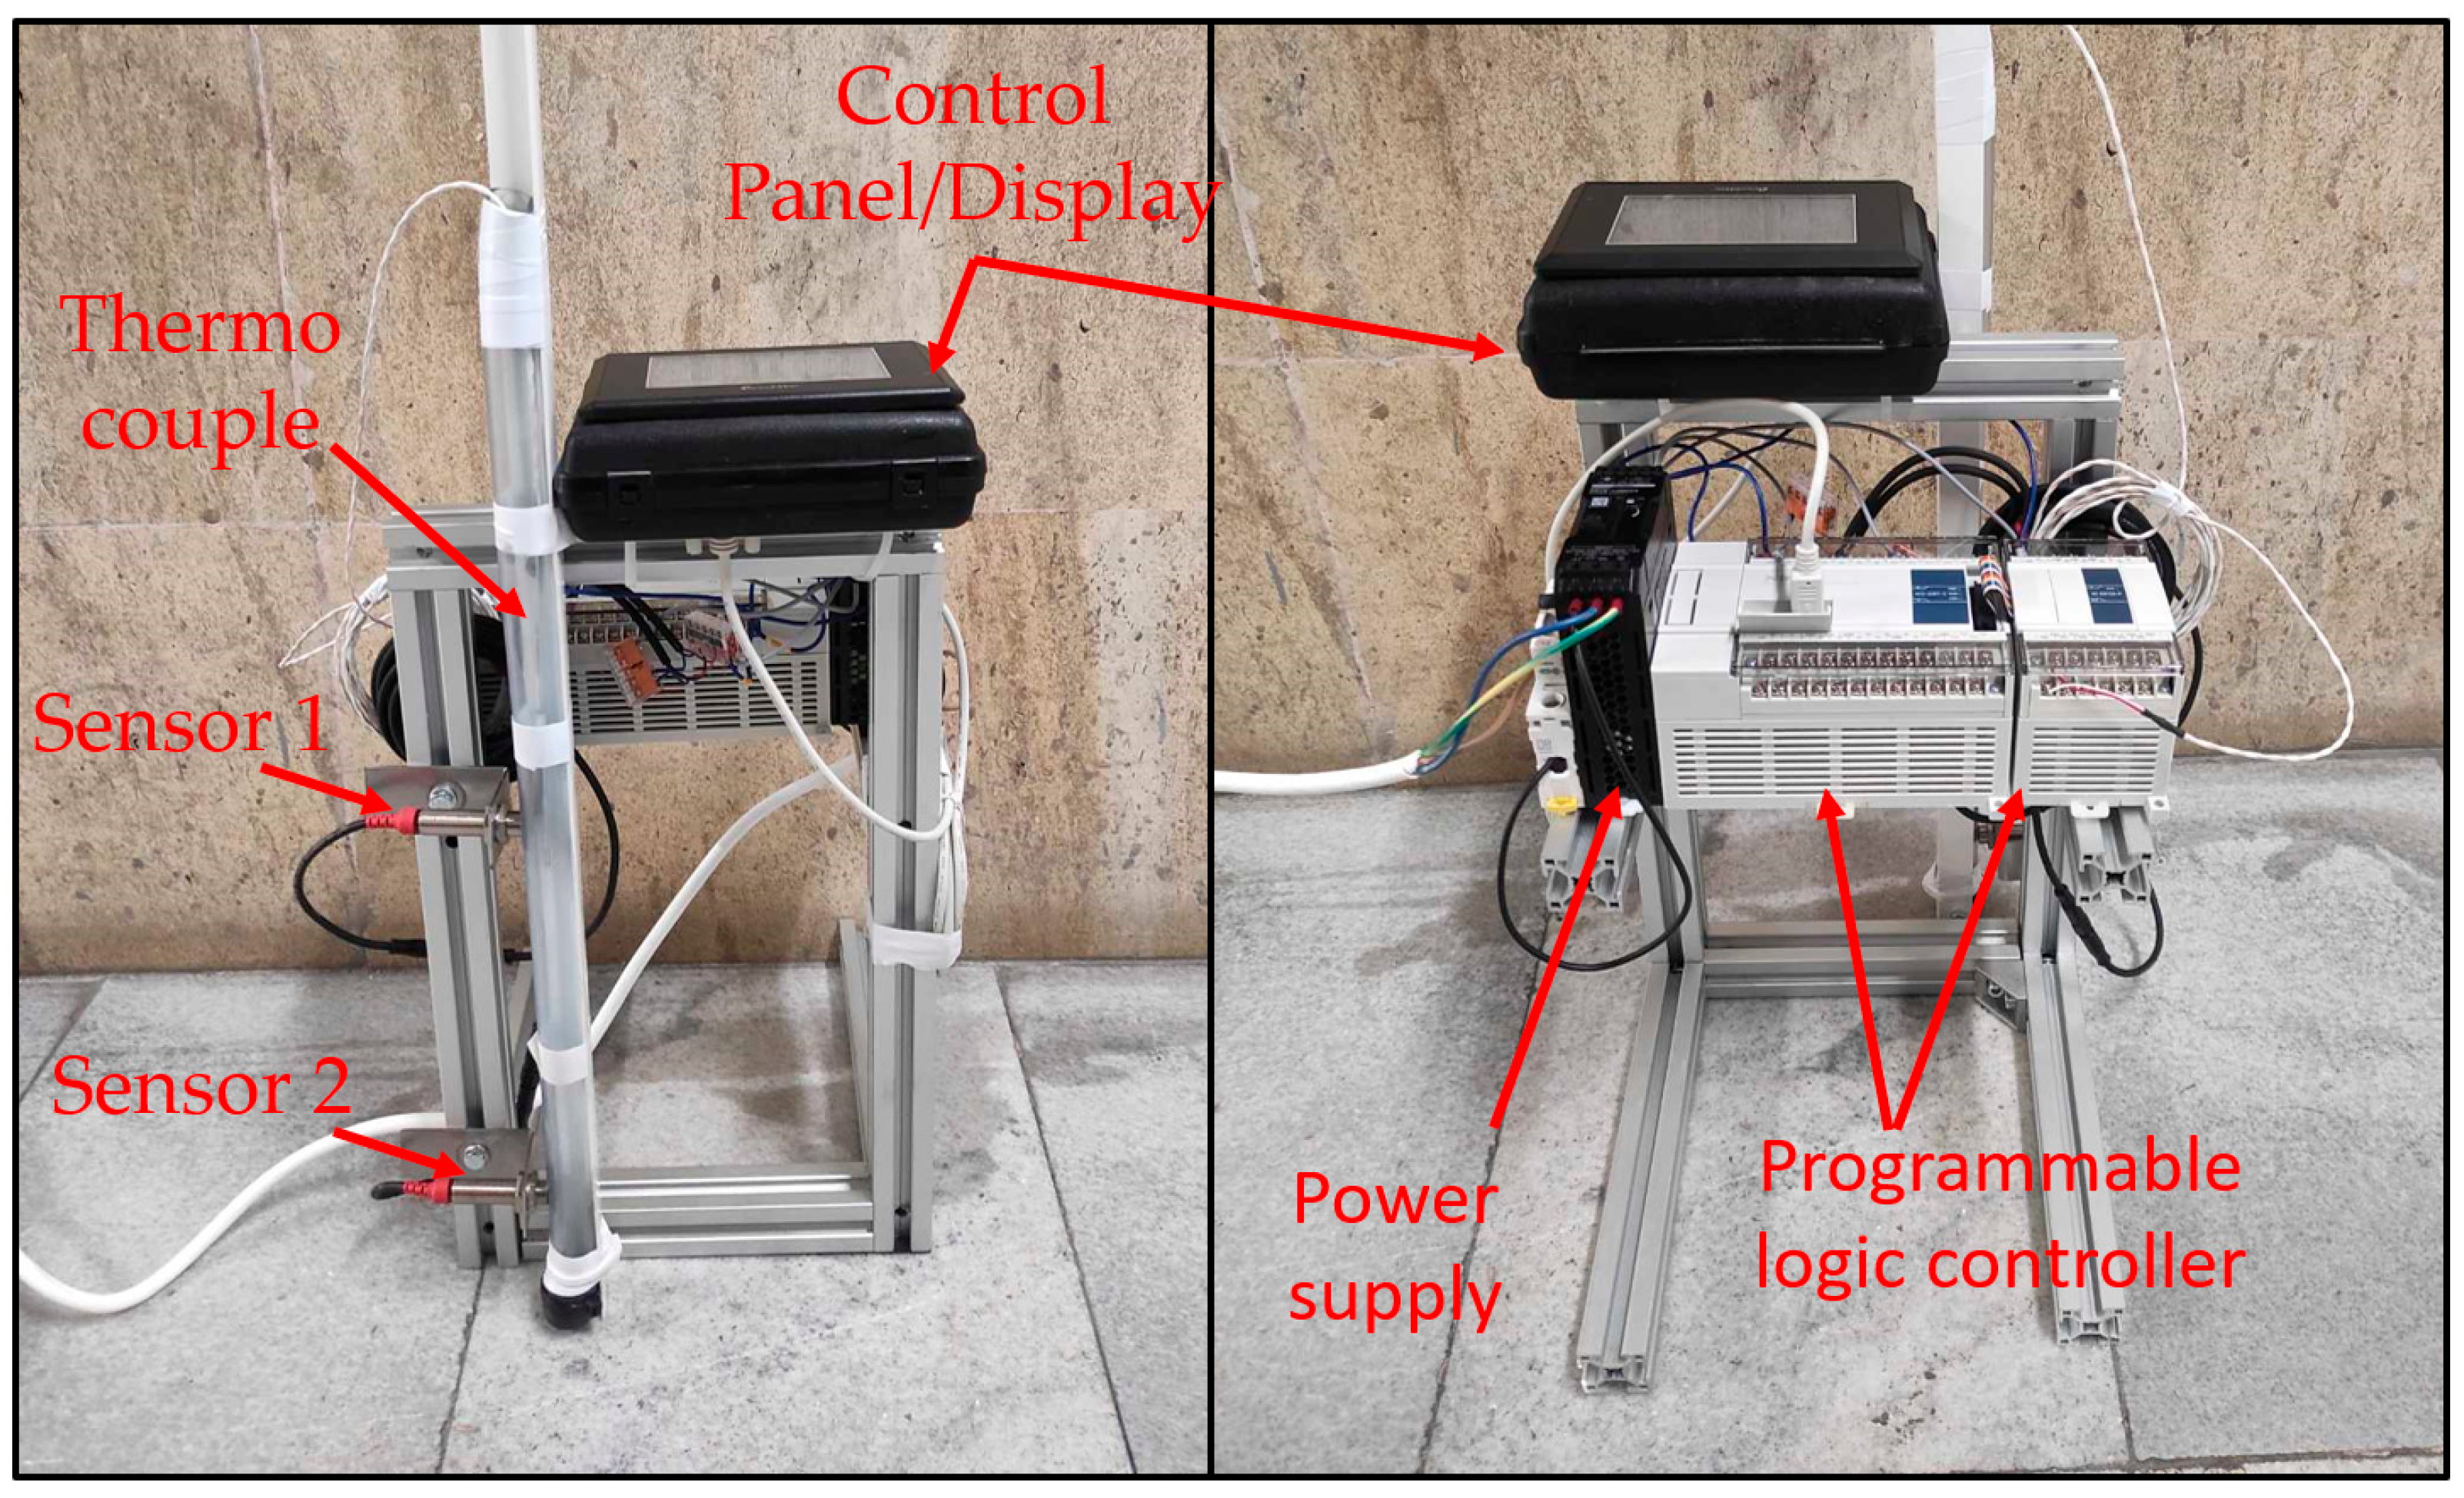
2. Materials and Methods

Figure 1 illustrates both the physical arrangement of the viscosity meter and the logical flow of the measurement process. On the left, a transparent, vertically oriented tube (shown in orange) contains the oil sample to be tested. Two sensors—labeled as Sensor 1 and Sensor 2—are positioned along the tube at a precisely measured distance S. When the measurement is initiated, a metallic sphere is released from above Sensor 1, allowing it to fall through the oil under the influence of gravity. This distance must ensure the sphere to reach constant speed.
Sensor 1, mounted nearer to the top, detects the passing sphere and sends a start signal to the controller, triggering an internal timer. As the sphere continues to fall, it approaches Sensor 2, positioned at a fixed distance below Sensor 1. When the sphere crosses Sensor 2, a stop signal is sent to the controller, halting the timer. By knowing the elapsed time and the distance S, the system calculates the average velocity v of the sphere in the stable portion of its descent, which is then used in the viscosity calculation via the Stokes’ law-based formula [8]:
6 π r η υ = 4 3 π r 3 σ ρ g
where η is the fluid viscosity [Pa.s], ρ—density of the fluid [kg/m3], σ—density of the sphere [kg/m3], r—radius of the sphere, g—gravitation force [m/s2], v—sphere velocity [m/s].
Equation (1) can be converted for the viscosity calculation:
η = 2 r 2 g ( σ ρ ) 9 υ , P a . s
The block diagram on the right side of Figure 1 highlights the functional sequence within the viscosity meter’s control system. At startup, the user must first enter key input parameters via a keyboard interface, including the oil density ρ [kg/m3], sphere density σ [kg/m3], sphere radius r [m], gravitational force g [m/s2], and the sensor-to-sensor distance S. Once these values are confirmed, the measurement process is initiated by pressing the measurement button. The controller monitors signals from the two sensors: when the sphere passes Sensor 1, the internal timer is activated; as the sphere passes Sensor 2, the timer is stopped. This information is used to calculate the time difference Δt.
After obtaining Δt, the controller computes the sphere’s velocity v = St. Using this velocity and the previously entered parameters, the controller solves the rearranged form of Stokes’ law to determine the oil viscosity. Finally, the result is displayed on a connected monitor or digital readout, providing the user with a direct, real-time measurement of the oil’s viscosity.
Overall, Figure 1 and Figure 2 underscore the combined hardware and software approach of the developed viscosity meter, highlighting how straightforward mechanical design and carefully integrated sensors can yield accurate, reproducible measurements in a user-friendly manner.

3. Results and Discussions

The developed viscosity meter demonstrated a number of advantages during preliminary testing, confirming the robustness and practicality of the sensor-based falling-sphere approach for engine oil viscosity measurements. The modular design of the instrument offers several clear benefits:
  • Clear visualization: The vertical layout of the apparatus allows for straightforward adjustments when changing the sphere or the fluid medium. This configuration facilitates rapid reconfiguration in laboratory setups, making it simple to test different oil samples or modify experimental parameters.
  • Automated timing: by using sensors to automatically trigger timing events (i.e., starting the timer as the sphere passes sensor 1 and stopping it at sensor 2), the system minimizes human error. This automated approach ensures high repeatability in measurements, which is critical for both research and diagnostic applications.
  • User-friendly interface: The intuitive controller interface, combined with a simple measurement button sequence, enables users to easily switch between different oil samples or operational conditions. This feature not only improves usability but also reduces the need for extensive operator training.
  • Immediate feedback: Real-time display of the calculated viscosity on the digital panel allows for rapid assessment of the oil’s properties. This immediate feedback is particularly beneficial in maintenance contexts, where quick decision-making is required.
The discussion also highlighted the following points:
  • Measurement accuracy: The overall accuracy of the developed viscosity meter is highly dependent on the precision of several key input parameters. These include the accurate determination of the fluid’s density, the density and radius of the falling sphere, and the exact measurement of the distance between the two sensors. A deviations in any of these parameters can lead to errors in the calculated viscosity values. Therefore, special attention must be paid to ensuring the reliability and repeatability of all dimensional and material property inputs used in the calculation process.
  • Data integration: The integration of the falling-ball method with digital sensor technology provides an effective way to reduce human error and improve overall data reliability. This is essential for applications in which oil degradation needs to be tracked over time.
  • Potential for future improvements: Future iterations of the device could incorporate advanced data processing algorithms to further refine the measurement accuracy, especially under transient conditions.

4. Conclusions

This article presents the development of a custom-built viscosity measurement device that integrates the falling-sphere technique with a modern sensor system. In the proposed setup, a metallic sphere is released into a transparent, vertically oriented tube filled with engine oil. Two sensors, precisely placed along the tube, capture the sphere’s transit time between predetermined positions, enabling the calculation of its average velocity [4]. Combined with the known densities of the sphere and the fluid, these measurements are used to compute the dynamic viscosity via established fluid dynamic principles, including modifications to Stokes’ law.
The novelty of the developed apparatus is underscored by its straightforward design, ease of replication, and adaptability for both laboratory research and field applications. Unlike many commercial viscometers—which often necessitate extensive calibration and complex control systems—this device offers an accessible and reliable alternative with minimal maintenance requirements. Its capability to monitor viscosity changes under different thermal conditions also provides valuable insights into the behavior of engine oils during both normal operation and degradation processes. Moreover, the automated sensor system significantly reduces human error, enhancing the reproducibility of the measurements and ensuring consistent data quality.

Author Contributions

Conceptualization, A.T.; methodology, A.T.; validation, Y.S. and P.M.; data curation, P.M.; writing—original draft preparation, Y.S., A.T. and P.M.; writing—review and editing, P.M., Y.S. and A.T. All authors have read and agreed to the published version of the manuscript.

Funding

This research was funded by the European Regional Development Fund within the OP “Research, Innovation and Digitalization Programme for Intelligent Transformation 2021–2027”, Project No.BG16RFPR002-1.014-0005 Center of competence “Smart Mechatronics, Eco- and Energy Saving Systems and Technologies”.

Institutional Review Board Statement

Not applicable.

Informed Consent Statement

Not applicable.

Data Availability Statement

No new data were created or analyzed in this study. Data sharing is not applicable to this article.

Conflicts of Interest

The authors declare no conflicts of interest.

References

  1. Garcia Tobar, M.; Pinta Pesantez, K.; Jimenez Romero, P.; Contreras Urgiles, R.W. The Impact of Oil Viscosity and Fuel Quality on Internal Combustion Engine Performance and Emissions: An Experimental Approach. Lubricants 2025, 13, 188. [Google Scholar] [CrossRef]
  2. Abou-Ziyan, H.Z. Heat transfer characteristics of some oils used for engine cooling. Energy Convers. Manag. 2004, 45, 2553–2569. [Google Scholar] [CrossRef]
  3. Tormos, B.; Ramirez, L.; Johansson, J.; Bjorling, M.; Larsson, R. Fuel consumption and friction benefits of low viscosity engine oils for heavy duty applications. Tribol. Int. 2017, 110, 23–24. [Google Scholar] [CrossRef]
  4. Hei, D.; Zheng, M.; Liu, C.; Jiang, L.; Zhang, Y.; Zhao, X. Study on the frictional properties of the top ring-liner conjunction for different-viscosity lubricant. Adv. Mech. Eng. 2023, 15. [Google Scholar] [CrossRef]
  5. Blanco-Rodriguez, J.; Simon-Montero, X.; Cortada-Garcia, M.; Maroto, S.; Portiero, J. Modelling the impact of reducing lubricant viscosity on a conventional passenger car fuel economy and wear protection. Results Eng. 2024, 24, 103159. [Google Scholar] [CrossRef]
  6. Basu, A.; Berndorfer, A.; Buelna, C.; Campbell, J.; Ismail, K.; Lin, Y.; Rodriguez, L.; Wang, S.S. “Smart sensing” of Oil Degradation and Oil Level Measurements in Gasoline Engines. SAE Int J Fuels Lubr. 2000, 109, 857–863. [Google Scholar] [CrossRef]
  7. Garcia Tobar, M.; Cabrera Ojeda, O.; Crespo Montaño, F. Impact of Oil Viscosity on Emissions and Fuel Efficiency at High Altitudes: A Response Surface Methodology Analysis. Lubricants 2024, 12, 277. [Google Scholar] [CrossRef]
  8. Dabir, V.; Ghosh, T.; Prasad, D.; Dutt, N.; Reni, K. Viscosity of Liquids; Springer: Dordrecht, The Netherlands, 2007; ISBN 10-1-4020-5481-5. [Google Scholar]
Figure 1. Schematics view and block diagram of the developed oil viscosity meter.
Engproc 100 00055 g001
Figure 2. Physical appearance of the oil viscosity meter.
Engproc 100 00055 g002
Disclaimer/Publisher’s Note: The statements, opinions and data contained in all publications are solely those of the individual author(s) and contributor(s) and not of MDPI and/or the editor(s). MDPI and/or the editor(s) disclaim responsibility for any injury to people or property resulting from any ideas, methods, instructions or products referred to in the content.

