Proceeding Paper

Finite-Element and Experimental Analysis of a Slot Line Antenna for NV Quantum Sensing †

by
Dennis Stiegekötter
1,*,
Jonas Homrighausen
2,
Ann-Sophie Bülter
1,
Ludwig Horsthemke
1,
Frederik Hoffmann
1,
Jens Pogorzelski
1,
Peter Glösekötter
1 and
Markus Gregor
2
1
Department of Electrical Engineering and Computer Science, FH Münster—University of Applied Sciences, Stegerwaldstr. 39, 48565 Steinfurt, Germany
2
Department of Engineering Physics, FH Münster—University of Applied Sciences, Stegerwaldstr. 39, 48565 Steinfurt, Germany
*
Author to whom correspondence should be addressed.
Presented at the 11th International Conference on Time Series and Forecasting, Canaria, Spain, 16–18 July 2025.
Eng. Proc. 2025, 101(1), 9; https://doi.org/10.3390/engproc2025101009
Published: 30 July 2025

Abstract

Nitrogen vacancy (NV) diamonds are promising room temperature quantum sensors. As the technology moves towards application, efficient use of energy and cost become critical for miniaturization. This work focuses on microwave-based spin control using the short-circuited end of a slot line, analyzed by finite element method (FEM) for magnetic field amplitude and uniformity. A microstrip-to-slot-line converter with a 10 dB bandwidth of 3.2 GHz was implemented. Rabi oscillation measurements with an NV microdiamond on a glass fiber show uniform excitation over 1.5 MHz across the slot, allowing spin manipulation within the coherence time of the NV center.

1. Introduction

Electron spin states of diamonds doped with nitrogen vacancies can be manipulated by microwave irradiation. The magnetic field component of the microwave is used for this as soon as its frequency resonates with the Larmor precession of the electron spins. In the simplest case, the coupling of microwaves can be achieved by a conductor loop. However, the radiation of the microwave outside a very narrow band resonance of the conductor loop is low and inefficient. In general, there is some research on the development of resonators for nitrogen vacancy (NV) centers with the focus on achieving a large bandwidth of resonance with a homogeneous magnetic field distribution in the mm2 range [1,2,3,4,5], which are designed for large 3 × 3 mm diamond slabs. For small diamonds in the micrometer range, O. R. Opaluch et al. [6] have developed a broadband Ω -shaped antenna, which is coated as a gold layer on borosilicate glass. An antenna that can be fabricated by printable circuit board (PCB) manufacturers is of greater interest for applications and industry because of the low cost and the ability to integrate antennas directly into electronics. Slotted lines from high-frequency engineering fulfill these requirements, but are used for signal transmission and have not been studied for the excitation of electron spins. Therefore, in this work, a slot line is examined for its alternating magnetic field Bac of the microwave. Microstrip lines have already been used [7], but have the disadvantage that the field lines of the magnetic field are concentrated in the substrate. In the slot line, the signal and ground layer are planar on the opposite of each other and separated by a slot. The concentration of the magnetic field lines is highest in the slot and easily accessible to microdiamonds.

2. The NV Center

The nitrogen-vacancy center is a point defect in the diamond crystal structure where two adjacent carbon atoms have been substituted by a nitrogen atom and a vacancy. Due to the tetrahedral arrangement of the carbon atoms, the NV center can be oriented in four different directions. Overall, the NV center can have a positive, a negative or a neutral charge state. Only the negatively charged NV center is of interest, as it holds a spin triplet in the ground state with two unpaired electrons. The energy diagram of the NV center is divided into the ground state 3A, the excited state 3E and the singlet states 1A, 1E. The ground state and the excited state are split further in the spin states m s = ± 1 and m s = 0 . The energy transition from the ground state 3A to the excited state 3E can be achieved by off-resonant excitation with laser light at a wavelength of 520 nm. Photons are emitted from the NV center as soon as the electron spins decay back to the ground state. This process is spin-conserving [8,9]. However, the decay can also take place via the singlet states 1A, 1E. The probability of this singlet state decay path is greater for electrons that are in the m s = ± 1 state. The path via the singlet state does not generate photons in the visible range, resulting in an optical contrast between the paths of the m s = ± 1 and the m s = 0 spin state. At the same time, this process is not spin-preserving and the electron spins are polarized to the m s = 0 state. An alternating magnetic field Bac applied perpendicular to one of the NVi axis and matching the Larmor frequency of the electron spins flips the electron spins between the m s spin states. Optical pumping with a green laser results in two optically visible resonances around 2.87 GHz at a frequency sweep of the microwave, called zero-field splitting (ZFS). An external static magnetic field parallel to the NV axis leads to a Zeeman splitting of the m s = + 1 and m s = 1 electron spin. With four possible orientations of the NV axes, there are eighth visible resonances of the NV ensemble in the fluorescence possible. The detection method of resonances with a sweep of the microwave is called optical detection of magnetic resonances (ODMR).

3. Slot Lines for NV Centers

There are few to no commercial solutions in the form of connectors, couplers or similar for connecting slot lines to microwave networks. Another problem is the hight waveguide impedance that arises on substrates with a low dielectric constant in the frequency range around the ZFS of NV centers. Usually the coupling to a 50 Ω network is achieved via microstrip lines. In research on high frequency applications, some taper structures are designed by analytical formulas based on conformal mapping [10,11,12]. Alternatively λ / 4 stubs are used in a back-to-back arrangement [13,14,15], a configuration also found in the literature [16]. For our investigation, the proposed design by W. Tu and K. Chang [17] offers the most attractive solution for substrates with a low dielectric constant ϵ r . There are established formulas for calculation for each of the sections shown in Figure 1. The structure shown in Figure 1 refers to a 0.5 mm slot line on flame retardant (FR4) ϵ r = 4.5 substrate with a thickness of 1.5 mm and can be divided into four segments. Section S1 is a three-stage λ / 4 transformer in microstrip technology, which is used for broadband matching of the 50 Ω feedline to the coplanar strips (CPS), with λ as the wavelength of the propagating microwave. The distribution of the electric and magnetic field lines generate a quasi-transverse electromagnetic (TEM) mode. The required waveguide impedances Z 1 , Z 2 and Z 3 of the transformer segments 56 Ω , 78 Ω and 110 Ω are calculated using Equation (2) [18]. Hammerstad’s synthesis [19] is used to determine the width of the microstrip line from the waveguide impedance and the substrate thickness. The length of the λ / 4 sections at 2.87 GHz is determined from the effective dielectric constant from [19] with:
L λ / 4 = 1 4 c 2.87 GHz ϵ Eff
Z 1 = Z L Z 0 7 8 , Z 2 = Z L Z 0 , Z 3 = Z 0 Z L 7 8
In section S2, a radial stub stretches at an angle α to the microstrip line and serves as a virtual short. As a result, the stub and the GND plane are at the same potential and the electric field lines are coupling over. The transmission of the microwave in section S3 continues on coplanar strips without a GND plane in odd transmission. The characteristic waveguide impedance of the CPS can be calculated using the equations from F. Darwis et al. [20]. In the last section S4, the CPS are transformed to the slot line via a taper with the angle ϕ . For a ratio 0.0015 W / h 0.075 and a dielectric constant 3.8 ϵ r 9.8 with W as the slot width, h as the substrate thickness, and λ 0 as the free space wavelength, Equation (3) is used for impedance calculation [16].
Z 0 s = 73.6 2.15 ϵ r + ( 638.9 31.37 ϵ r ) ( W / λ 0 ) 0.6 + 36.23 ϵ r 2 + 41 225 W / h W / h + 0.876 ϵ r 2 + 0.51 ( ϵ r + 2.12 ) ( W / h ) ln ( 100 h / λ 0 ) 0.753 ϵ r ( h / λ 0 ) / W / λ 0
This equation is determined empirically by curve fitting numerical results with Galerkin’s method. Exact details about the derivation can be found in the work of Janaswamy and Schaubert [21].

4. Simulations

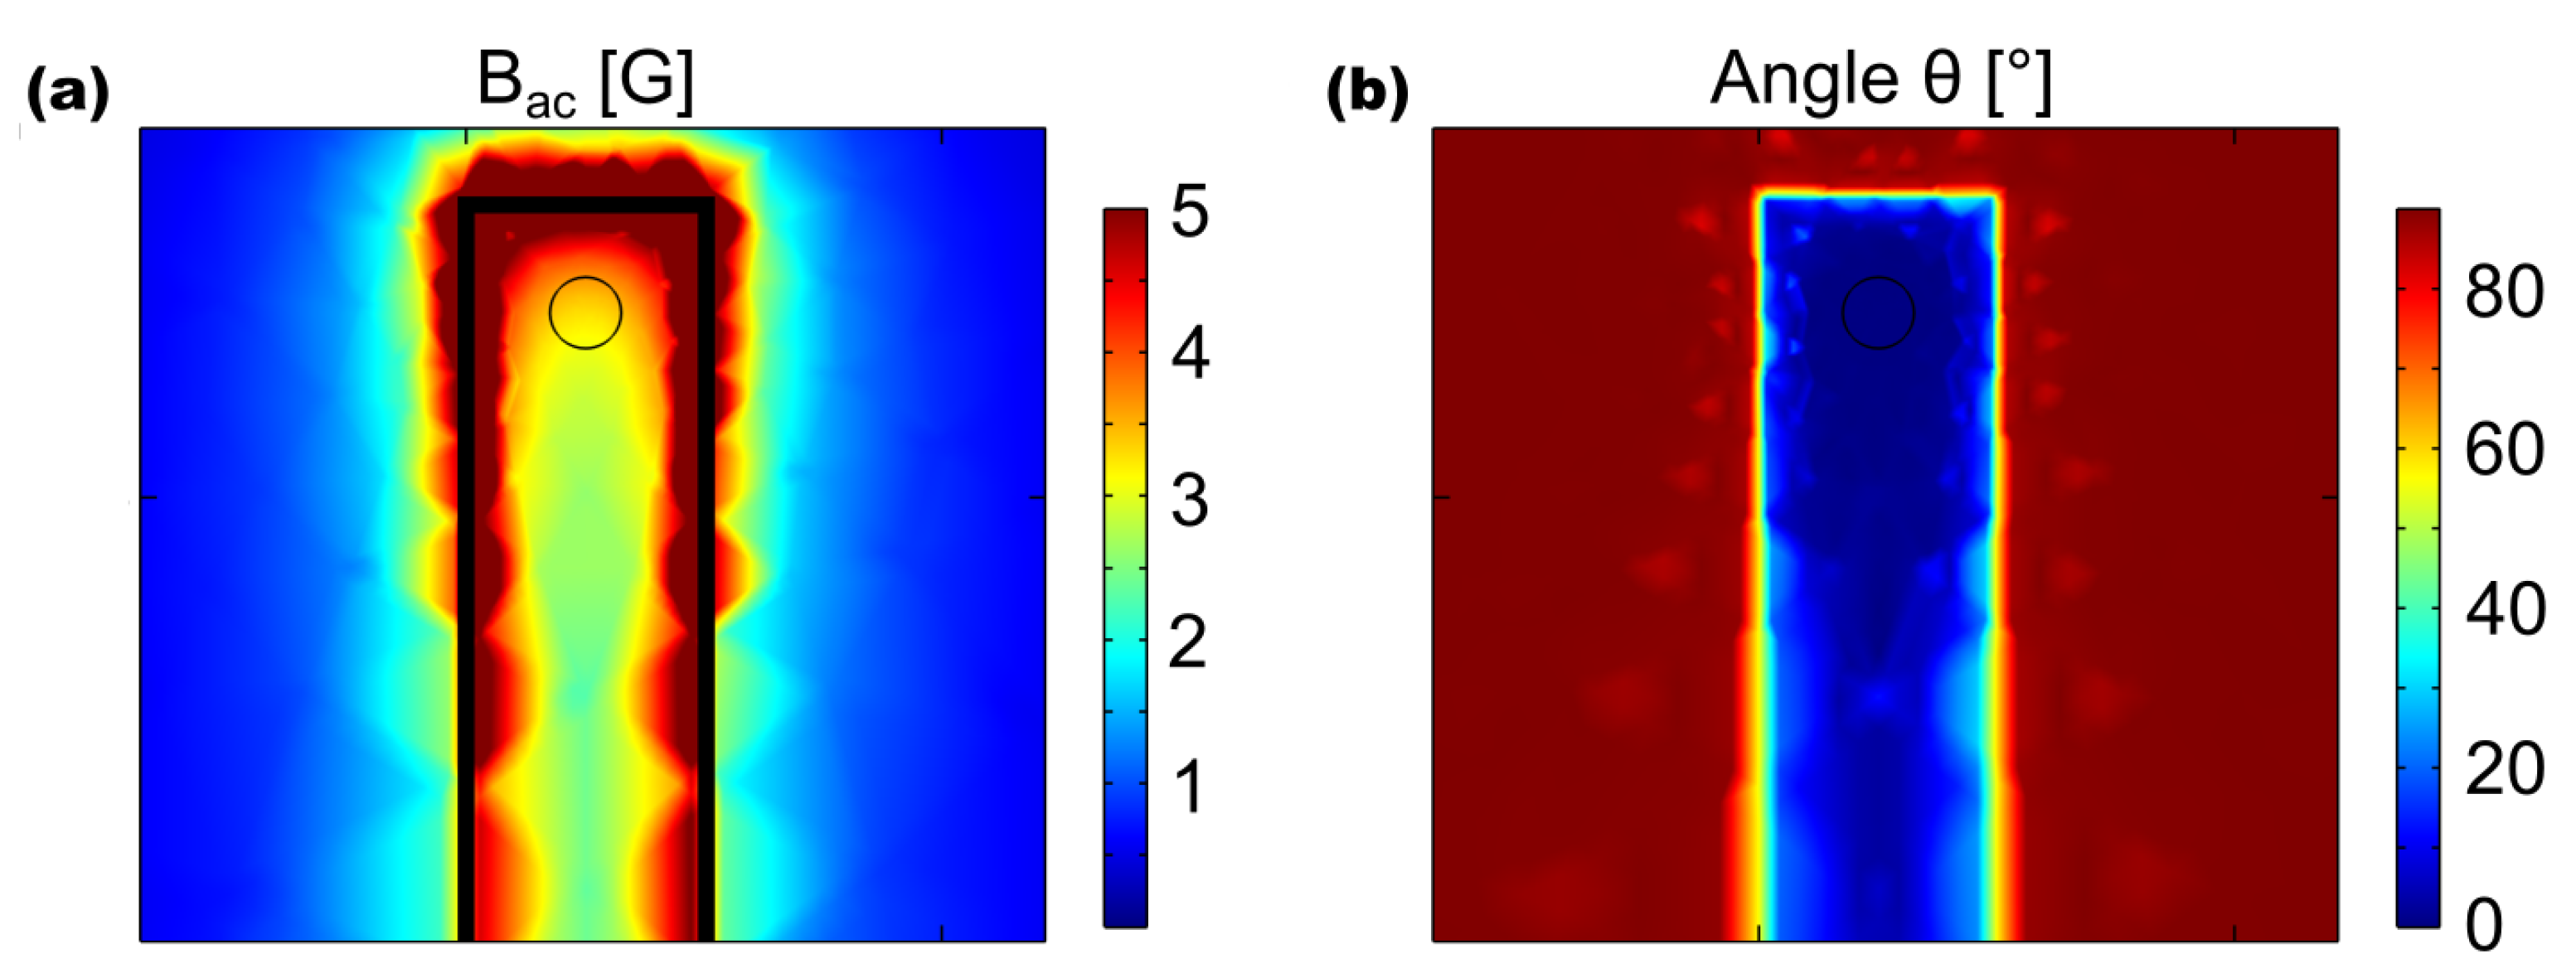
A finite element method (FEM) (Comsol) based approach is chosen for the simulation of a slot line model. The model is a short-circuited slot line with a slot length of 18.6 mm and a slot width of 0.5 mm. The slot is terminated at the end with a 10 mm long copper surface. The copper layer is 35 μm thick, 20.5 mm wide and has a total length of 28.6 mm. The substrate below the copper layer is FR4 with a dielectric constant ϵ r = 4.5 and a height of 1.5 mm that corresponds to the core thickness of a standard 1.6 mm PCB with two layers. Using the Equation (3), a waveguide impedance of 92 Ω is calculated from these values, to which the network port for feeding in the microwaves is set. Figure 2a shows the intensity distribution at a frequency of 2.87 GHz and a power of 30 dBm as the magnitude of the magnetic flux Bac according to Equation (4). The distribution shown in Figure 2a is simulated at the height of the copper plane and shows the largest amplitude at the edges of the slot. The sketched circle represents the cross-sectional area of an example NV diamond with a diameter of 150 μm. Within this area, the magnetic flux is on average 3.3 G and is therefore comparable with other antennas [1].
Figure 2b shows the corresponding angle θ of the alternating magnetic field. The angle θ defines the deviation of the z component B ac , z from the magnitude vector Bac and is calculated according to Equation (4) [1].
B ac = B ac , x 2 + B ac , y 2 + B ax , z 2 θ = arccos B ac , z B ac
In the first 10 mm within the slot, the deviation θ is mostly less than 10°. The mean angle within the diamond circle area corresponds to only 2°. Towards the edges, the homogeneity decreases and an increasingly inhomogeneous, spot-like structure emerges. This indicates stronger field variations and possible interference effects that lead to a turbulent or swirling distribution. A parametric sweep is carried out to investigate the effects of the slot width on the intensity of Bac and the angle θ. In addition to the width, the impedance of the network port must be matched and the length of the slot must be adjusted to λ/4 at 2.87 GHz. A sphere with a diameter of 150 μm is used as a diamond model for the measurement. The material of the sphere is carbon with a relative permeability of μ r = 1 and an electrical conductivity σ = 10 10 S / m and is located in the center of the slot at a distance of half the slot width to the short circuit. In the z direction, the sphere equator is aligned with the copper plane. The volume average of the diamond model is calculated using Equation (4) for Bac and θ. Figure 3 shows an exponential dependence of flux density and angle, both of which decrease with increasing slot width. This leads to a trade-off that must be selected depending on the requirements.

5. Setup and Measurement

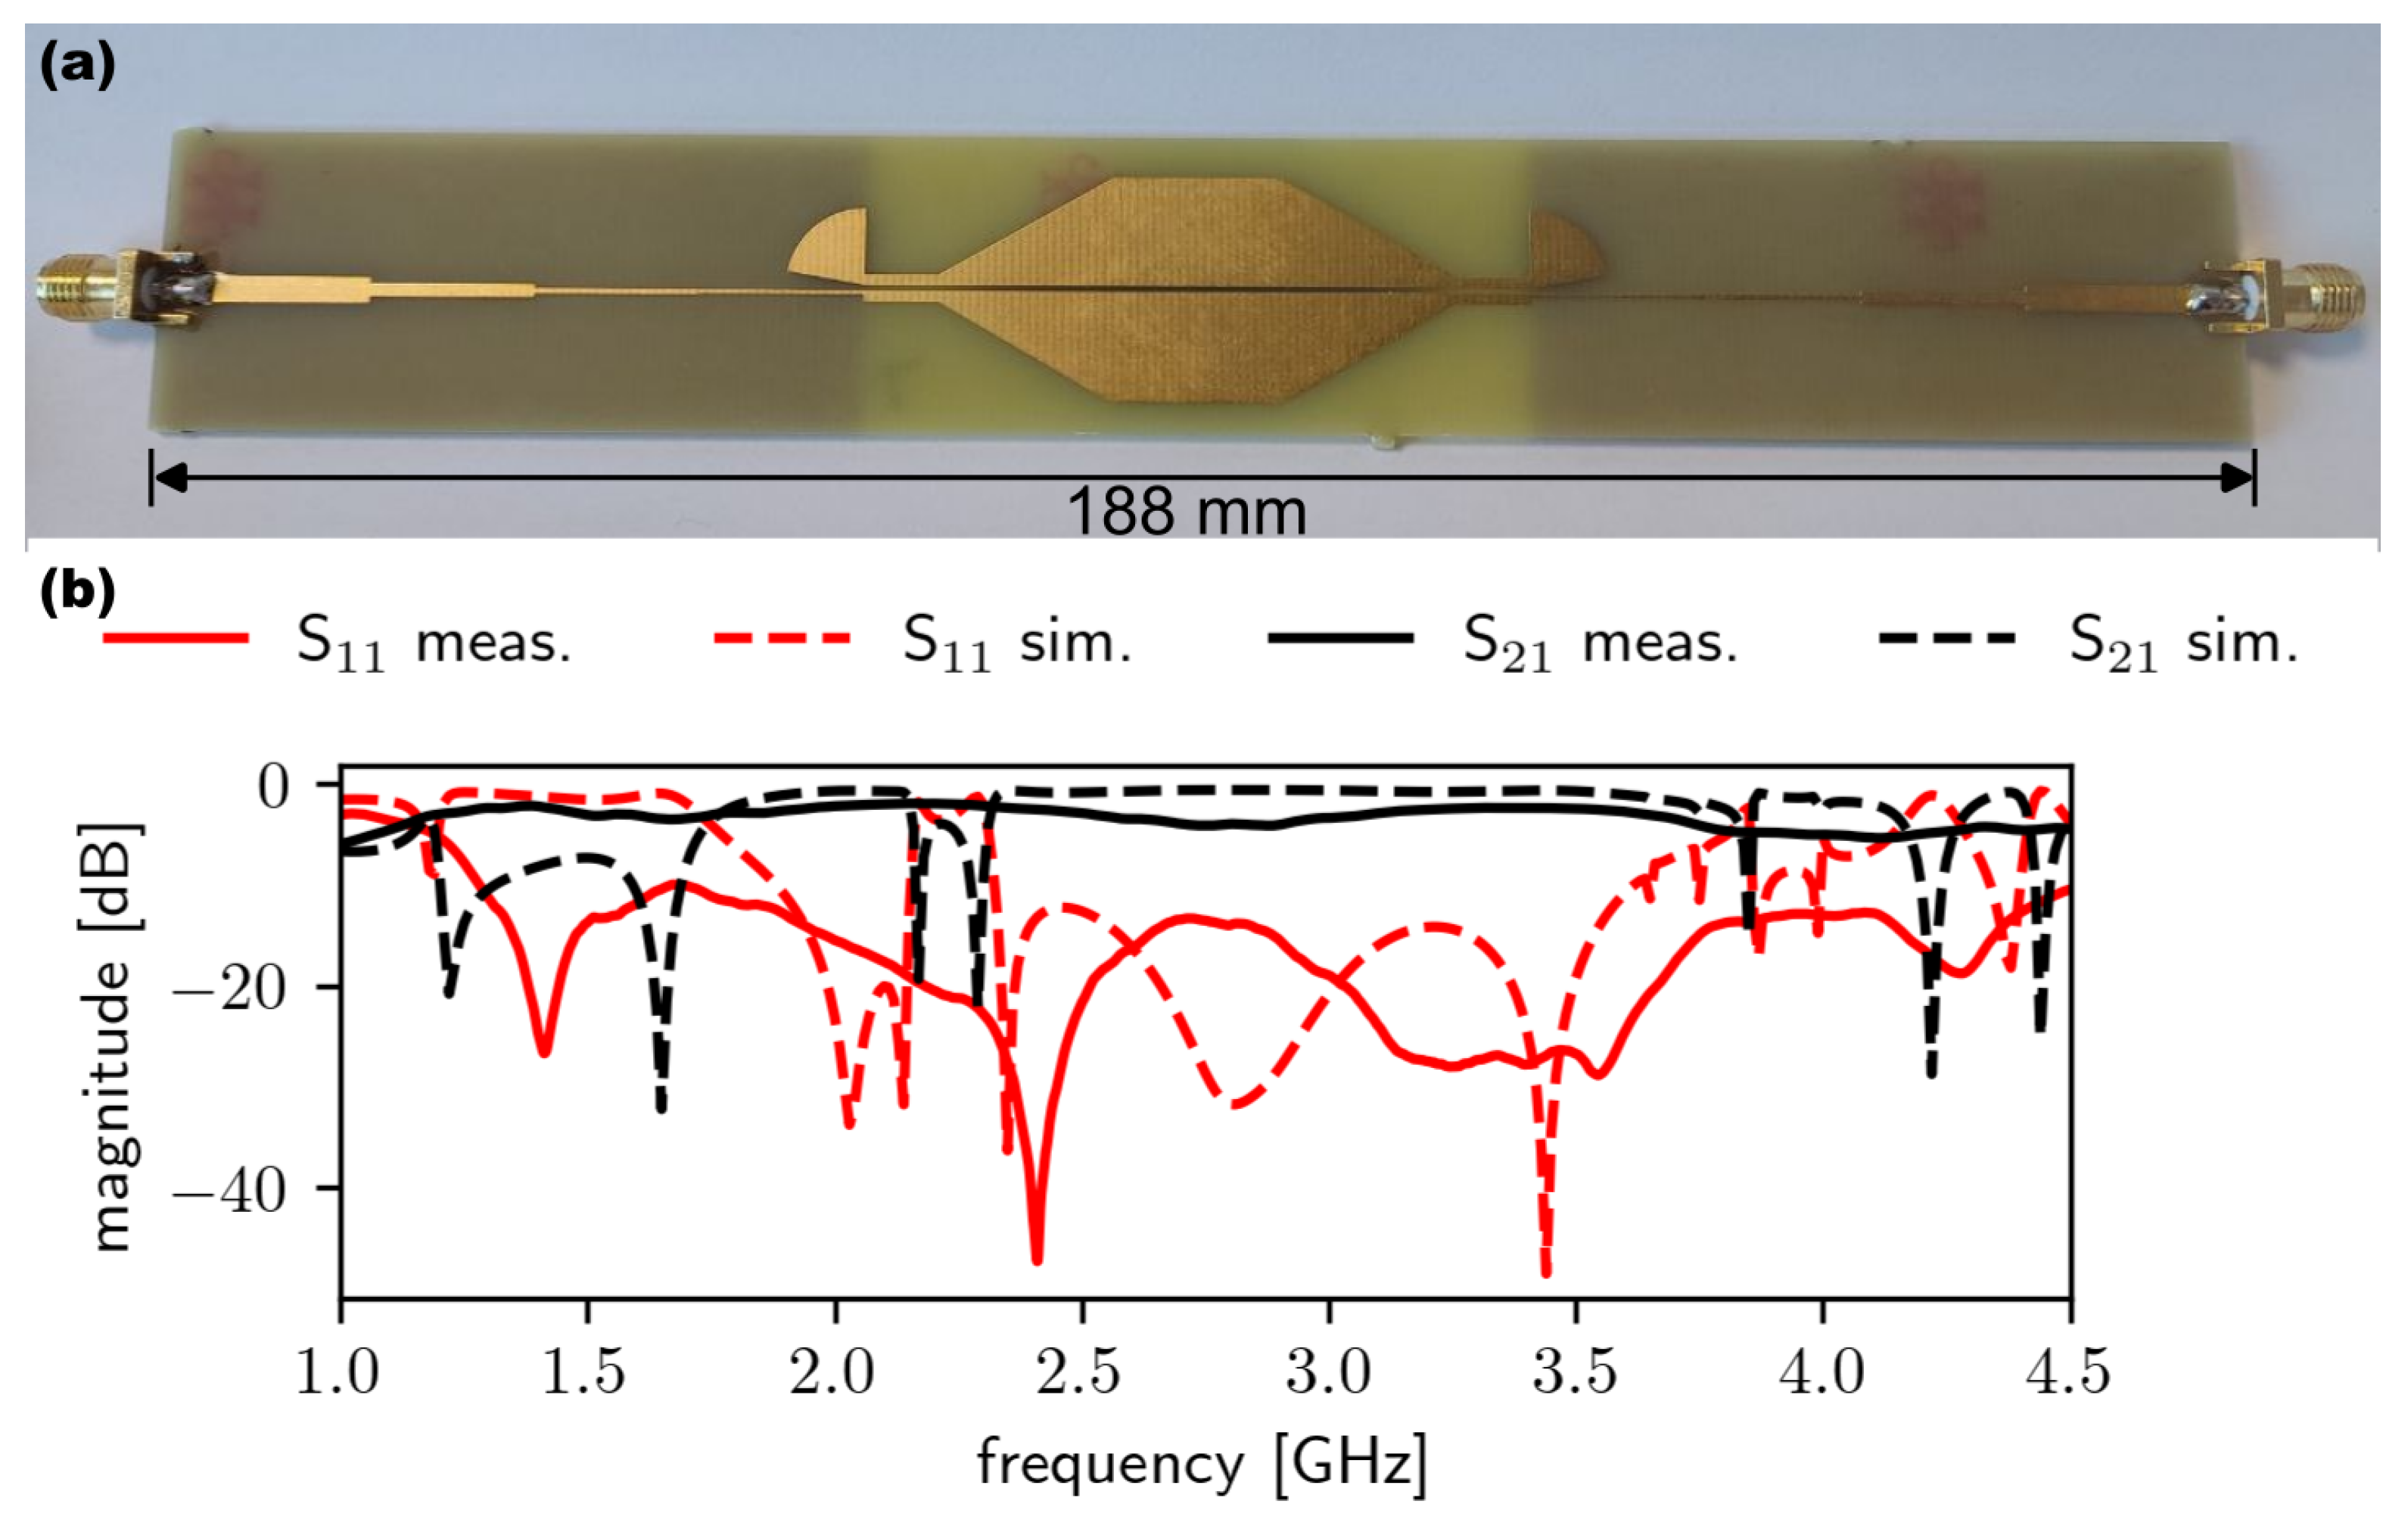
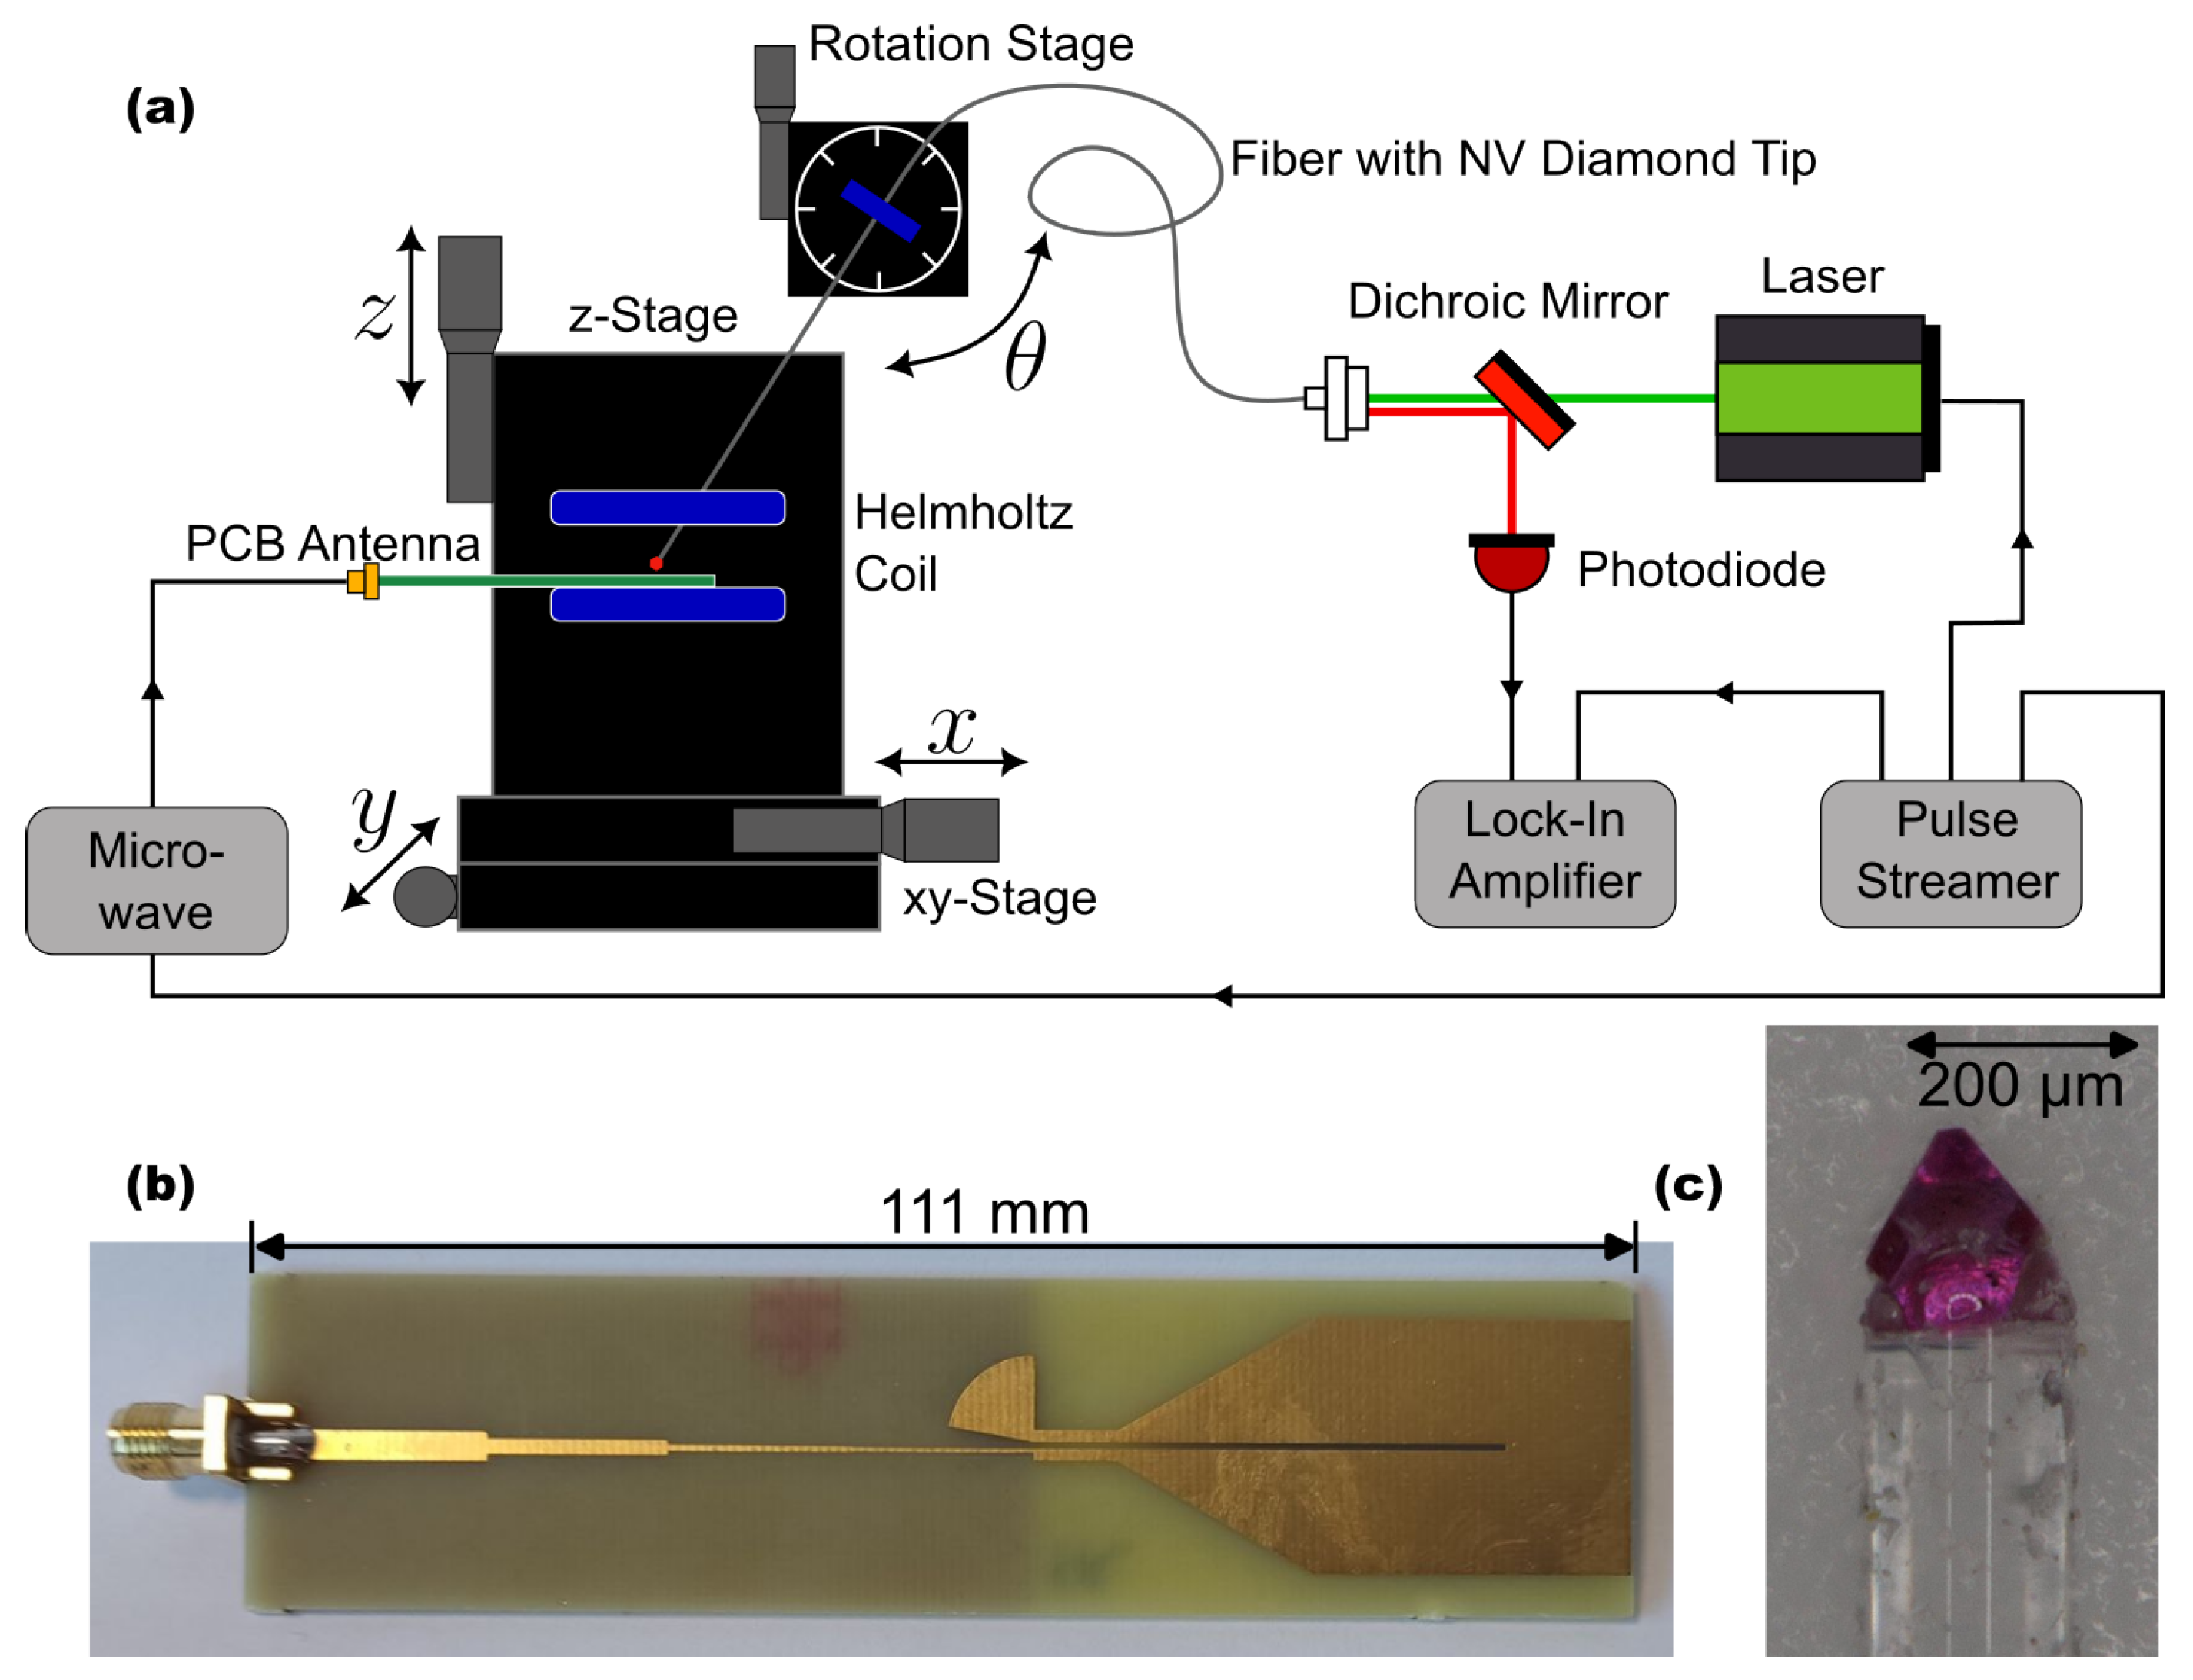
To determine the degree of matching to a 50 Ω network, the slot line waveguide with λ /4 transformer from Figure 1 is designed as a symmetrical two-port. The material properties of the PCB are the same as in Section 4 and the slot has a width of 0.5 mm. In order to minimize the return loss of the waveguide, a parameter study of the simulation model was conducted and the found parameters are listed in Table 1. Figure 4b shows the simulation results for the S11 parameter in red dashed and S21 in black dashed. Between a frequency of 1.9 GHz and 3.6 GHz the return loss remains below −10 dB with an exception at 2.2 GHz where a step increase can be seen. The reason for this could not be clarified. An anomaly in the calculation of the simulation is suspected. The waveguide model in Figure 4a was manufactured from the simulation model of a PCB manufacturer (JLCPCB, Shenzhen, Guangdong, China). In order to keep the structure on the PCB as unaffected as possible, the solder resist has been removed and the copper tracks are finished with standard electroless nickel immersion gold (ENIG). To measure the S-parameters, both sides are connected to a vector network analyzer (VNA) (ZNB, ROHDE&SCHWARZ, Munich, Bavaria, Germany) using SMA edge connectors. For accurate measurement results, the VNA has been calibrated with a 2 port Through-Open-Short-Match (TOSM) method. A return loss below 10 dB of the red S11 line could be measured on the real model between a frequency of 1.3 GHz and 4.5 GHz and thus shows a significantly wider bandwidth than the simulation. The setup in Figure 5a consists of two stacked linear stages (M-423, Newport, Irvine, CA, USA) for the x and y directions, on which another linear stage (M-433, Newport, Irvine, CA, USA) is mounted for the z direction. A laboratory-made Helmoltz coil for applying a static bias magnetic field in the z direction is mounted to the z-stage. The slot line waveguide in Figure 5b is fixed in short-circuit configuration with the slot end centered in the Helmoltz coil. A high pressure, high temperature (HPHT) microdiamond (MDNV150umHi50mg, Adámas Nanotechnologies, Raleigh, NC, USA) with an NV density between 2.5 ppm to 3 ppm is used as a measurement tip on an optical fiber (FP200URT, Thorlabs, Newton, NJ, USA) with an numerical aperture (NA) of 0.22 and a core diameter of 200 μm for scanning the antenna slot. The diamond measuring tip in Figure 5c is inserted externally into the xyz-stage via a rotation stage. The angle is used to adjust the projection of the static magnetic field for each NV axis so that all eight magnetic resonances of the NV diamond can be resolved. The orientation of the NV axes can be determined from the geometry of the diamond surface [22]. In Figure 5c, the NV axes are perpendicular to the hexagonal surfaces of the diamond, which would lead to an equal projection of the bias field on each of the four NV axes and prevents a distinction between the individual NV axes if the fiber tip was positioned perpendicular to the antenna. The fiber is connected to a fluorescence microscope with a fiber clamp (SM1F1, Thorlabs, Newton, NJ, USA).
A green laser diode (PLT5 520B, OSRAM GmbH, Munich, Germany) is clamped in a laser driver (LDM56/M, Thorlabs, Newton, NJ, USA) and is used for off-resonant excitation of the NV centers. The laser beam is coupled into the fiber using a 10x objective (0.25 NA). A dichroic mirror (DMLP550, Thorlabs, Newton, NJ, USA) reflects the fluorescent light from the diamond onto a photodetector (PDA36A2, Thorlabs, Newton, NJ, USA). The pulsed measurement method for Rabi oscillations corresponds to that of V. K. Sewani et al. [9]. The laser driver, microwave generator (DSG836A, Rigol, Suzhou, Jiangsu, China) and lock-in amplifier are controlled by a pulse generator (Pulse Streamer, Swabian Instruments, Stuttgart, BW, Germany). A high-frequency amplifier (CSA-870126, Celeritek, Santa Clara, CA, USA) in series with the antenna amplifies the microwave to 25 dBm. The Rabi oscillation of the NV diamond is used to measure the end of the slot line, as the rabi frequency gives a measure of the intensity of an alternating magnetic field component that is perpendicular to the NV axis [5]. A bias magnetic field of 2.85 mT is applied across the Helmholtz coils and the ODMR signal is recorded to localize the magnetic resonances. The microwave generator is fixed to a resonance at 2.829 GHz and the Rabi oscillation is measured with 25 dBm ( x , y ) [ 0 , 100 , , 500 ] μ m × [ 0 , 100 , , 800 ] μ m , Ω rabi ( x , y ) . To determine the fundamental frequency from the Rabi oscillation, the DC offset is first removed from the signal. A Blackman window function and zero padding of the signal to 1024 prepares the signal for a fast fourier transformation (FFT). The signal of the Rabi oscillation has a linear drift to increasing pulse lengths of the microwave. This leads to a strong frequency component at 361 kHz, which is filtered out with a notch filter. The Rabi frequency can then be found from the frequency range using a peak search function. The measurement was done on a 100 μm grid. Figure 6a shows a heat map of the distribution of Rabi frequencies over the end of the slot.
The slot of the antenna is drawn as a black line and the x and y coordinates correspond to the setup in Figure 5a. Compared to the simulation in Figure 2a, the heat map is qualitatively comparable. In order to determine the exact magnetic field strength that is projected perpendicular to the NV axis, the orientation of the diamond in the lab frame must be known. To observe the alternating magnetic field in the z-direction, a hole with a diameter of 0.3 mm has been drilled at the end of the slot. Since the fiber tip must now be inserted into the hole perpendicular to the PCB surface, the bias magnetic field must be tilted by rotating the Helmholtz coil. For the measurement, the microwave generator was set to resonance at 2.844 GHz. The zero point is defined as the point of contact between the fiber tip and the copper surface and the z-stage is moved in 20 μm steps z [ 0 , 20 , , 220 ] μm, Ω rabi ( z ) . Between a penetration depth of 40 μm to 120 μm, the frequency changes only insignificantly. Beyond this, it decreases parabolically as shown in Figure 6b, where we used a second degree polynomial function for fitting the data points.

6. Conclusions and Outlook

A simple microstrip to slot line mode converter structure on a two-layer board without complex taper or vias has been found. The calculation of the individual segments for changing requirements in substrate height, dielectric constant or slot width can be easily adapted with established equations. The simulation of the magnetic field lines of a short-circuited slot line end over a 150 μm sphere volume demonstrates an amplitude and homogeneity comparable to others. As a symmetrically designed waveguide, a 10 dB bandwidth of 3.2 GHz could be measured, verifying the functionality. In short-circuit configuration at an input power of 25 dBm, a Rabi frequency greater 1.5 MHz is found within the slot and the comparison with the simulation shows a qualitative match in the intensity distribution. The alternating magnetic field Bac can be calculated from the Rabi frequency [3,5]. But to obtain accurate values, the orientation of the diamond on the antenna surface must be known. One possibility would be a vectorial measurement method in a known lab frame [23] by measuring the Rabi oscillations of four resonances. The time function of a Rabi oscillation can be described by an exponentially decaying sine function with the time constant T 2 rabi . The decay time depends on the homogeneity of the alternating magnetic field and decreases due to inhomogeneities [24]. The transformation of the Rabi oscillation into the frequency domain leads to a Lorentz function, the amplitude of which depends on T 2 rabi . With this approach, we plan to be able to compare the homogeneity with the simulation results in the future.

Author Contributions

Conceptualization, D.S.; methodology, D.S., J.H. and M.G.; validation, D.S., J.H. and M.G.; formal analysis, D.S. and J.P.; investigation, D.S.; resources, P.G. and M.G.; data curation, D.S.; writing—original draft preparation, D.S.; writing—review and editing, D.S., L.H., A.-S.B., F.H. and J.P.; visualization, D.S.; supervision, P.G. and M.G.; project administration, P.G.; funding acquisition, M.G. and P.G. All authors have read and agreed to the published version of the manuscript.

Funding

This research was funded by Bundesministerium für Forschung, Technologie und Raumfahrt grant number 13N16710.

Institutional Review Board Statement

Not applicable.

Informed Consent Statement

Not applicable.

Data Availability Statement

The raw data supporting the conclusions of this article will be made available by the authors on request.

Acknowledgments

The authors would like to thank the members of the QuantumMiniLabs project for fruitful discussions as well as the the Research Centre for Information and Communications Technologies of the University of Granada (CITIC-UGR) for fruitful exchange.

Conflicts of Interest

The authors declare no conflict of interest.

Abbreviations

The following abbreviations are used in this manuscript:
NVNitrogen vacancy
FEMFinite element method
PCBPrintable circuit board
ZFSZero field splitting
ODMROptically detection of magnetic resonances
RF4Fire retardant
CPSCoplanar strips
TEMTransverse electromagnetic mode
ENIGElectroless nickel iommersion gold
VNAVector network analyser
TOSMThrough-ppen-short-match
HPHTHigh temperature high pressure
NANumerical aperture
FFTFast fourier transformation

References

  1. Sasaki, K.; Monnai, Y.; Saijo, S.; Fujita, R.; Watanabe, H.; Ishi-Hayase, J.; Itoh, K.M.; Abe, E. Broadband, large-area microwave antenna for optically detected magnetic resonance of nitrogen-vacancy centers in diamond. Rev. Sci. Instrum. 2016, 87, 053904. [Google Scholar] [CrossRef] [PubMed]
  2. Bayat, K.; Choy, J.; Baroughi, M.F.; Meesala, S.; Loncar, M. Efficient, uniform, and large area microwave magnetic coupling to NV centers in diamond using double split-ring resonators. Nano Lett. 2014, 14, 1208–1213. [Google Scholar] [CrossRef]
  3. Eisenach, E.R.; Barry, J.F.; Pham, L.M.; Rojas, R.G.; Englund, D.R.; Braje, D.A. Broadband loop gap resonator for nitrogen vacancy centers in diamond. Rev. Sci. Instrum. 2018, 89, 094705. [Google Scholar] [CrossRef]
  4. Kapitanova, P.; Soshenko, V.V.; Vorobyov, V.V.; Dobrykh, D.; Bolshedvorskii, S.V.; Sorokin, V.N.; Akimov, A.V. 3D Uniform Manipulation of NV Centers in Diamond Using a Dielectric Resonator Antenna. JETP Lett. 2018, 108, 588–595. [Google Scholar] [CrossRef]
  5. Zhang, N.; Yuan, H.; Zhang, C.; Xu, L.; Zhang, J.; Bian, G.; Fan, P.; Yuan, H.; Fang, J. Microwave Field Uniformity Impact on DC Magnetic Sensing With NV Ensembles in Diamond. IEEE Sens. J. 2019, 19, 451–456. [Google Scholar] [CrossRef]
  6. Opaluch, O.R.; Oshnik, N.; Nelz, R.; Neu, E. Optimized Planar Microwave Antenna for Nitrogen Vacancy Center based Sensing Applications. Nanomaterials 2021, 11, 2108. [Google Scholar] [CrossRef]
  7. Haverkamp, N.; Pusch, A.; Gregor, M.; Heusler, S. Low-cost ODMR experiments with nitrogen-vacancy centers in diamonds: A didactical approach to theory and experiment. EPJ Quantum Technol. 2025, 12, 27. [Google Scholar] [CrossRef]
  8. Hu, Q.; Huang, K.; Mao, X.; Ran, G.; He, X.; Lin, Z.; Hu, T.; Ran, S. Design of high sensitivity magnetometer based on Diamond Nitrogen-Vacancy Centers and Weak Signal Output Module. Diam. Relat. Mater. 2025, 151, 111858. [Google Scholar] [CrossRef]
  9. Sewani, V.K.; Vallabhapurapu, H.H.; Yang, Y.; Firgau, H.R.; Adambukulam, C.; Johnson, B.C.; Pla, J.J.; Laucht, A. Coherent control of NV− centers in diamond in a quantum teaching lab. Am. J. Phys. 2020, 88, 1156–1169. [Google Scholar] [CrossRef]
  10. Lee, J.S.; Lee, G.H.; Mohyuddin, W.; Choi, H.C.; Kim, K.W. Design of an Ultra-Wideband Microstrip-to-Slotline Transition on Low-Permittivity Substrate. Electronics 2020, 9, 1329. [Google Scholar] [CrossRef]
  11. Lee, G.H.; Mohyuddin, W.; Choi, H.C.; Kim, K.W. Asymmetric Ultra-Wideband Microstrip-to-Coplanar Stripline Transition. IEEE Microw. Wirel. Compon. Lett. 2018, 28, 386–388. [Google Scholar] [CrossRef]
  12. Lee, G.H.; Mohyuddin, W.; Kumar, S.; Choi, H.C.; Kim, K.W. Compact Wideband Coplanar Stripline-to-Microstrip Line Transition Using a Bended Structure on a Two-Layered Substrate. Electronics 2021, 10, 1272. [Google Scholar] [CrossRef]
  13. Guo, X.; Zhu, L.; Wang, J.; Wu, W. Wideband Microstrip-to-Microstrip Vertical Transitions Via Multiresonant Modes in a Slotline Resonator. IEEE Trans. Microw. Theory Tech. 2015, 63, 1902–1909. [Google Scholar] [CrossRef]
  14. Seman, N.S.; Bialkowski, M.E. Microstrip-Slot Transition and Its Applications in Multilayer Microwave Circuits. In Passive Microwave Components and Antennas; Zhurbenko, V., Ed.; InTech: London, UK, 2010. [Google Scholar] [CrossRef]
  15. Zinieris, M.M.; Sloan, R.; Davis, L.E. A broadband microstrip-to-slot-line transition. Microw. Opt. Technol. Lett. 1998, 18, 339–342. [Google Scholar] [CrossRef]
  16. Garg, R.; Bahl, I.J.; Bozzi, M. Microstrip Lines and Slotlines, 3rd ed.; Artech House Microwave Library, Artech House: Boston, MA, USA, 2013. [Google Scholar]
  17. Tu, W.H.; Chang, K. Wide-band microstrip-to-coplanar stripline/slotline transitions. IEEE Trans. Microw. Theory Tech. 2006, 54, 1084–1089. [Google Scholar] [CrossRef]
  18. Toulali, I.; Lahsaini, M.; Zenkouar, L. Design of a Low Noise Amplifier Using the Quarter Wave Transformers Matching Technique in the Frequency Band [9–13] GHz. Int. J. Commun. Antenna Propag. (IRECAP) 2015, 5, 248. [Google Scholar] [CrossRef]
  19. Hammerstad, E.O. Equations for Microstrip Circuit Design. In Proceedings of the 1975 5th European Microwave Conference, Hamburg, Germany, 1–4 September 1975; pp. 268–272. [Google Scholar] [CrossRef]
  20. Darwis, F.; Wijayanto, Y.N.; Setiawan, A.; Mahmudin, D.; Rahman, A.N.; Daud, P. 10 GHz Standing-Wave Coplanar Stripline on LiNbO 3 Crystal for Radio to Optical-Wave Conversion. J. Physics Conf. Ser. 2018, 1011, 012050. [Google Scholar] [CrossRef]
  21. Janaswamy, R.; Schaubert, D.H. Characteristic Impedance of a Wide Slotline on Low-Permittivity Substrates (Short Paper). IEEE Trans. Microw. Theory Tech. 1986, 34, 900–902. [Google Scholar] [CrossRef]
  22. Stiegekötter, D.; Pogorzelski, J.; Horsthemke, L.; Hoffmann, F.; Gregor, M.; Glösekötter, P. Microcontroller-Optimized Measurement Electronics for Coherent Control Applications of NV Centers. Sensors 2024, 24, 3138. [Google Scholar] [CrossRef] [PubMed]
  23. Homrighausen, J.; Hoffmann, F.; Pogorzelski, J.; Glösekötter, P.; Gregor, M. Microscale fiber-integrated vector magnetometer with on-tip field biasing using N-V ensembles in diamond microcrystals. Phys. Rev. Appl. 2024, 22, 034029. [Google Scholar] [CrossRef]
  24. Saiko, A.P.; Fedaruk, R.; Markevich, S.A. Suppression of electron spin decoherence in Rabi oscillations induced by an inhomogeneous microwave field. J. Magn. Reson. 2018, 290, 60–67. [Google Scholar] [CrossRef] [PubMed]
Figure 1. Photograph taken by the first author of this article, Dennis Stiegekötter: Demonstrator of the microstrip line to slot line mode converter inspired by the design of W. Tu and K. Chang [17]. The resistance values are the waveguide impedances of the microwave.
Engproc 101 00009 g001
Figure 2. FEM simulation of a slot line model in short-circuit configuration. (a) Magnitude of the alternating magnetic field Bac of the microwave in gauss. (b) Angle θ between the z component Bac,z and the magnitude vector Bac in degrees.
Engproc 101 00009 g002
Figure 3. Parametric sweep of the slot width of the slot line and measurement of the amplitude of the alternating magnetic field vector Bac in gauss (blue) and the angle θ in degrees (red) as the volume average of a sphere with a diameter of 150 μm.
Engproc 101 00009 g003
Figure 4. (a) Microstrip line to slot line mode converter in symmetrical 2-port on a PCB without solder mask. (b) Simulated and measured S-parameters of the symmetrical waveguide. The S11 parameter is below −10 dB in the real measurement for a frequency range from 1.3 GHz to 4.5 GHz.
Engproc 101 00009 g004
Figure 5. Setup for the spatial measurement of Rabi oscillation. (a) A Helmholtz coil with the antenna inside is fixed to an xyz-stage. Excitation and detection of the fiber-based diamond sensor is achieved using a fluorescence microscope. A pulse generator serves as the central control unit for the setup and provides a lock-in amplifier with a reference frequency for processing the NV signals. (b) The microstrip to slot line mode converter is used as an antenna to excite the magnetic resonances and is terminated with a 10 mm wide short circuit. (c) Microdiamond as the tip of a glass fiber for scanning the antenna. The fiber is decoupled from the xyz-stage.
Engproc 101 00009 g005
Figure 6. (a) Heatmap of measured Rabi frequencies at the short-circuited end of the slot line. The black line represents the contour of the slot. (b) Normalized Rabi frequency of a single resonance at 2.844 GHz as a function of the penetration depth into a drilled hole.
Engproc 101 00009 g006
Table 1. Dimensions of the different sections from the demonstrator in Figure 1 in [mm] for the width W and length L and [°] for the angles ϕ and α .
50 Ω 56 Ω 75 Ω 110 Ω 122 Ω CPSSLTaperStub
W = 2.81W = 2.32W = 1.19W = 0.49W = 0.34W = 2.5W = 10.5 ϕ  = 30 α  = 80
L = 5L = 14.3L = 14.6L = 14.8L = 14.6L = 6.73L = 15.4 R = 7
Disclaimer/Publisher’s Note: The statements, opinions and data contained in all publications are solely those of the individual author(s) and contributor(s) and not of MDPI and/or the editor(s). MDPI and/or the editor(s) disclaim responsibility for any injury to people or property resulting from any ideas, methods, instructions or products referred to in the content.