1. Introduction
Solar energy is among the most promising and sustainable energy sources available today. As global efforts intensify to transition to low-carbon energy systems, renewable energy technologies—particularly photovoltaics—are gaining increasing importance [
1]. Bulgaria, with its advantageous geographical location and favorable climate, has significant potential for solar energy exploitation [
2].
The average annual sunshine duration in Bulgaria ranges from 2000 to 2200 h, with the highest values recorded in southern and southeastern regions such as Petrich, Sandanski, Plovdiv, Sliven, and along the Black Sea coast [
3]. According to the European PVGIS platform, global solar radiation in Bulgaria varies from approximately 1250 to over 1600 kWh/m
2 annually, positioning the country as one of the most suitable locations for photovoltaic electricity generation in Southeast Europe [
4].
In recent years, there has been a sharp rise in investments in both photovoltaic and solar thermal systems, driven by European green transition initiatives, national energy efficiency strategies, and the continued decline in the cost of PV technologies [
1,
5]. Along with environmental benefits, solar energy has become a financially attractive option for reducing energy dependence and long-term energy costs for both residential and industrial consumers.
Photovoltaic systems can be deployed in a wide variety of settings—including rooftops, façades, open fields, and otherwise underutilized terrain—making them versatile across a range of climatic and geographic environments [
6]. Designing an efficient PV system requires careful consideration of several factors, including site-specific climate data, characteristics and layout of the modules, mounting configurations, inverter specifications, and targeted energy output [
7]. The performance and efficiency of a PV installation are highly sensitive to these design parameters, making accurate input data and site analysis critical for success [
8].
Simulation tools, such as PVSol Expert, offer detailed design capabilities that support this process by modeling the expected system performance under real-world conditions. These simulations account for variables such as solar radiation, module orientation and tilt, local weather data, and potential shading—resulting in realistic estimates of energy production [
9]. PVSol Expert, in particular, is equipped with advanced 3D modeling functionality to identify shading effects and calculate system losses while also enabling hourly, monthly, and annual radiation projections [
10]. This makes it a valuable resource for both system planning and performance forecasting.
2. System Description and Methodology
While the accuracy of simulation tools is widely acknowledged, relatively few studies focus on direct comparisons between PVSol Expert projections and actual measurements from small-scale autonomous systems. This gap highlights the need for more detailed case studies that analyze discrepancies between calculated and real values, especially in Eastern European climate conditions.
The present study concentrates on the autumn–winter period, encompassing October through December, as these months are known to exhibit increased variability in solar radiation due to shorter daylight duration, lower sun angles, and frequent cloudiness. Although longer-term (annual) data exist, the selected timeframe was chosen because it demonstrates the most pronounced deviations—both in absolute values and dynamic behavior—between simulation and reality.
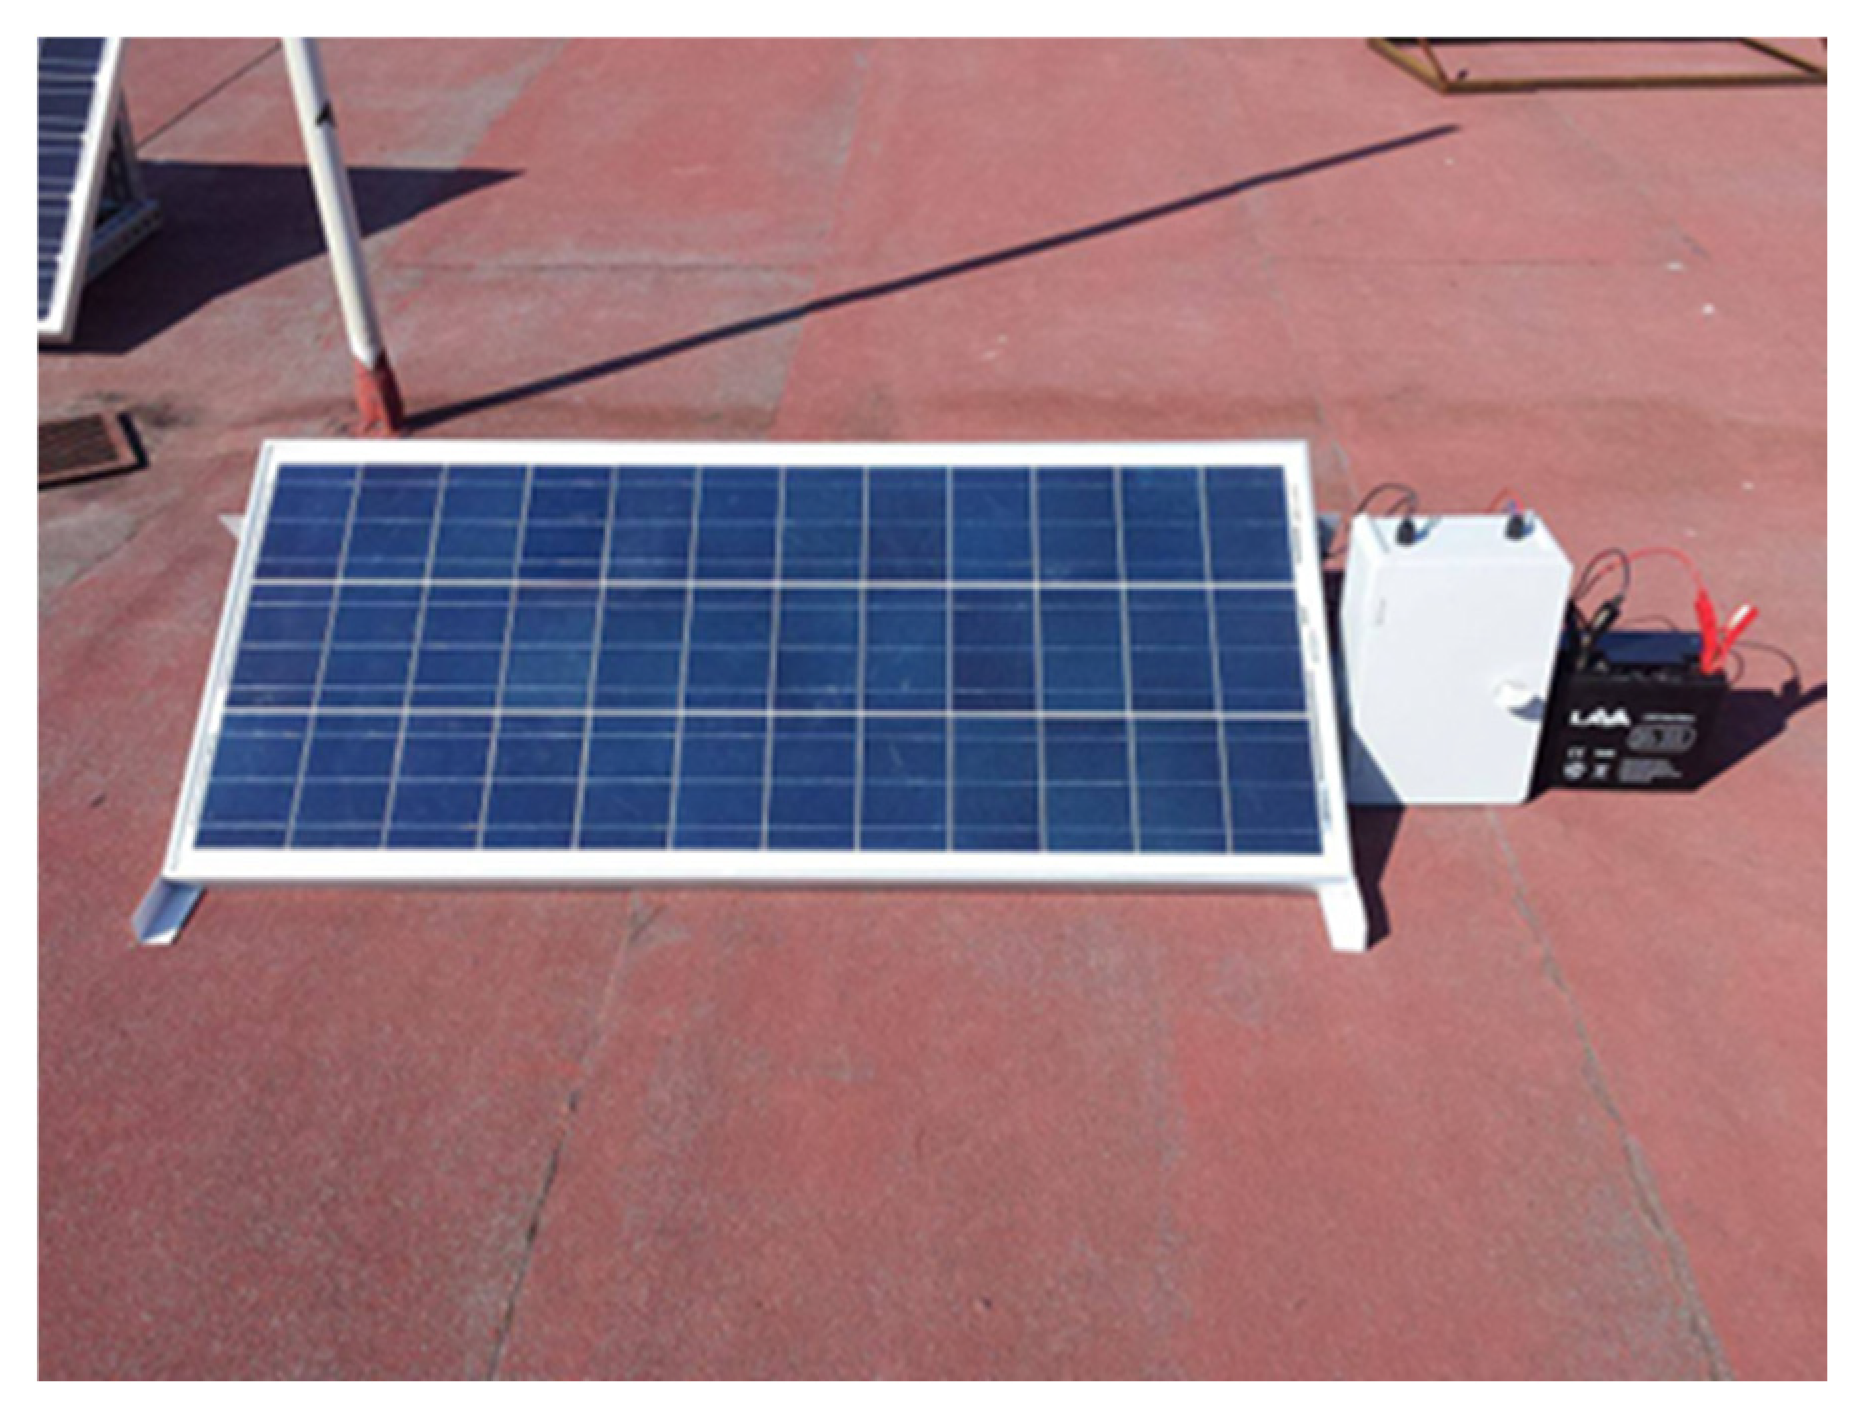
The photovoltaic system evaluated in this study was installed specifically for research purposes at the Fourth Academic Building of the Technical University of Sofia—Plovdiv Branch. The experimental setup consists of a single polycrystalline module (RG-P100W), rated at 100 W with an efficiency of 17%. The module was installed at a fixed tilt angle of 31°, corresponding to the optimal inclination for the site’s latitude in southern Bulgaria.
A Peacefair PZEM-031 DC measurement unit was used for real-time data acquisition. This device was positioned after the charge controller and recorded the current and power output of the system. A LAVA 12V/18Ah rechargeable battery and a constant DC resistive load were connected to the system to ensure stable operating conditions.
Measurements were performed daily over a three-month period—from October through December 2023. Data were collected at a system voltage of 12V, and the key measured parameters included direct current (A), output power (W), and incoming solar irradiance (W/m
2) (
Figure 1).
To establish a reference, solar radiation values were retrieved from the PVGIS platform (average daily solar irradiance dataset) for the coordinates of the study site in Plovdiv. These values were also used as input for the simulation environment (
Figure 2).
Although monthly energy deviations between simulation and measurements are relatively minor, this study reveals that certain days exhibit significant mismatches. This observation underscores the importance of including battery storage or auxiliary energy sources in off-grid applications. Furthermore, from a planning perspective, it is advisable to interpret simulation results with a deviation margin (e.g., ±10%) when assessing long-term performance or conducting financial feasibility analyses.
3. Results
An identical model of the physical system was created using the PV*Sol Expert software. The simulation considered all relevant parameters, including geographic location, tilt and azimuth angle, module and inverter specifications, and estimated system losses. Simulation results were generated for the same period (October–December 2023) under standard operating assumptions.
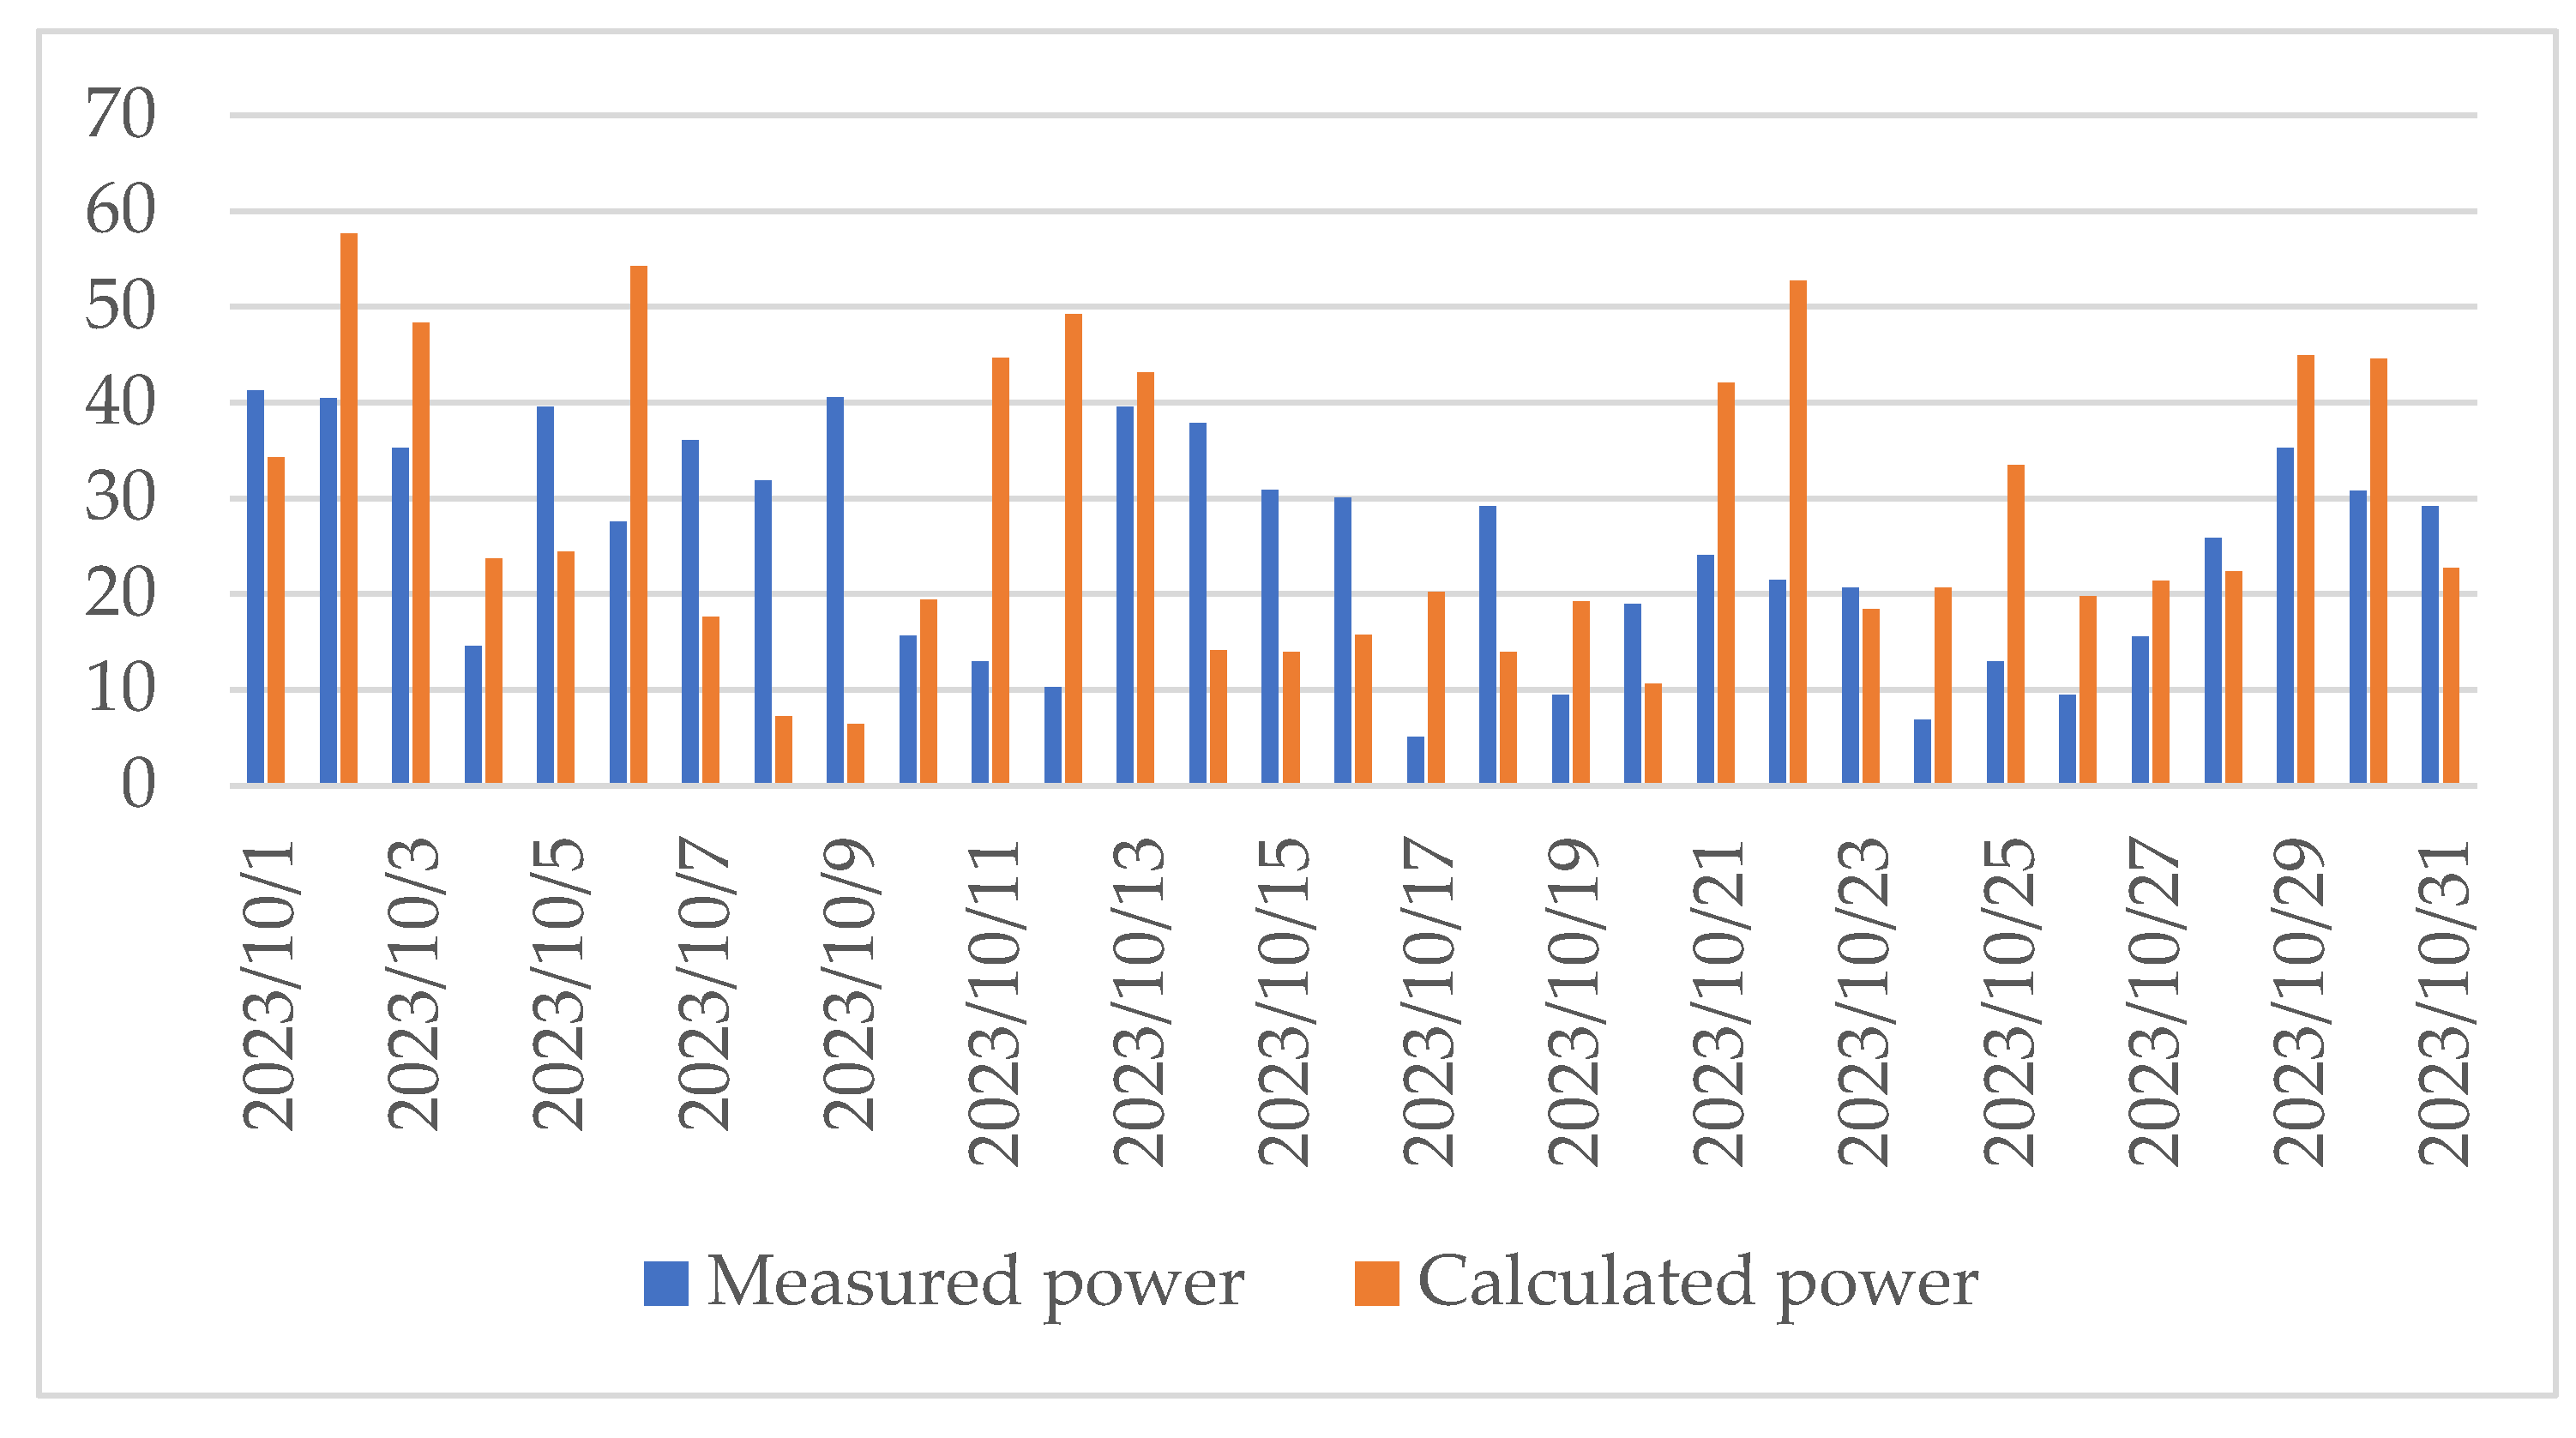
Figure 3 presents a daily comparison of measured and simulated electrical power output for October 2023. The chart shows the recorded power values and the corresponding PV*Sol Expert simulation results for each day of the month.
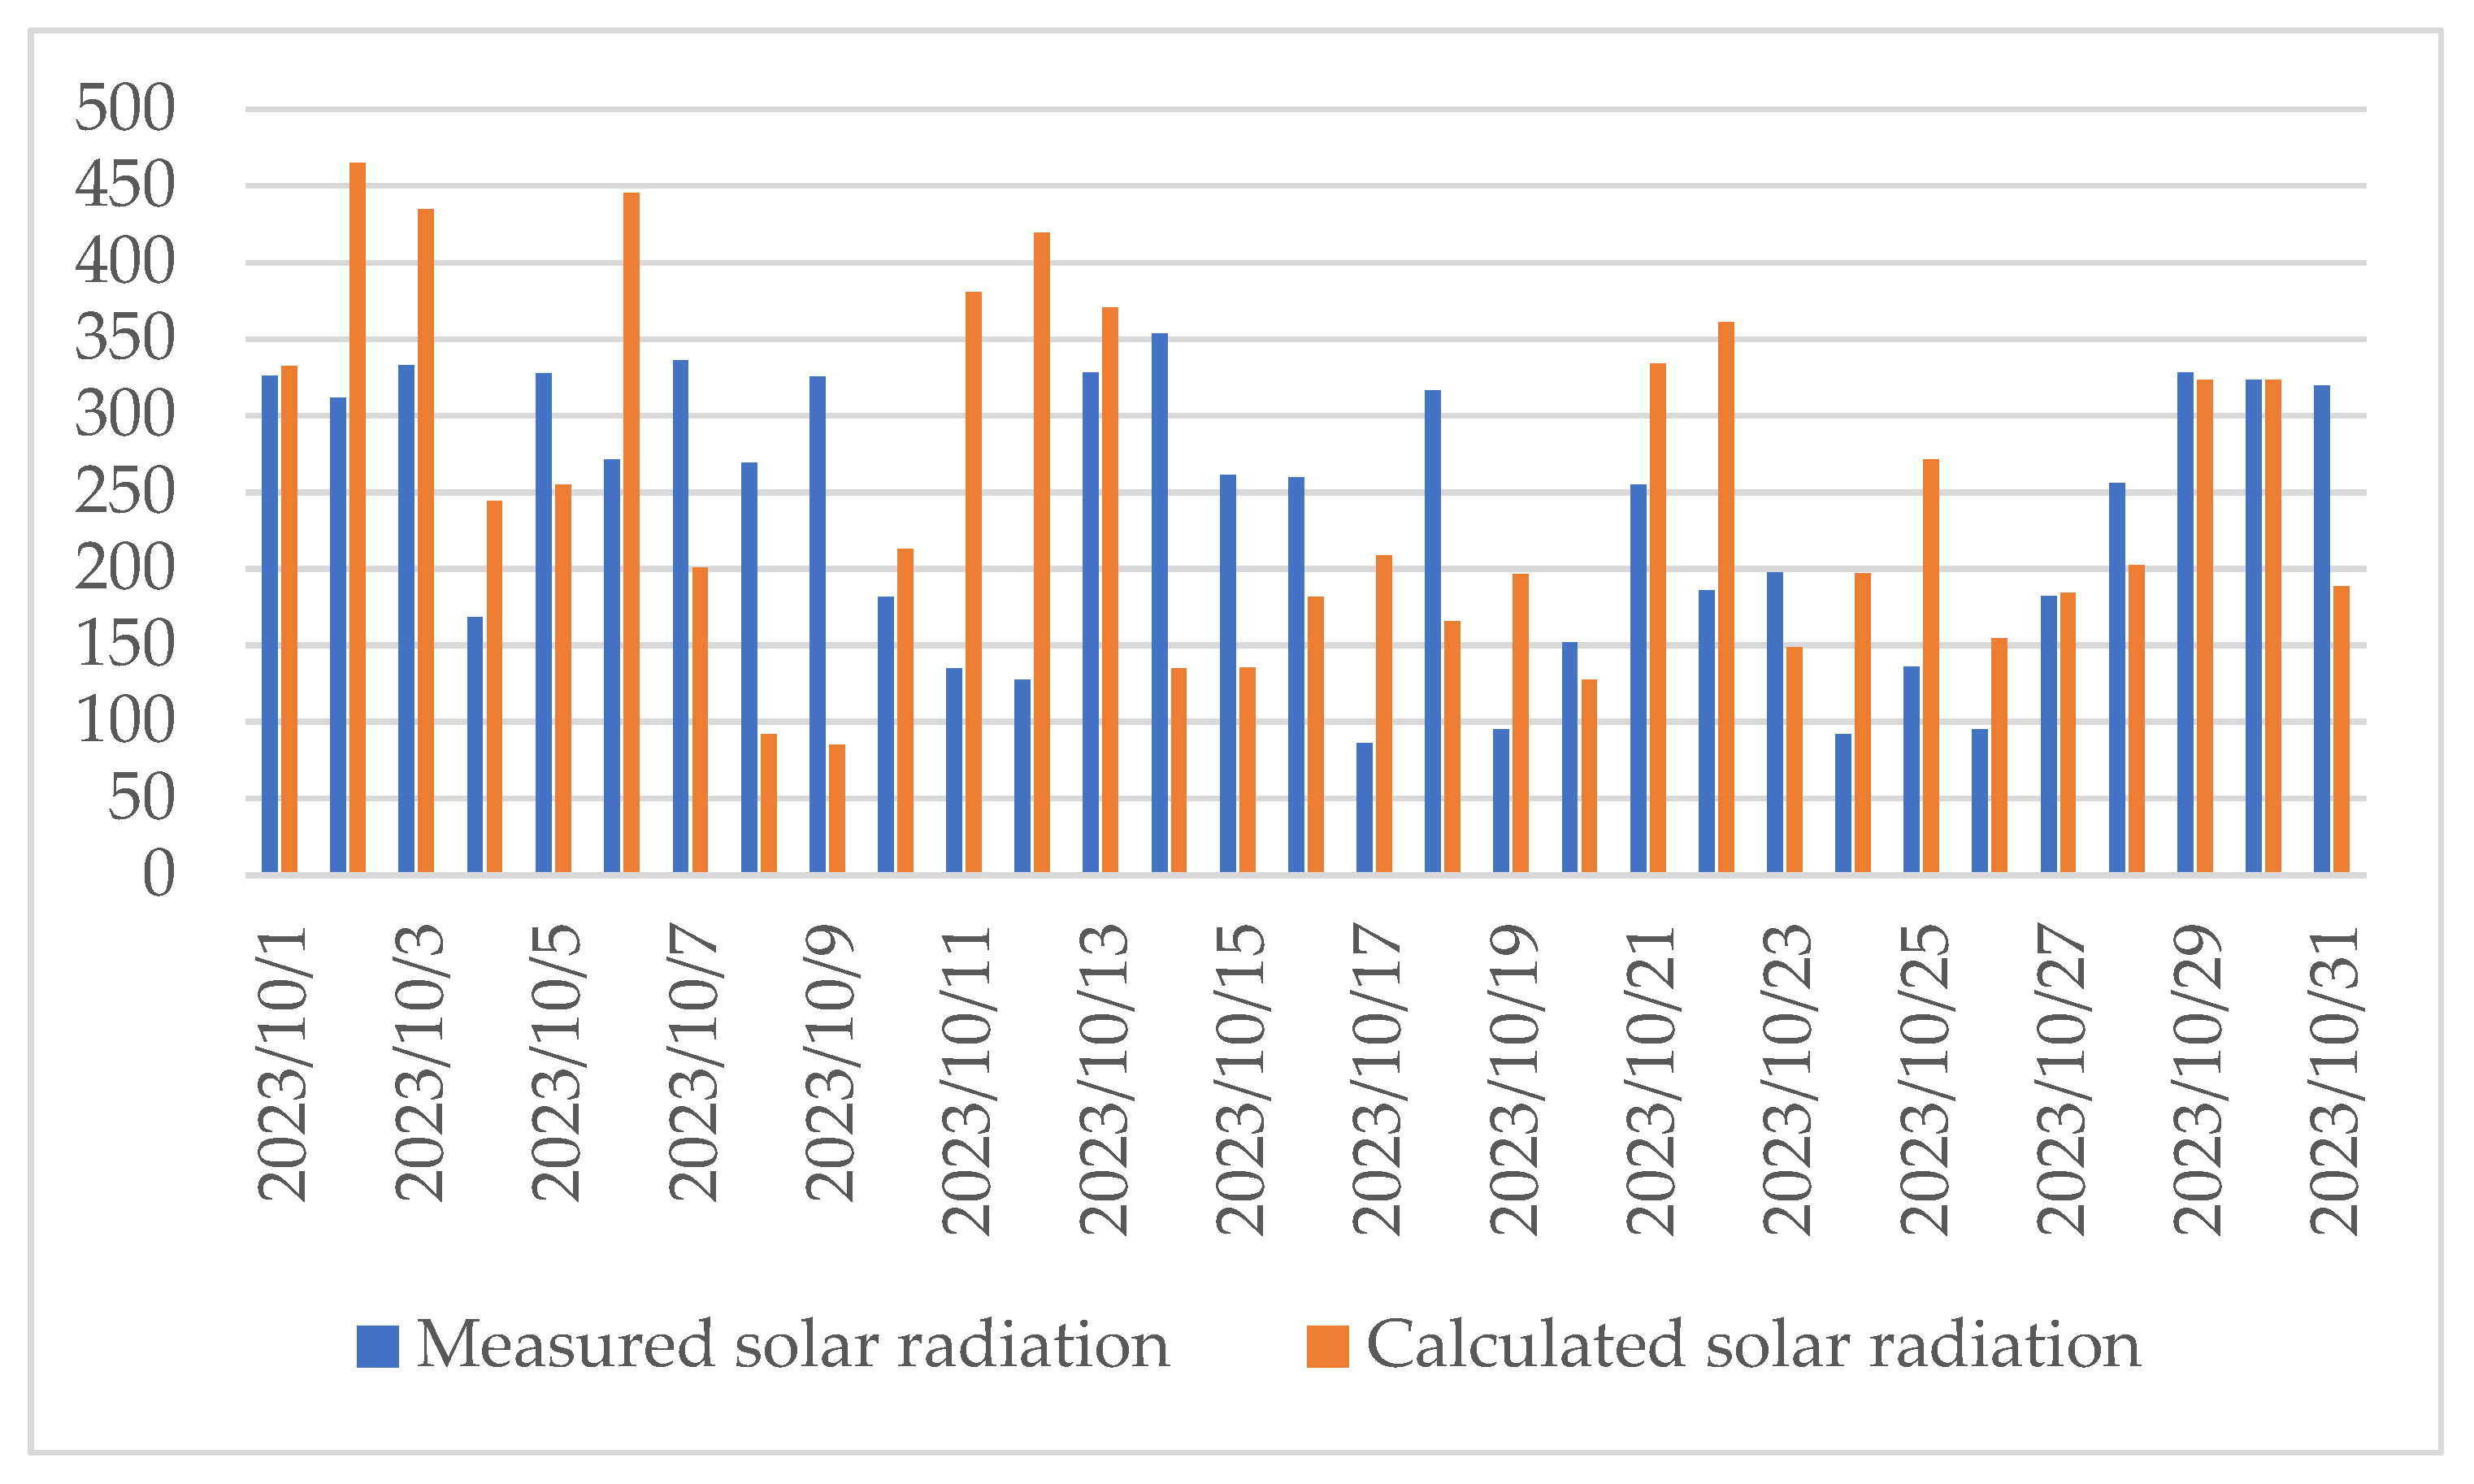
Figure 4 presents a daily comparison of measured and simulated solar irradiance for October 2023. The chart shows the irradiance values obtained from field measurements and PV*Sol Expert simulations for each day of the month.
Figure 5 presents a daily comparison of measured and simulated electrical power output for November 2023. The chart shows the recorded power values and the corresponding PV*Sol Expert simulation results for each day.
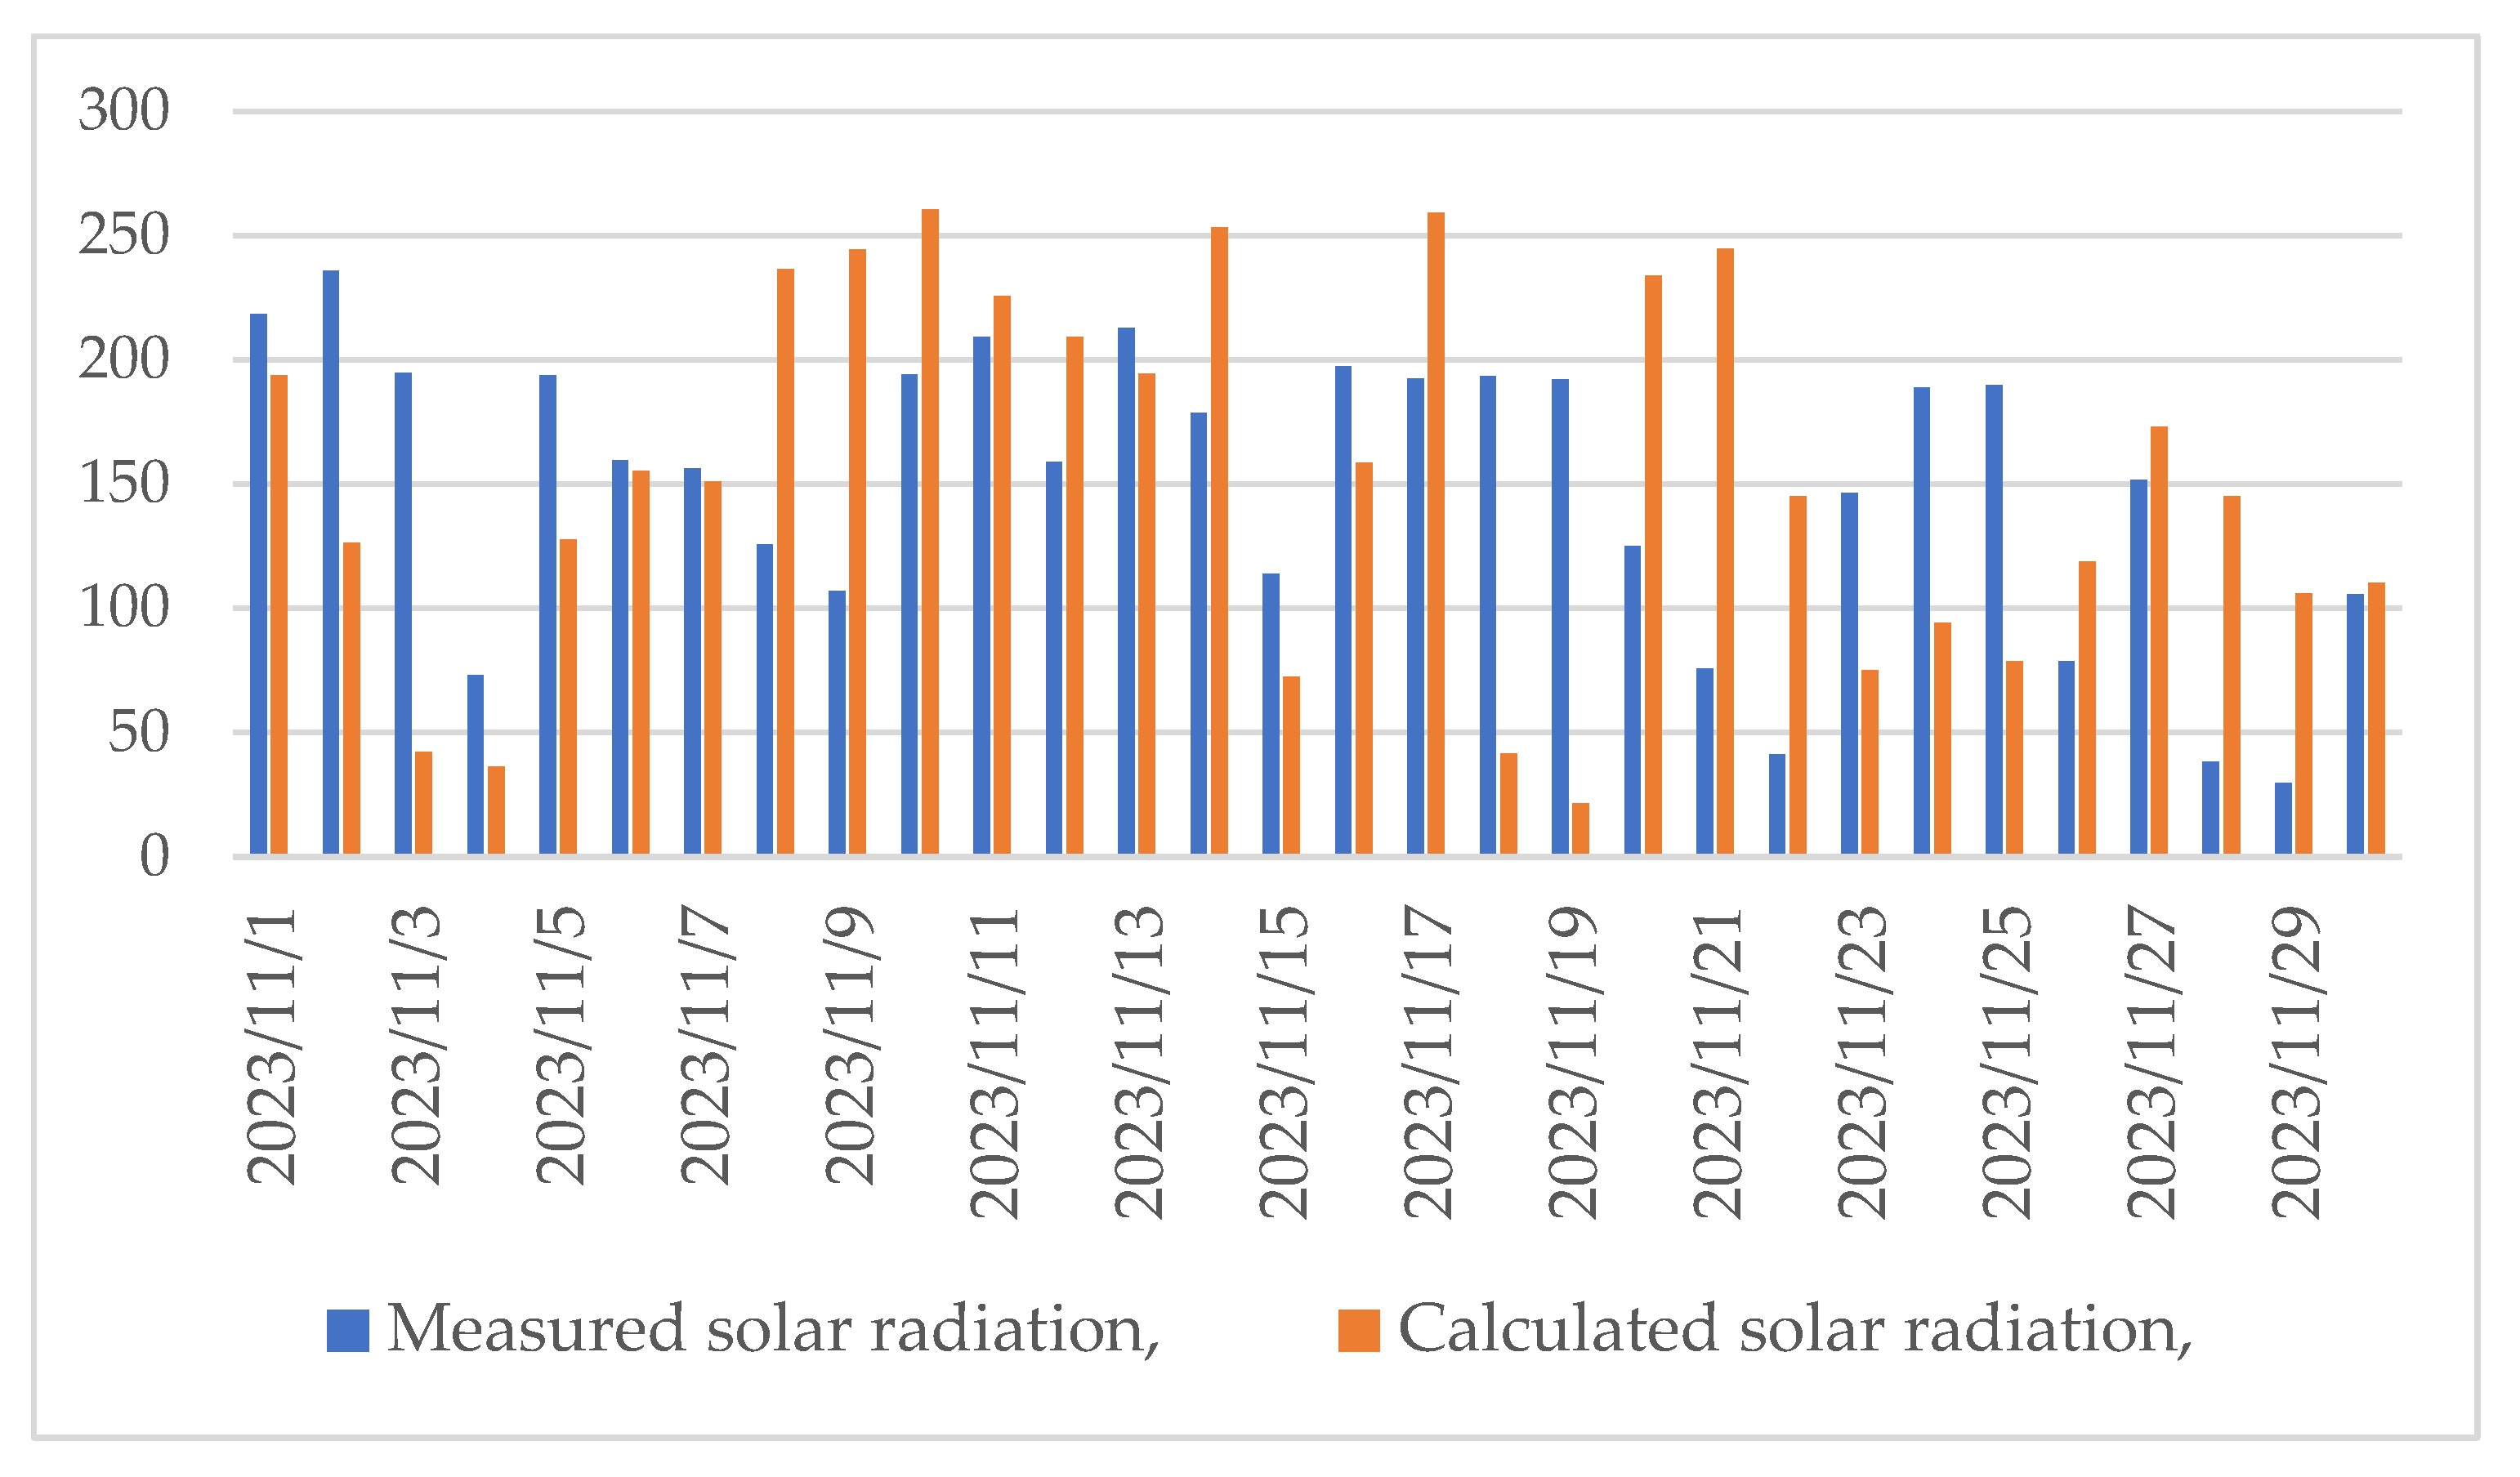
Figure 6 presents a daily comparison of measured and simulated solar irradiance for November 2023. The chart shows the irradiance values obtained through measurements and simulations for each day of the month.
Figure 7 presents a daily comparison of measured and simulated electrical power output for December 2023. The chart shows the measured power values (blue) and the simulated values (orange) for each day of the month.
Figure 8 presents a daily comparison of measured and simulated solar irradiance for December 2023. The chart shows irradiance values obtained through field measurements and PV*Sol Expert simulation for each day of the month.
While monthly averages provide a general understanding of system performance, they often mask short-term deviations. Therefore, hourly data for selected reference days—7 October, 7 November, and 7 December 2023—were analyzed to examine the dynamic behavior of the system in greater detail. This approach enables the identification of peak performance intervals, the evaluation of simulation accuracy under conditions of partial irradiance, and the detection of transient atmospheric effects such as cloud cover, shading, or temperature fluctuations. By focusing on hourly resolution, the analysis provides deeper insight into the real-time correlation between modeled and measured values across different seasonal conditions.
Figure 9 presents an hourly comparison of measured and simulated electrical power for a selected day in November. The chart shows the recorded power values along with the corresponding PV*Sol Expert simulation results throughout the day.
Figure 10 presents an hourly comparison of measured and simulated solar irradiance for the same day. The chart shows the temporal variation in measured irradiance and the corresponding simulation data.
Figure 11 presents an hourly comparison of measured and simulated electrical power for 7 November 2023. The chart shows the recorded power values along with the corresponding PV*Sol Expert simulation results throughout the day.
Figure 12 presents an hourly comparison of measured and simulated solar irradiance for 7 November 2023. The chart shows the measured irradiance values and the corresponding simulation results for each hour of the day.
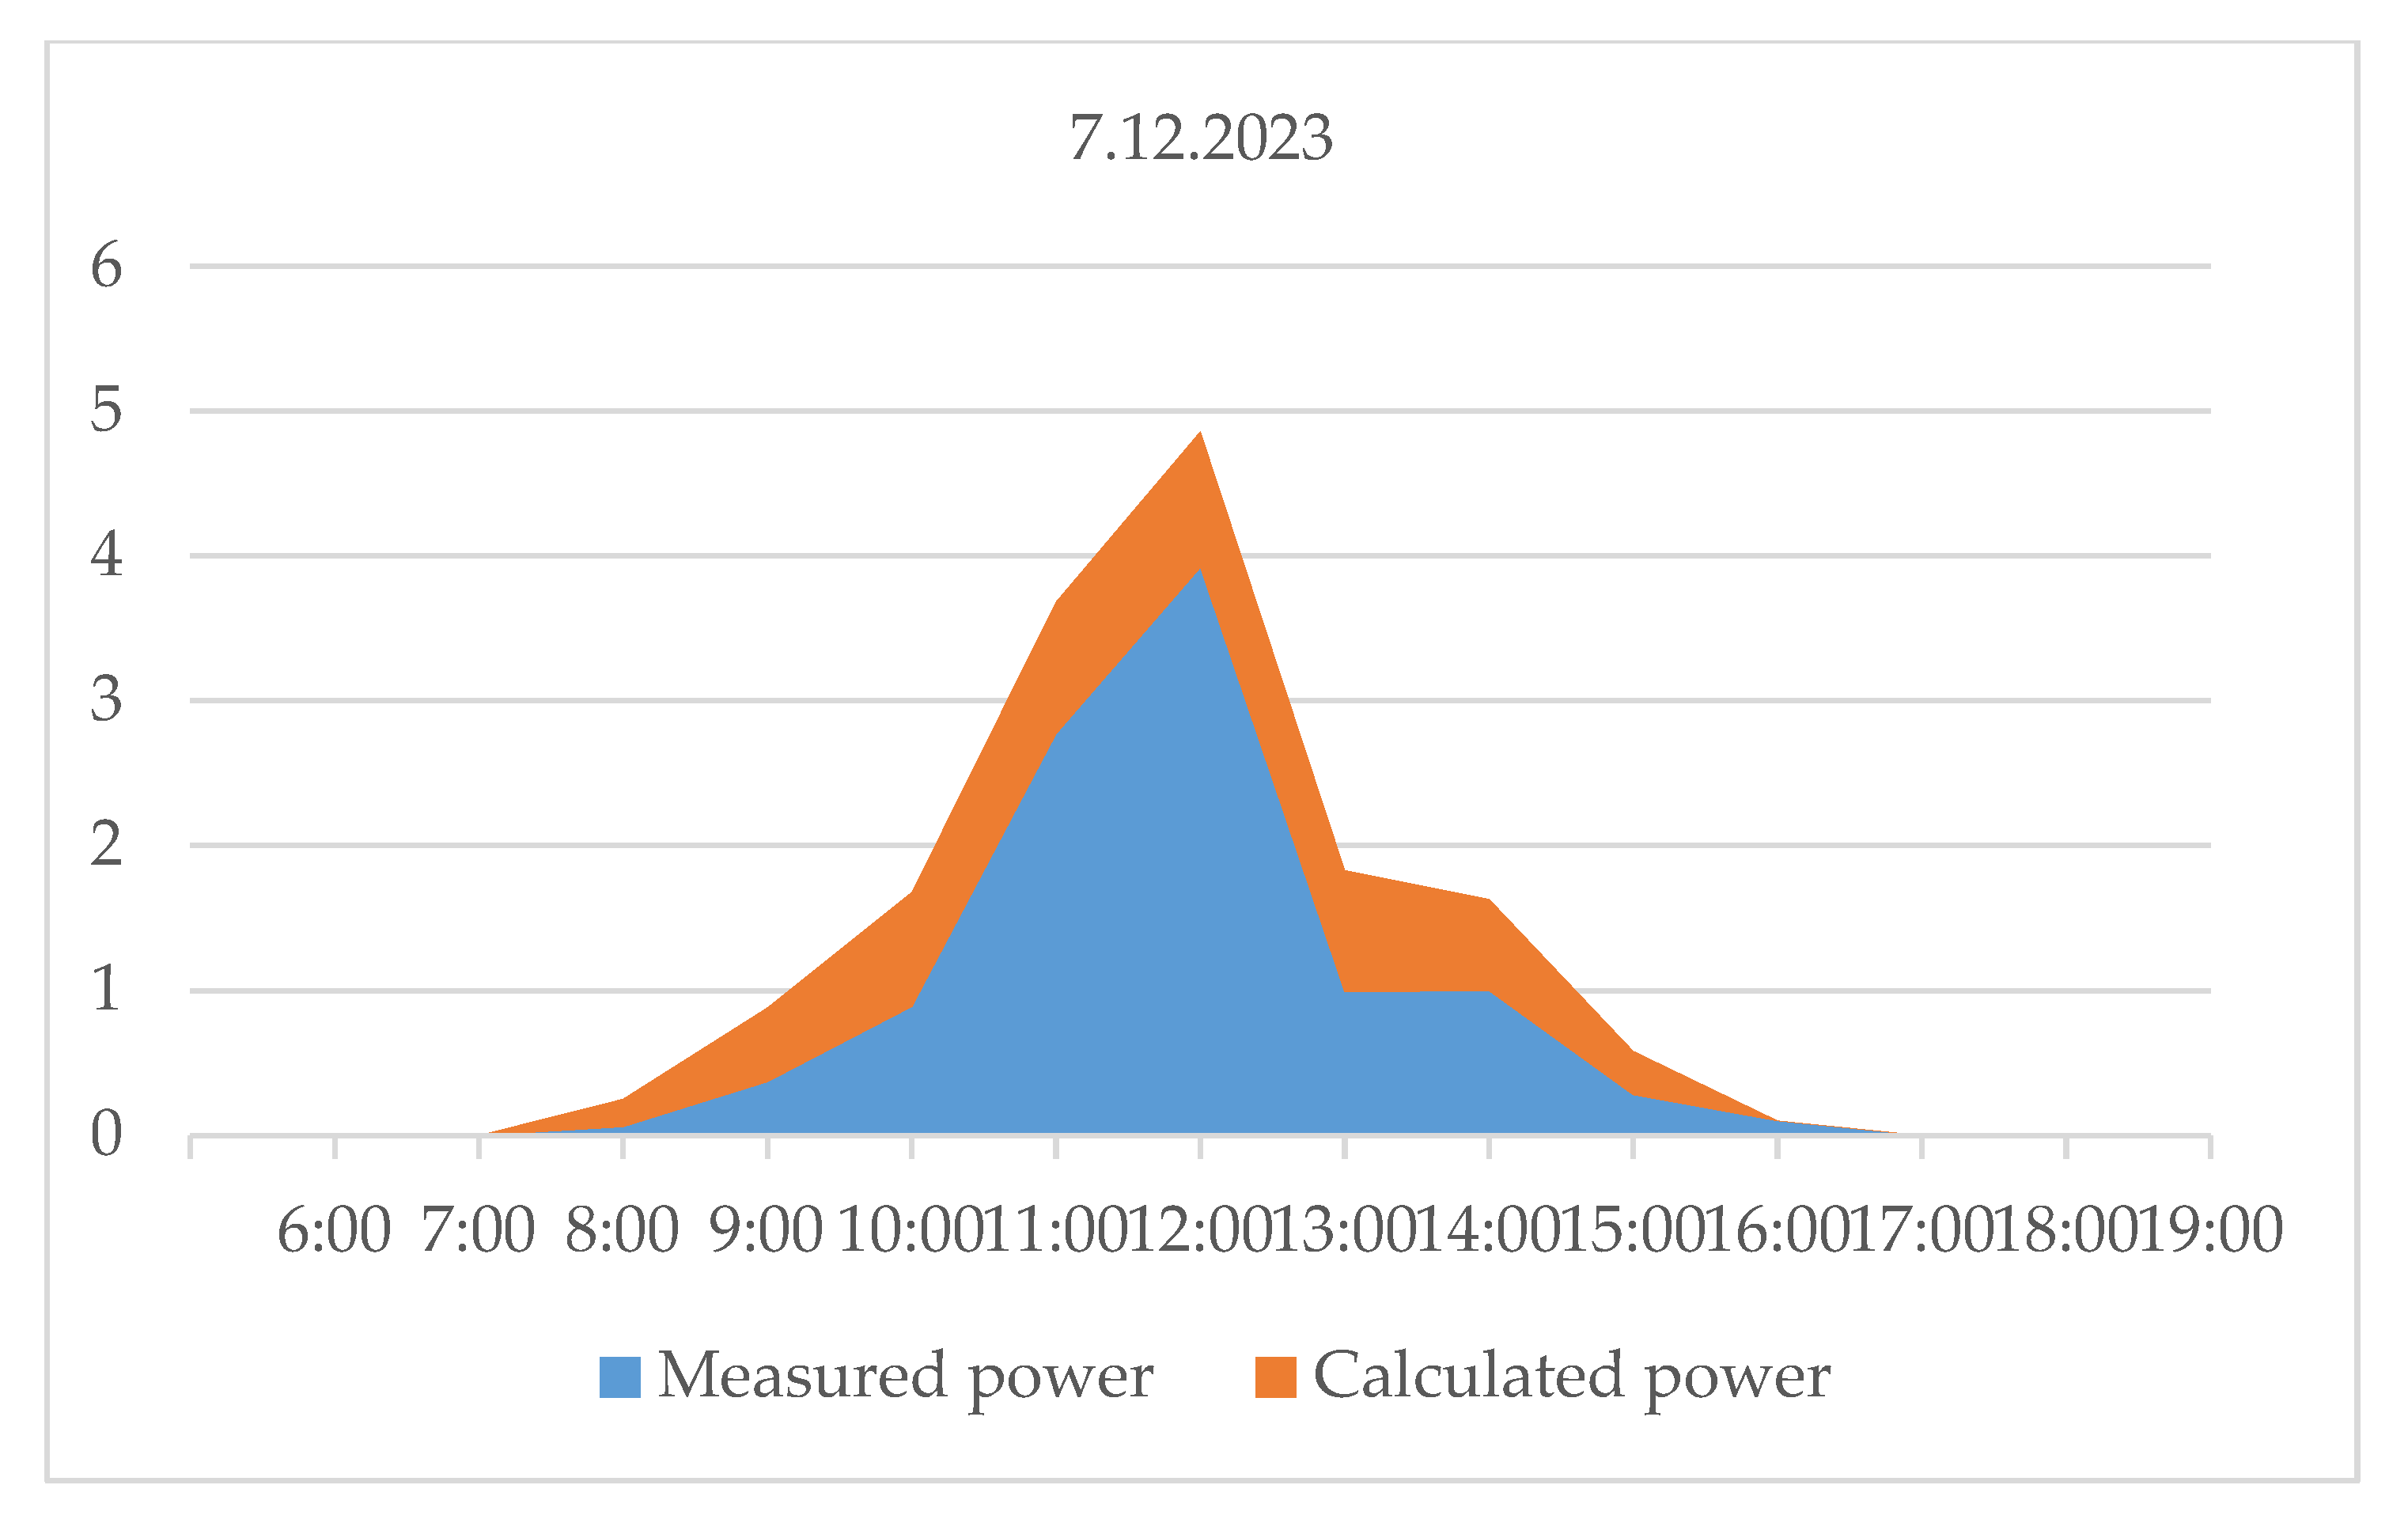
Figure 13 presents an hourly comparison of measured and simulated electrical power for 7 December 2023. The chart shows the recorded power values along with the PV*Sol Expert simulation results for each hour.
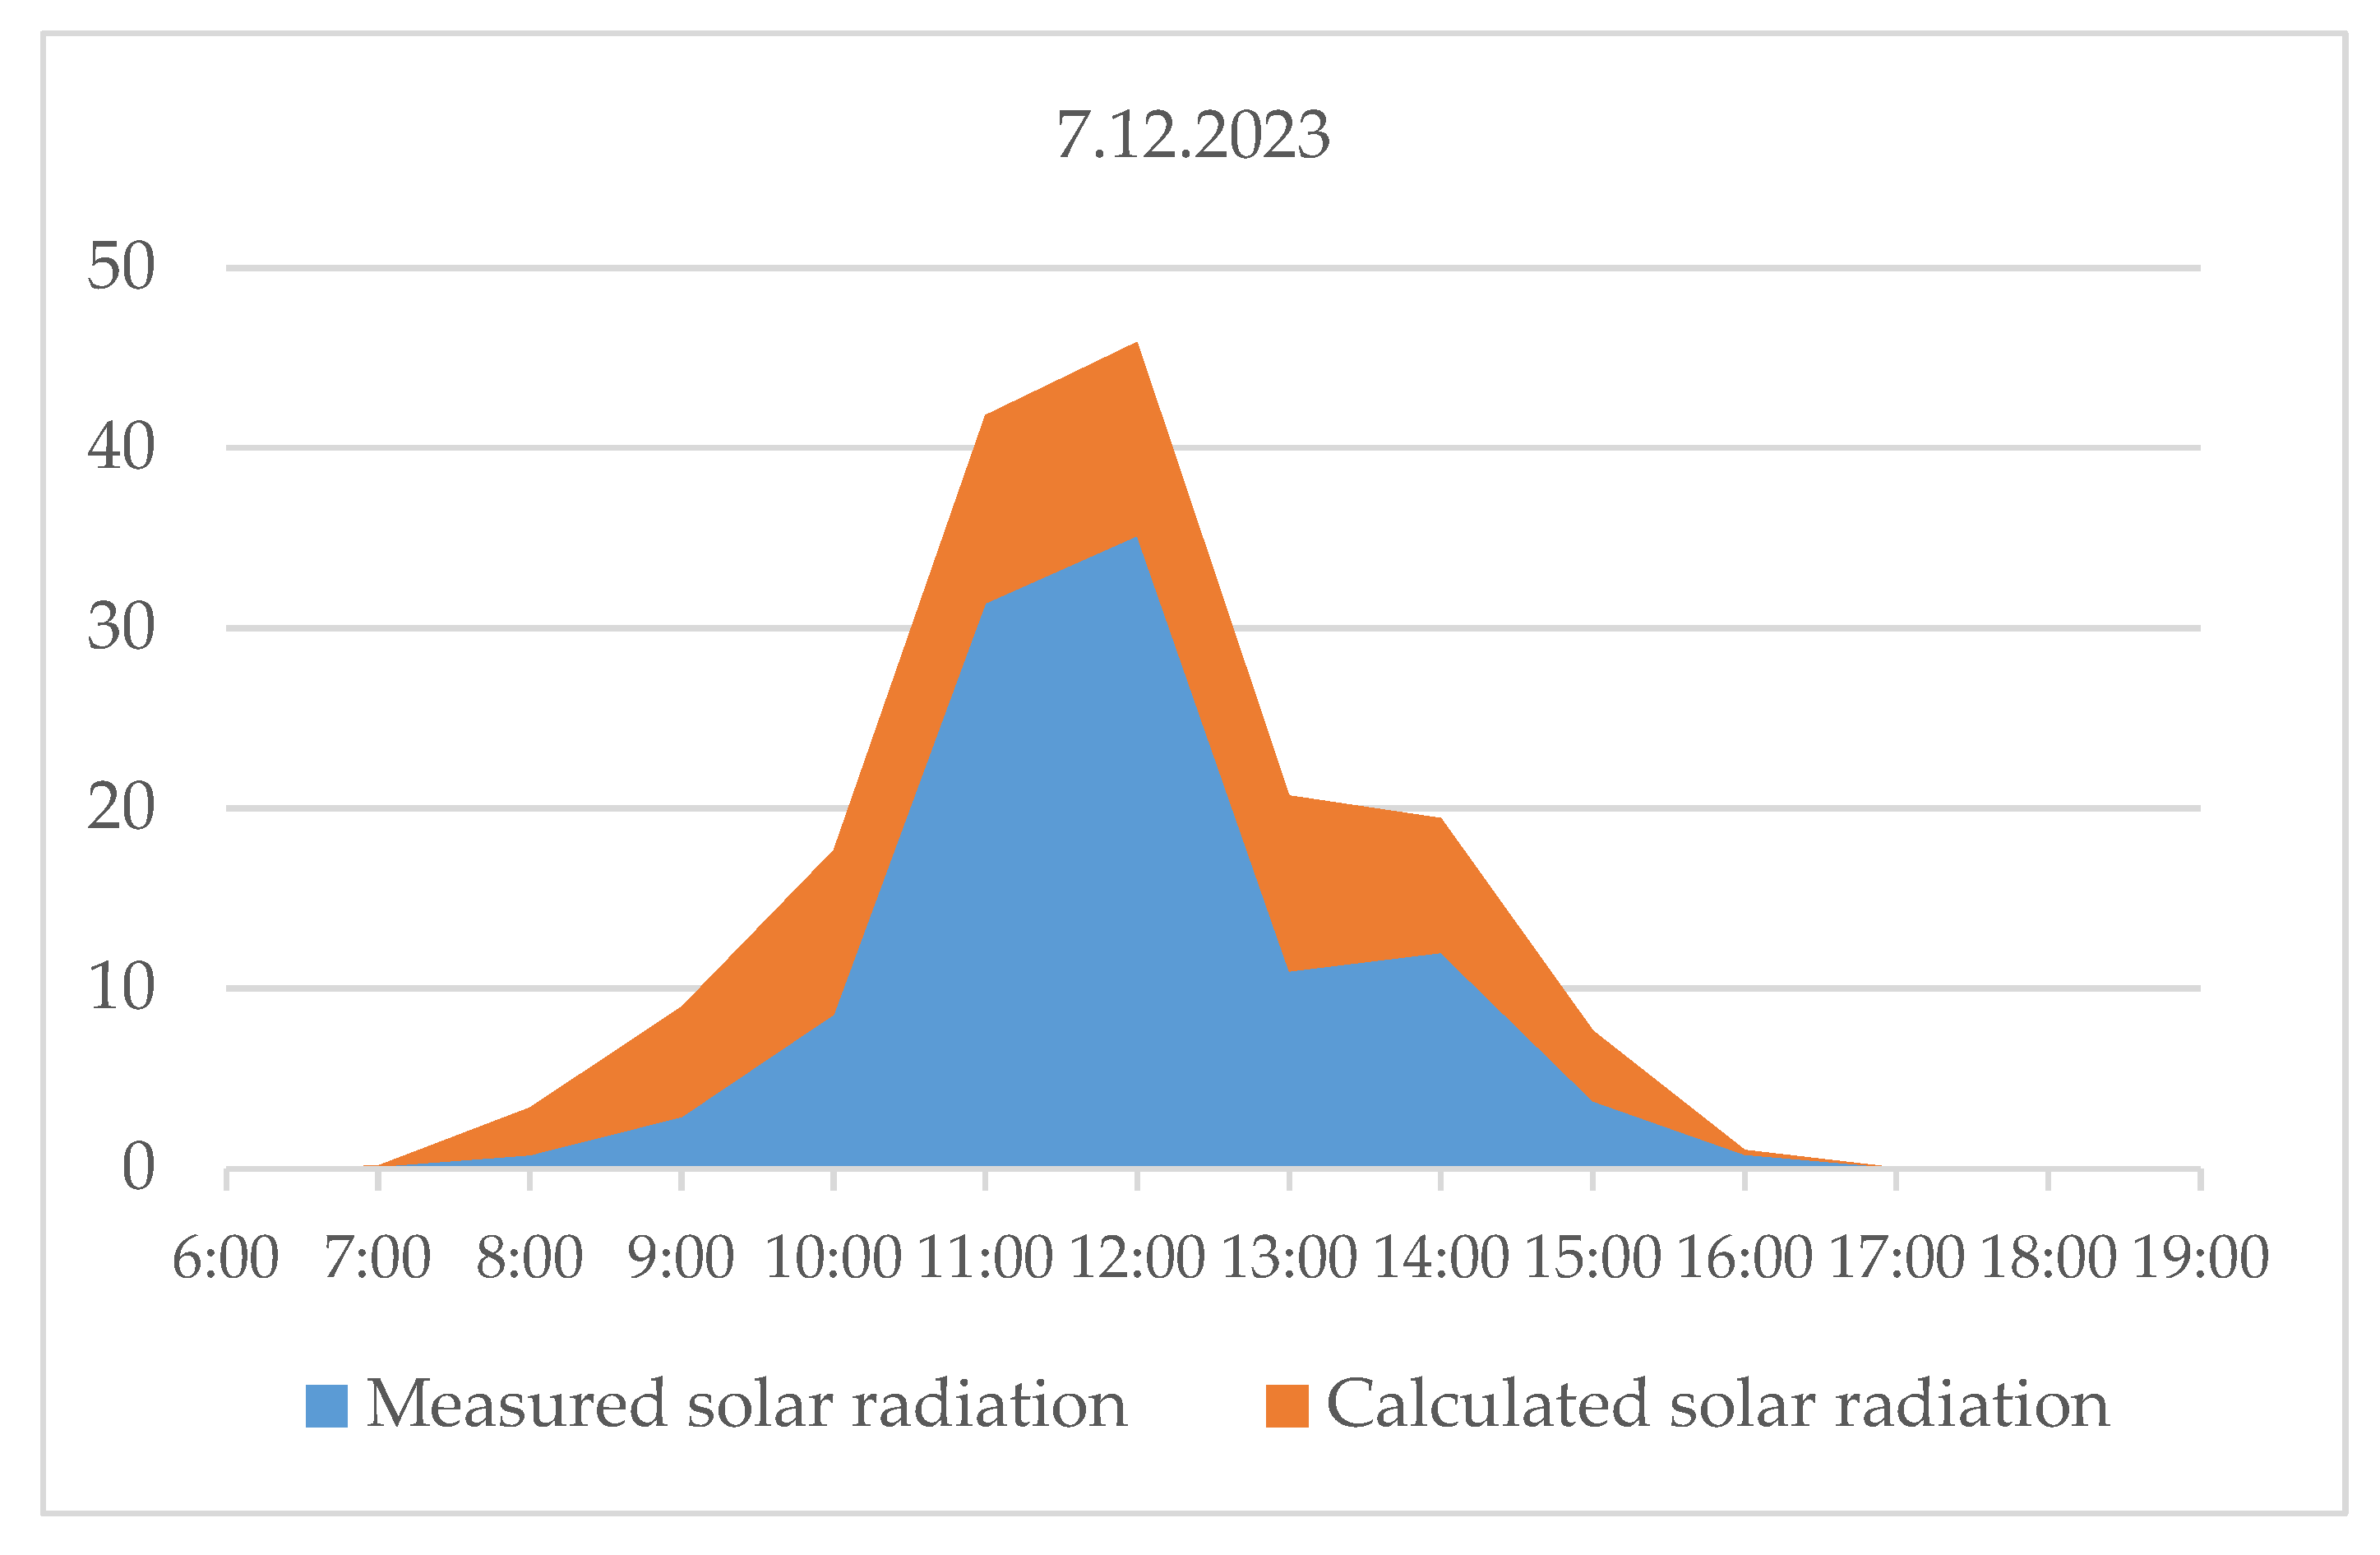
Figure 14 presents an hourly comparison of measured and simulated solar irradiance for 7 December 2023. The chart shows the measured and simulated irradiance values throughout the day.
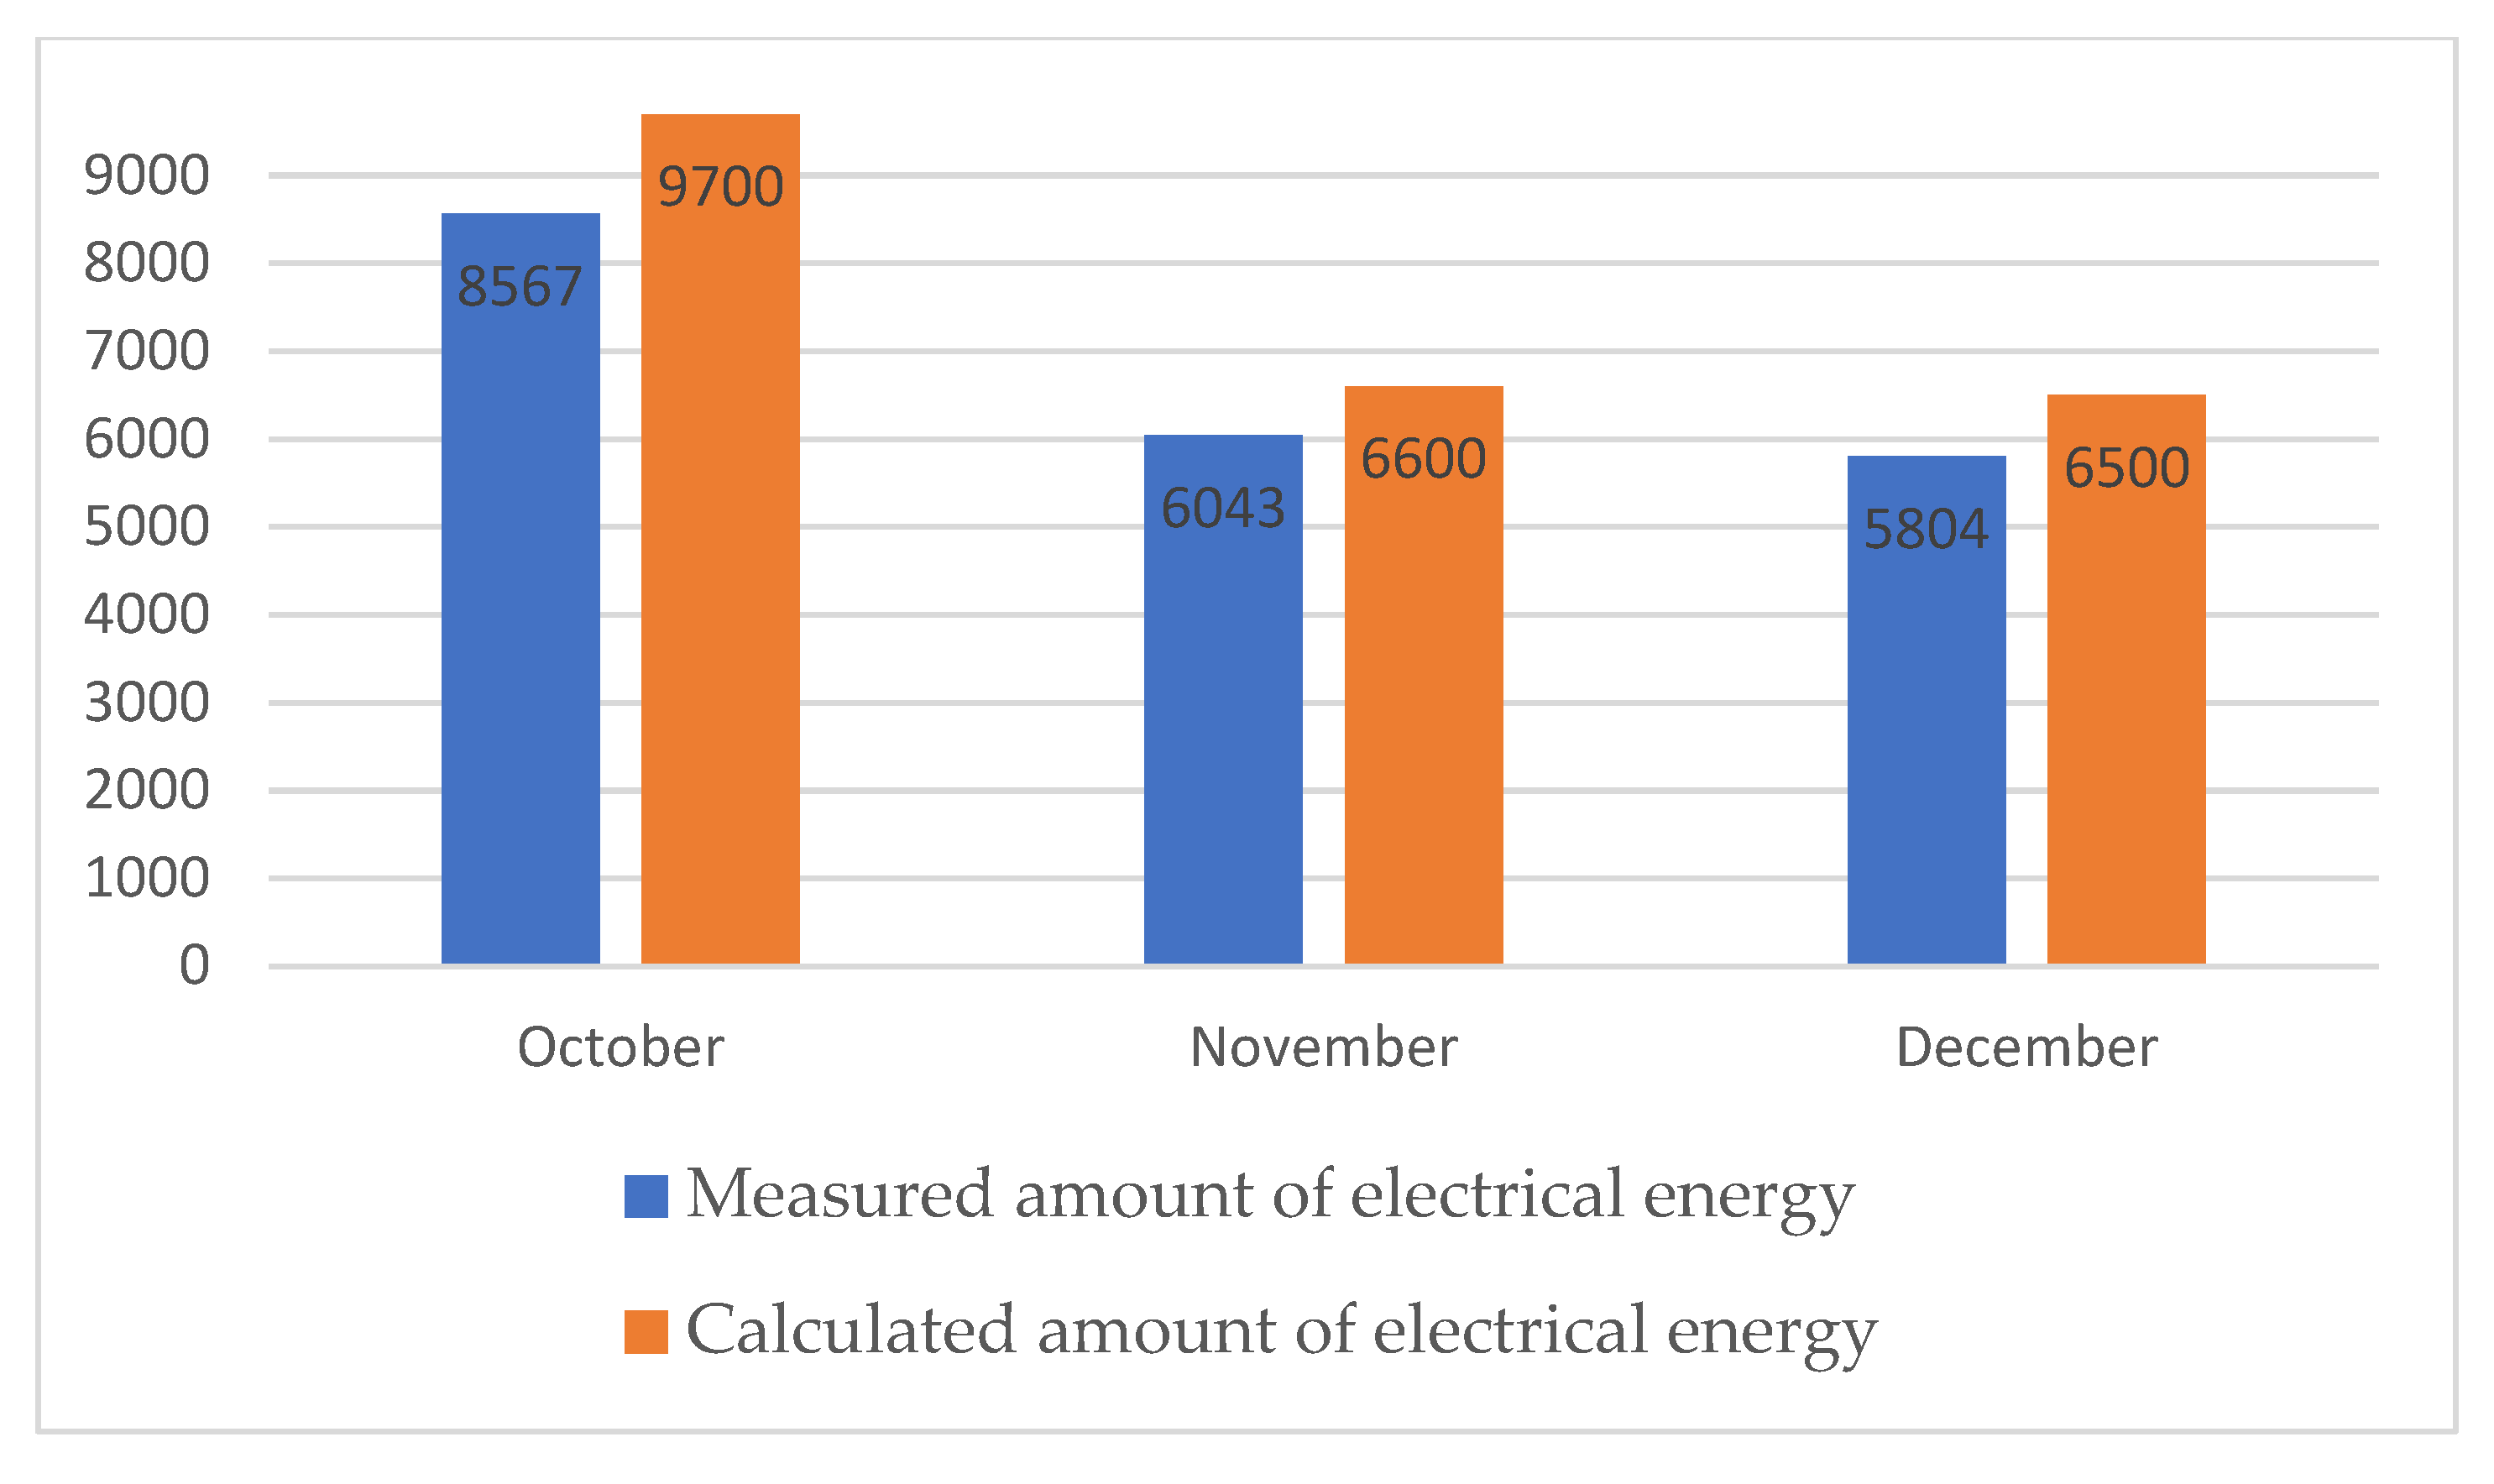
Figure 15 presents a monthly comparison of measured and simulated electrical energy production for October, November, and December 2023. The chart illustrates the total energy generated based on real measurements and PV*Sol Expert simulations.
4. Obtained Results
The experimental setup included an RG-P100W photovoltaic panel, a solar charge controller, a PZEM-031 DC multifunctional measuring device, a LAVA 12V/18Ah battery, and a support structure. An identical model of the system was constructed in the PV*Sol Expert simulation environment.
Measurements were carried out daily over a three-month period—October, November, and December 2023. Collected data included electrical current, power, and solar irradiance. The same parameters were simulated in PV*Sol Expert using identical input conditions: location, panel configuration, tilt angle, and weather data from PVGIS.
Results are presented in the form of monthly and daily figures that compare the measured and simulated values of power and irradiance. In addition, hourly data were analyzed for three representative days—7 October, 7 November, and 7 December—to assess short-term variations and dynamic behavior.
The simulation consistently predicted higher values compared to actual measurements. The monthly energy production showed the following differences:
In October, measured energy was approximately 12% lower than the simulated result, marking the greatest deviation.
In November, the difference was about 8%.
In December, measured output was 11% lower than simulated.
Average power output also showed noticeable gaps between measured and simulated values as follows:
For solar irradiance:
These results demonstrate that while the simulation provides a reliable estimate, it systematically overestimates actual system performance. This trend is especially visible in the autumn-winter months, when reduced solar angles, shorter day lengths, and increased atmospheric variability (e.g., cloud cover and humidity) significantly affect real irradiance and energy output. Moreover, simulation software generally assumes clean module surfaces, optimal thermal conditions, and uniform irradiance, which are rarely matched under real-world conditions. Even minor deviations—such as dust accumulation on the panel or unnoticed partial shading—can contribute to observed performance gaps. Therefore, deviations of this magnitude should be expected and considered when planning system performance or return-on-investment projections.
5. Discussion and Conclusions
The comparison between the simulated results from PV*Sol Expert and the real-world measurements from the test system in Plovdiv highlights several important findings.
Although PV*Sol Expert consistently predicts higher values for energy production, power, and irradiance, the differences remain within acceptable engineering tolerances. This confirms that the system is performing well and that the simulation is broadly accurate, though slightly optimistic.
Need for calibration: Differences of 8–12% between simulated and measured energy suggest that simulation models should be calibrated with local data when possible, especially for sites with complex or seasonally variable conditions.
Real-world variability: Environmental conditions such as cloud cover, shading, atmospheric dust, and temperature fluctuations introduce performance variations that standard simulations may not fully capture. The autumn and early winter months are particularly susceptible to such influences, leading to more noticeable discrepancies.
Hourly analysis as a diagnostic tool: Reviewing hourly data on selected days helped identify specific periods of mismatch and validated the trends seen in the monthly totals. Some days showed brief but significant underperformance, illustrating that even when the monthly energy balance appears consistent, the system may experience hourly deficits that could disrupt off-grid operations.
Simulation remains a strong planning resource: Despite its tendency to overestimate, PV*Sol Expert remains a valuable tool for system design, forecasting, and comparative analysis, particularly when enhanced by empirical validation. It enables designers and investors to estimate long-term performance, assess shading and orientation options, and compare different configurations.
The results reinforce the importance of combining simulations with real measurements to ensure accurate expectations and optimized photovoltaic system planning. From a financial or operational perspective, it is advisable to apply a tolerance margin—typically ±10%—to simulation outputs to account for day-to-day variability and to ensure that system dimensioning and return-on-investment calculations remain robust under real-world conditions. This approach increases the reliability of PV system deployment, particularly in climates with pronounced seasonal variation.
