
Investigation of Technological System Stability During Side Milling †


Abstract
1. Introduction
2. Materials and Methods
3. Results
4. Discussion
5. Conclusions
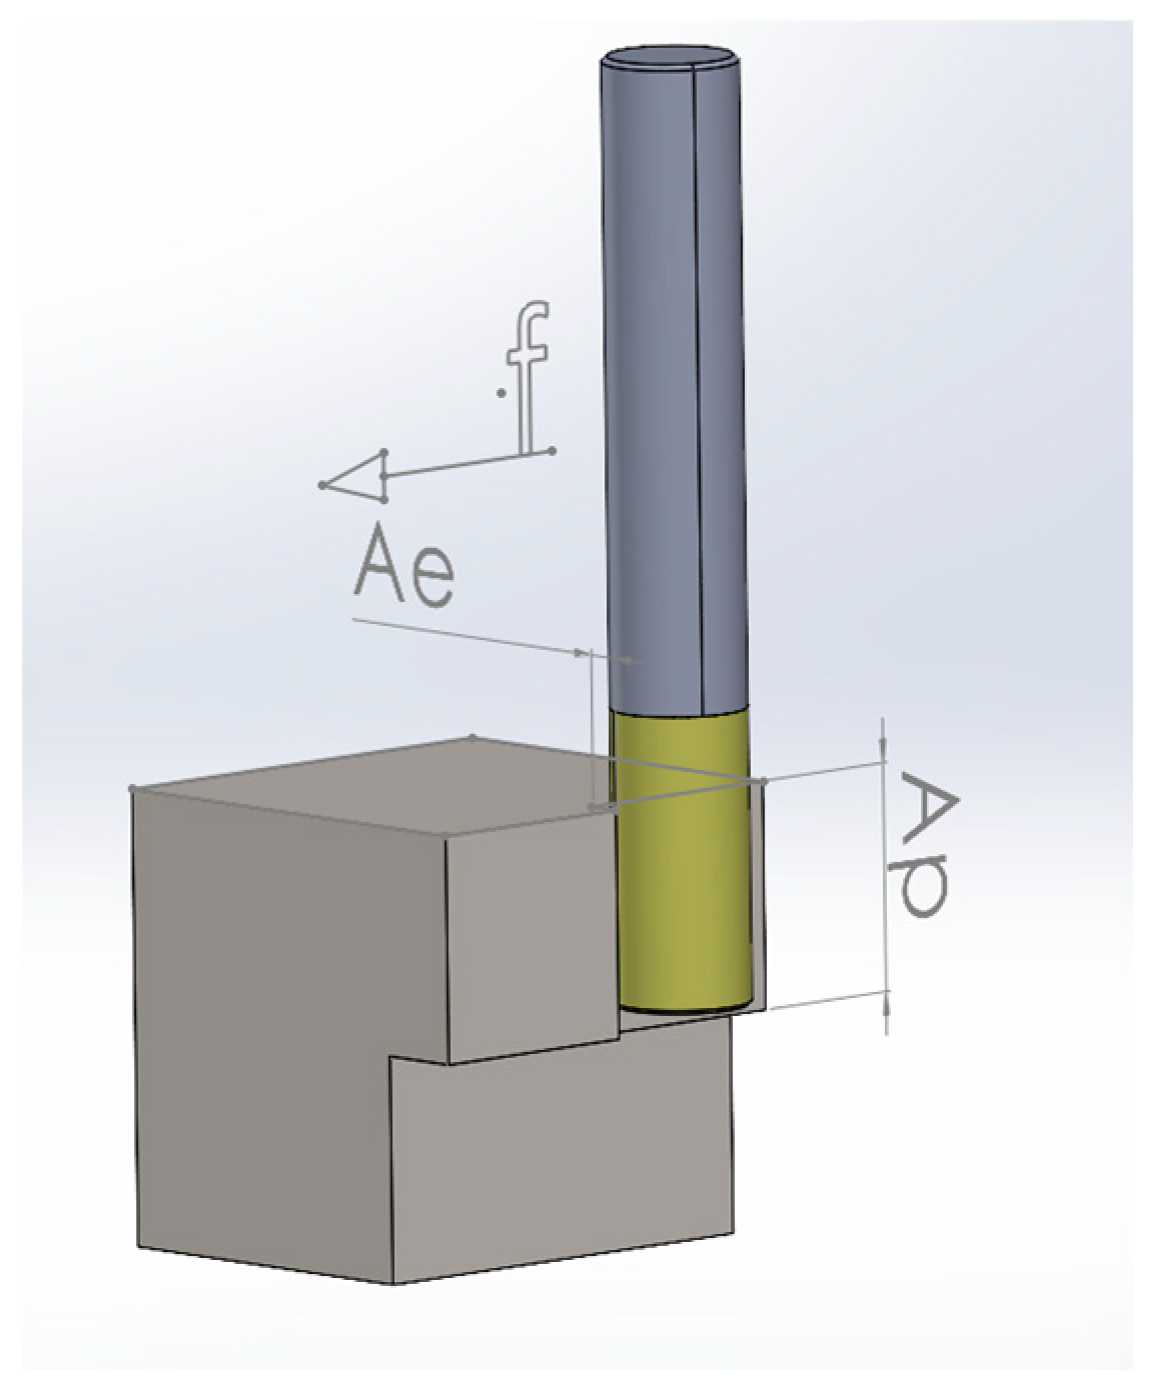
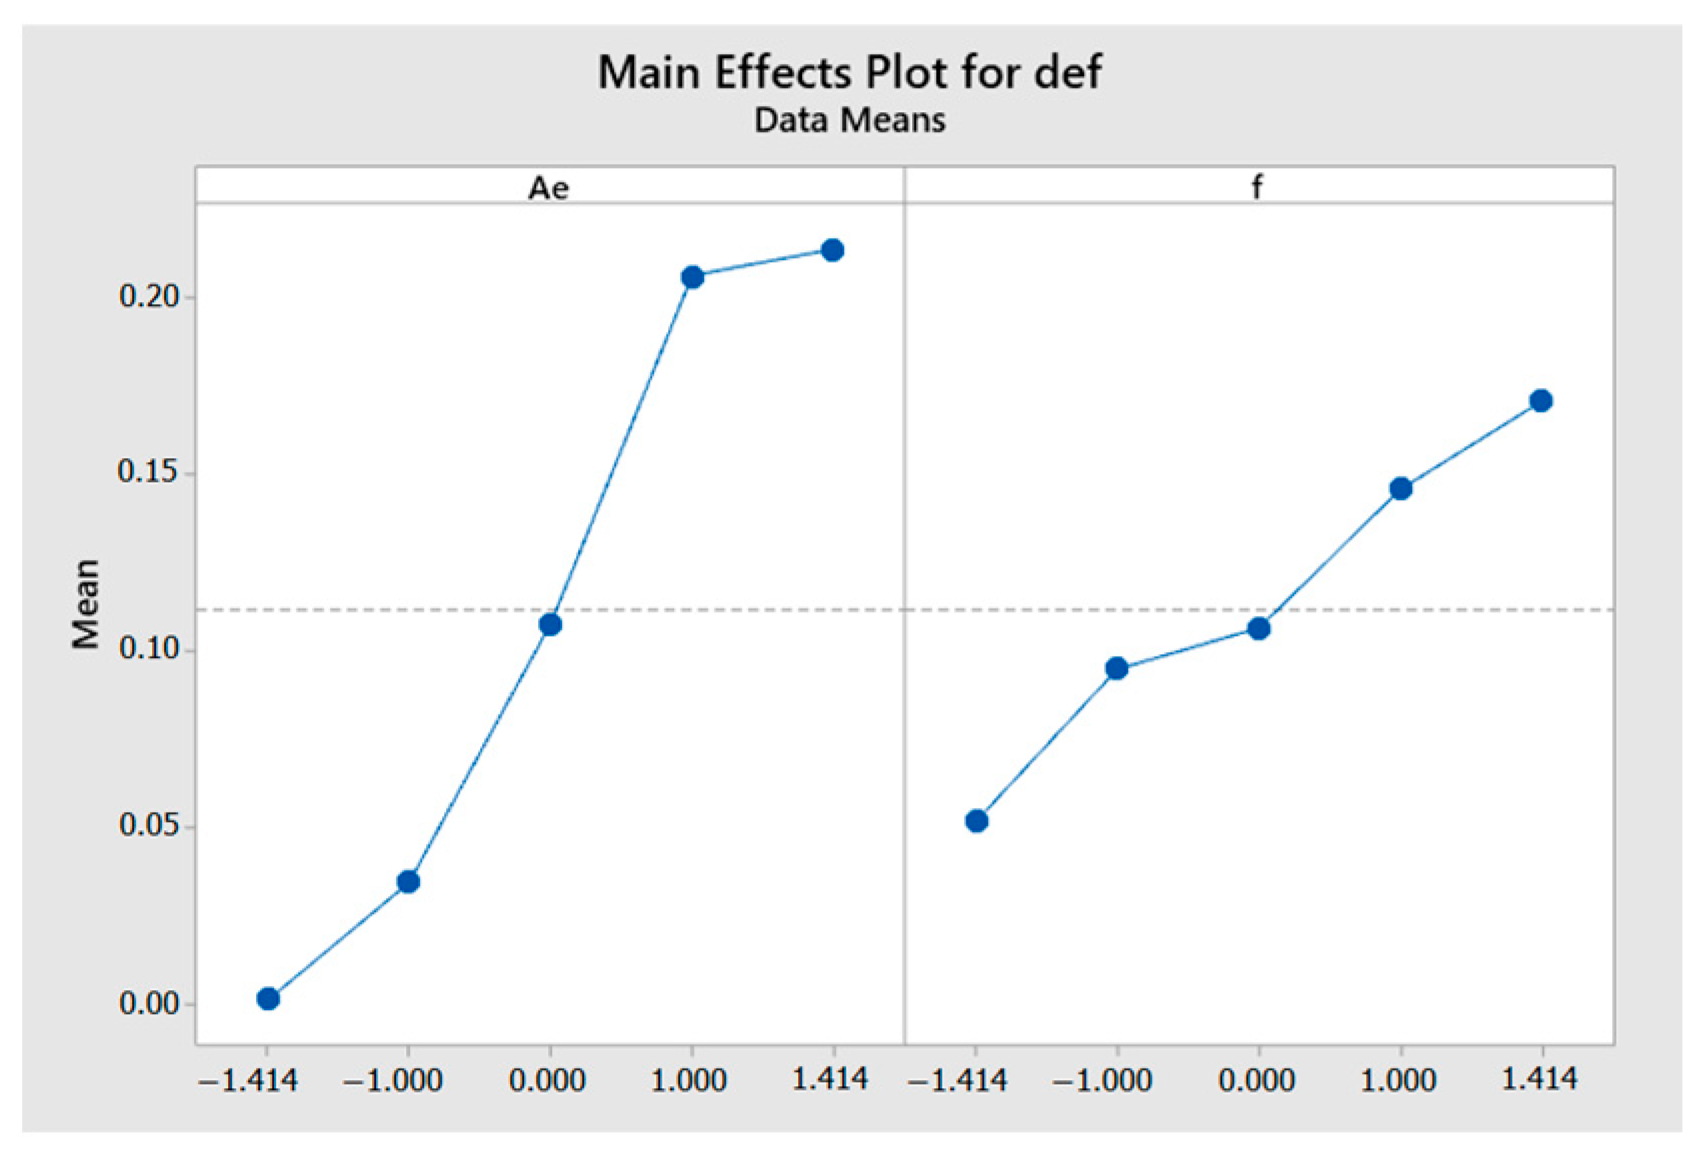
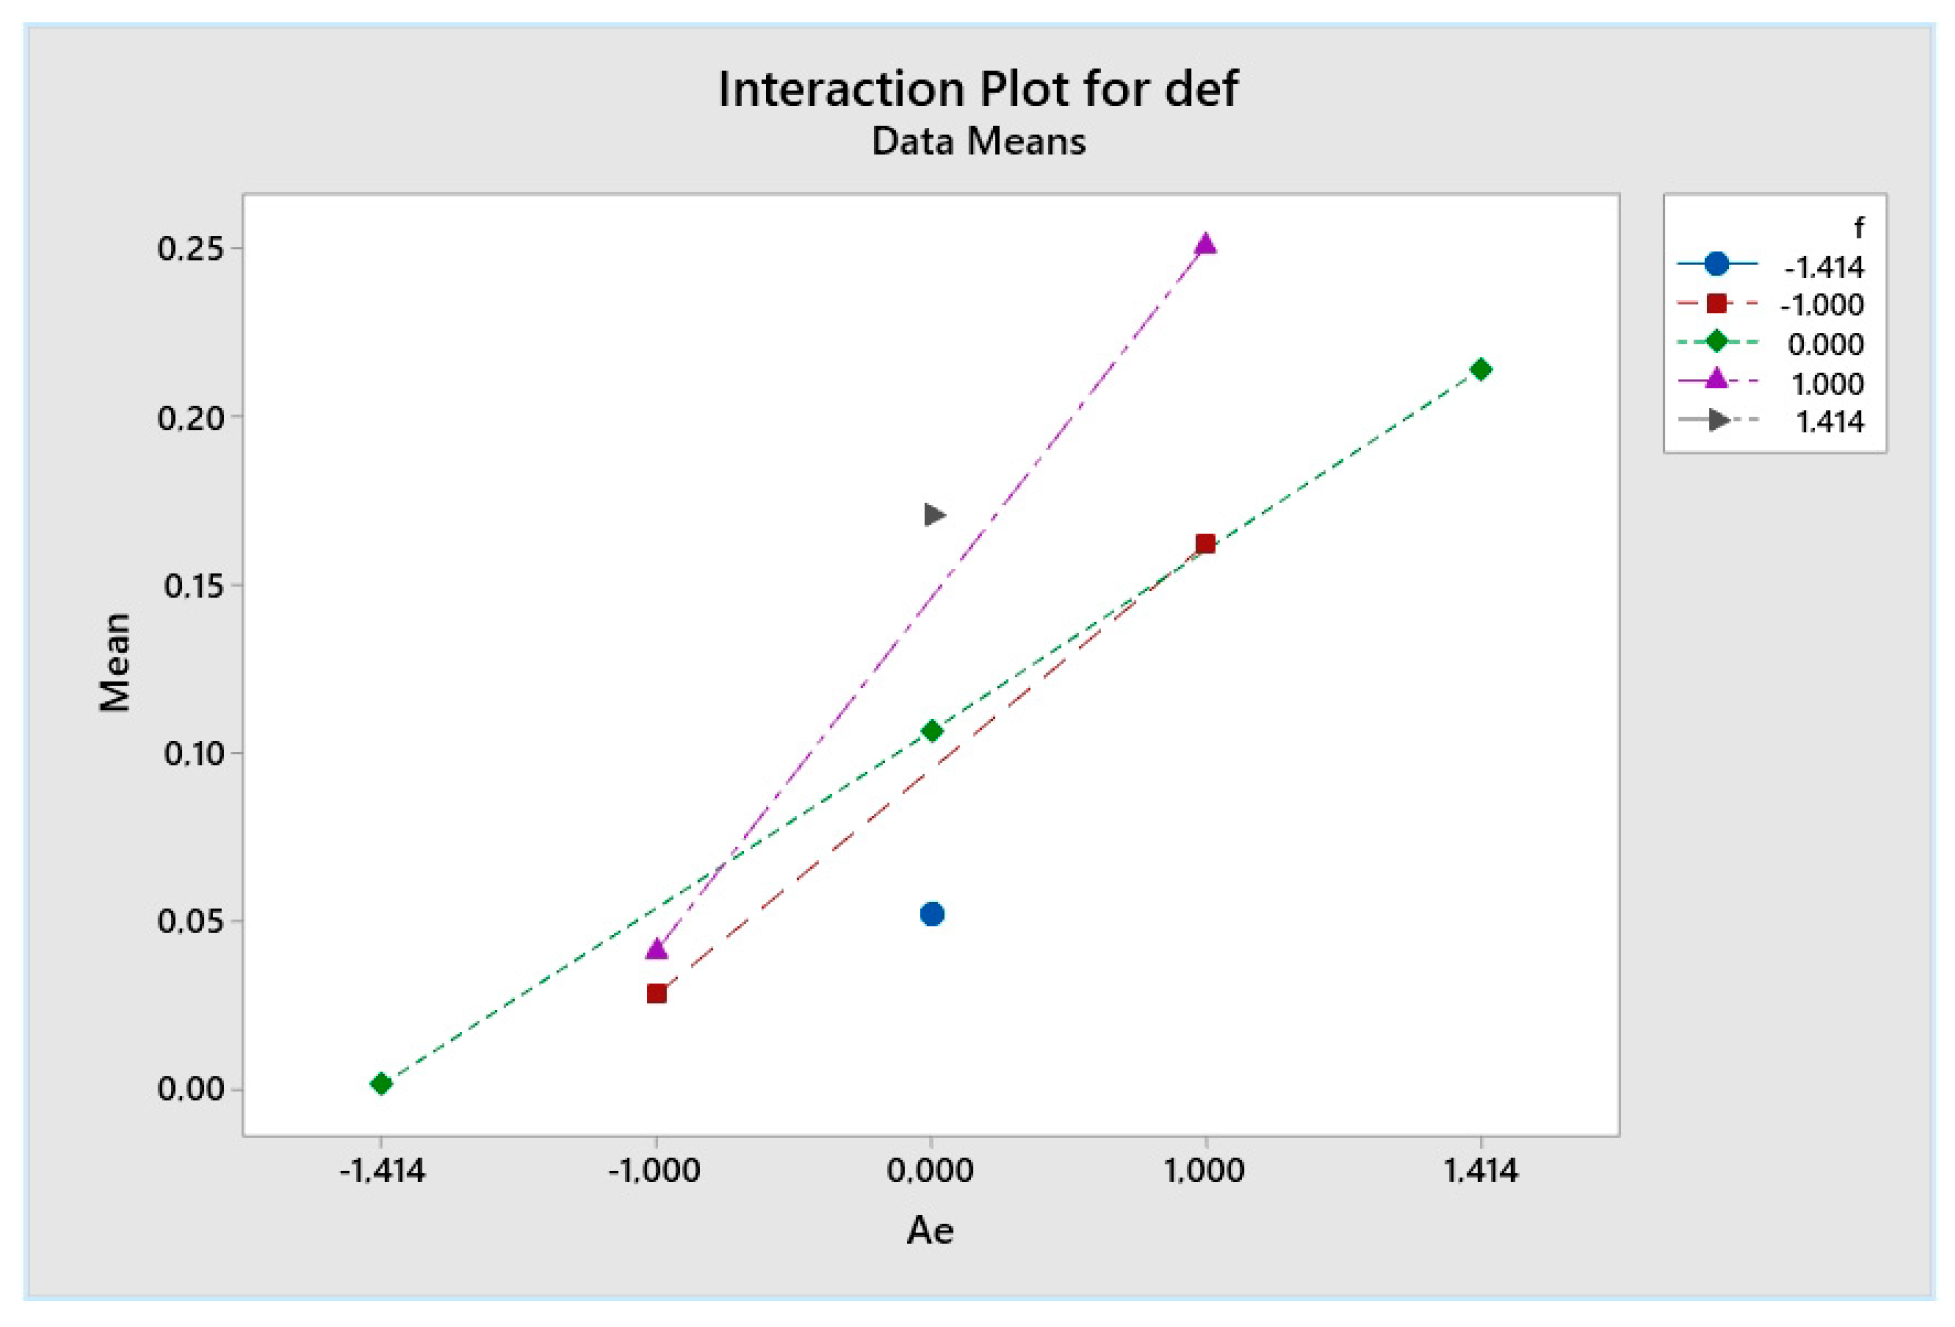
- The radial depth of cut (Ae) is the dominant factor, responsible for 81.17% of variance.
- Feed per tooth (fz) has a secondary, yet statistically significant effect.
- The regression model provides a reliable tool for predicting deformations and optimizing parameters.
Author Contributions
Funding
Institutional Review Board Statement
Informed Consent Statement
Data Availability Statement
Conflicts of Interest
References
- Altintas, Y. Manufacturing Automation: Metal Cutting Mechanics, Machine Tool Vibrations, and CNC Design, 2nd ed.; Cambridge University Press: Cambridge, UK, 2012. [Google Scholar] [CrossRef]
- Altintaş, Y.; Budak, E. Stability Prediction in Milling Processes. CIRP Ann. 1995, 44, 393–398. [Google Scholar] [CrossRef]
- Brecher, C.; Esser, M.; Witt, S. Interaction of Manufacturing Process and Machine Tool. CIRP Ann. 2009, 58, 588–607. [Google Scholar] [CrossRef]
- Quintana, G.; Ciurana, J. Chatter in Machining Processes: A Review. Int. J. Mach. Tools Manuf. 2011, 51, 363–376. [Google Scholar] [CrossRef]
- Armarego, E.J.A.; Deshpande, N.P. Computerized End-Milling Force Predictions with Cutting Models Allowing for Eccentricity and Cutter Deflections. CIRP Ann. 1991, 40, 25–29. [Google Scholar] [CrossRef]
- Xie, M.; Yu, X.; Bao, W.; Liu, C.; Xia, M. Side-Milling-Force Model Considering Tool Runout and Workpiece Deformation. Electronics 2023, 12, 968. [Google Scholar] [CrossRef]
- Krishnaraj, V.; Samsudeensadham, S.; Sindhumathi, R.; Kuppan, P. A study on High Speed End Milling of Titanium Alloy. Procedia Eng. 2014, 97, 251–257. [Google Scholar] [CrossRef]
- Zheng, Y.; Zhao, Z.; Xu, B.; Yu, Y.; Xu, J. A method to predict chatter stability accurately in milling thin-walled parts by considering force-induced deformation. J. Manuf. Process. 2023, 106, 552–563. [Google Scholar] [CrossRef]
- Jin, G.; Qi, H.; Li, Z.; Han, J. Dynamic modeling and stability analysis for the combined milling system with variable pitch cutter and spindle speed variation. Commun. Nonlinear Sci. Numer. Simul. 2018, 63, 38–56. [Google Scholar] [CrossRef]
- ASTM A606/A606M–18; Standard Specification for Steel, Sheet and Strip, High-Strength, Low-Alloy, Hot-Rolled and Cold-Rolled, with Improved Atmospheric Corrosion Resistance. ASTM International: West Conshohocken, PA, USA, 2018.
- Mohanraj, T.; Shankar, S.; Rajasekar, R.; Sakthivel, N.R.; Pramanik, A. Tool condition monitoring techniques in milling process—A review. J. Mater. Res. Technol. 2020, 9, 1032–1042. [Google Scholar] [CrossRef]
- Insperger, T.; Stépán, G. Semi-Discretization for Time-Delay Systems: Stability and Engineering Applications; Springer: Berlin/Heidelberg, Germany, 2011. [Google Scholar] [CrossRef]
- Koenigsberger, F.; Tlusty, J. Machine Tool Structures; Pergamon Press: Oxford, UK, 1970; ISBN 13 978-0-08-010346-1. [Google Scholar]
- Pandey, K.; Datta, S. Hot machining of difficult-to-cut materials: A review. Mater. Today Proc. 2021, 44, 2710–2715. [Google Scholar] [CrossRef]
- Fanning, P. Renishaw–50 Years of Innovation. Manuf. Manag. 2023, 5, 10–12. [Google Scholar] [CrossRef]
- Jack, H. Renishaw automate programming and machining to micron accuracy. Sens. Rev. 1997, 17, 223–230. [Google Scholar] [CrossRef]
- Bhuyean, M. Analysis of Variance (ANOVA): A Statistical Review. Paripex Indian J. Res. 2025, 14, 69–70. [Google Scholar] [CrossRef]
- Jin, X.; Altintas, Y. Chatter Stability Model of Micro-Milling With Process Damping. J. Manuf. Sci. Eng. 2013, 135, 031011. [Google Scholar] [CrossRef]
- Catania, G.; Mancinelli, N. Theoretical–experimental modeling of milling machines for the prediction of chatter vibration. Int. J. Mach. Tools Manuf. 2011, 51, 339–348. [Google Scholar] [CrossRef]


| # | Level Ae | Level f | Ae Mm | Fz mm/z | Vc m/min |
|---|---|---|---|---|---|
| 1 | 0 | 0 | 3 | 0.04 | 120 |
| 2 | 0 | 0 | 3 | 0.04 | 120 |
| 3 | −1 | −1 | 1 | 0.06 | 120 |
| 4 | 0 | 0 | 3 | 0.04 | 120 |
| 5 | 0 | 1.414 | 3 | 0.068 | 120 |
| 6 | 0 | −1.414 | 3 | 0.011 | 120 |
| 7 | 1.414 | 0 | 5.82 | 0.04 | 120 |
| 8 | 0 | 0 | 3 | 0.04 | 120 |
| 9 | 1 | −1 | 5 | 0.02 | 120 |
| 10 | 1 | 1 | 5 | 0.06 | 120 |
| 11 | −1.414 | 0 | 0.18 | 0.04 | 120 |
| 12 | −1 | 1 | 1 | 0.06 | 120 |
| 13 | 0 | 0 | 3 | 0.04 | 120 |
| # | Level Ae | Level Fz | Response mm |
|---|---|---|---|
| 1 | 0 | 0 | 0.090 |
| 2 | 0 | 0 | 0.099 |
| 3 | −1 | −1 | 0.028 |
| 4 | 0 | 0 | 0.112 |
| 5 | 0 | 1.414 | 0.171 |
| 6 | 0 | −1.414 | 0.052 |
| 7 | 1.414 | 0 | 0.214 |
| 8 | 0 | 0 | 0.126 |
| 9 | 1 | −1 | 0.162 |
| 10 | 1 | 1 | 0.251 |
| 11 | −1.414 | 0 | 0.001 |
| 12 | −1 | 1 | 0.041 |
| 13 | 0 | 0 | 0.105 |
| Term | Coef | SE Coef | 95% CI | T-Value | p-Value | VIF |
|---|---|---|---|---|---|---|
| Constant | 0.11058 | 0.00458 | (0.10037, 0.12079) | 24.13 | 0.000 | |
| Ae | 0.08138 | 0.00584 | (0.06836, 0.09440) | 13.93 | 0.000 | 1.00 |
| fz | 0.03457 | 0.00584 | (0.02155, 0.04759) | 5.92 | 0.000 | 1.00 |
| S | R-sq | R-sq (adj) | PRESS | R-sq (pred) | AICc | BIC |
|---|---|---|---|---|---|---|
| 0.0165261 | 95.82% | 94.98% | 0.0051733 | 92.07% | −60.19 | −62.93 |
| Source | DF | Seq SS | Contribution | Adj SS | Adj MS | F-Value | p-Value |
|---|---|---|---|---|---|---|---|
| Regression | 2 | 0.062541 | 95.82% | 0.062541 | 0.031270 | 114.50 | 0.000 |
| Ae | 1 | 0.052979 | 81.17% | 0.052979 | 0.052979 | 193.98 | 0.000 |
| fz | 1 | 0.009562 | 14.65% | 0.009562 | 0.009562 | 35.01 | 0.000 |
| Error | 10 | 0.002731 | 4.18% | 0.002731 | 0.000273 | ||
| Lack of Fit | 6 | 0.001995 | 3.06% | 0.001995 | 0.000332 | 1.81 | 0.295 |
| Pure Error | 4 | 0.000737 | 1.13% | 0.000737 | 0.000184 | ||
| Total | 12 | 0.065272 | 100.00% |
Disclaimer/Publisher’s Note: The statements, opinions and data contained in all publications are solely those of the individual author(s) and contributor(s) and not of MDPI and/or the editor(s). MDPI and/or the editor(s) disclaim responsibility for any injury to people or property resulting from any ideas, methods, instructions or products referred to in the content. |
© 2025 by the authors. Licensee MDPI, Basel, Switzerland. This article is an open access article distributed under the terms and conditions of the Creative Commons Attribution (CC BY) license (https://creativecommons.org/licenses/by/4.0/).
Share and Cite
Chetrokov, I.; Sabev, S.; Kasabov, P. Investigation of Technological System Stability During Side Milling. Eng. Proc. 2025, 100, 24. https://doi.org/10.3390/engproc2025100024
Chetrokov I, Sabev S, Kasabov P. Investigation of Technological System Stability During Side Milling. Engineering Proceedings. 2025; 100(1):24. https://doi.org/10.3390/engproc2025100024
Chicago/Turabian StyleChetrokov, Iliya, Sabi Sabev, and Plamen Kasabov. 2025. "Investigation of Technological System Stability During Side Milling" Engineering Proceedings 100, no. 1: 24. https://doi.org/10.3390/engproc2025100024
APA StyleChetrokov, I., Sabev, S., & Kasabov, P. (2025). Investigation of Technological System Stability During Side Milling. Engineering Proceedings, 100(1), 24. https://doi.org/10.3390/engproc2025100024