Abstract
This study investigates the spatial distribution of transition metals—iron (Fe), titanium (Ti), and chromium (Cr)—within the Dryden crater on the Moon using hyperspectral data from the Moon Mineralogy Mapper (M3). By applying spectral parameters and false color composite techniques, geospatial maps of chromite distribution and FeO, TiO2 wt.% distribution were generated at a resolution of ~140 m. The findings reveal distinct elemental enrichments along geomorphologically active regions such as crater walls, terraces, and central peaks, highlighting impact-driven material differentiation, the influence of morphology, degradation, and space weathering. These results enhance our understanding of lunar crustal evolution and support future exploration and resource utilization efforts.
Keywords:
Moon; South Pole–Aitken basin; Apollo; Dryden; Moon Mineralogy Mapper; Fe; Ti; chromite; Cr 1. Introduction
The Moon’s surface composition preserves critical records of magmatic differentiation, impact-driven resurfacing, and volcanic processes that shaped its crustal heterogeneity [1,2]. Transition metals Fe, Ti, and Cr act as geochemical tracers, offering insights into planetary differentiation [1,2], volcanic flux, and mantle dynamics. Fe is predominantly hosted in mafic minerals like pyroxenes and ilmenite, indicating deep crustal materials [3]. Ti, concentrated in ilmenite (FeTiO3), indicates resource potential for in situ utilization [4]. Chromite (FeCr2O4) is the primary mineral source of chromium in the mining industry. However, high-resolution, spatially contextualized elemental mapping of these metals remains sparse for many far side features. This study presents geochemical maps of FeO, TiO2, and chromite within Dryden crater, a complex impact structure located in the South Pole–Aitken basin—one of the Moon’s oldest and deepest basins, known to expose deep crustal and possibly upper mantle materials. This work focuses on the localized, morphologically heterogeneous terrain of Dryden crater. The novelty of the study lies in (1) the fusion of M3 hyperspectral data with high-resolution topographic data from SLDEM2015, (2) the application of recent spectral indexes tailored for use with M3 data by Suárez-Valencia et al. (2024) [5], and (3) the spatial correlation between elemental distributions and morphological units (e.g., crater walls, slump terraces, central peak, etc.) of the crater. With our efforts, we aim to support future in situ resource utilization roadmaps [4].
2. Materials and Methods
2.1. Satelite Data
To delineate the spatial boundaries of Fe, Ti, and chromite, as well as the concentration gradients of FeO and titanium dioxide (TiO2) within Dryden Crater, we utilized hyperspectral image cube L2 M3G20090814T061444_V01_RFL data with a spectral resolution of 85 channels (460–3000 nm) and a spatial resolution of ~140 m, acquired by the M3 [6] available at the Planetary Data System of the National Aeronautics and Space Administration https://pds-imaging.jpl.nasa.gov/volumes/m3.html (accessed on 11 December 2024). In order to preserve the original spectral characteristics of the M3 L2 reflectance data no further calibration was applied prior to index extraction. We incorporated the Moon LRO LOLA—SELENE Kaguya TC DEM Merge 60N60S 59 m v1 (SLDEM2015) [7], which has a spatial resolution of 59 m and georeferenced the M3 image.
2.2. Applied Methods
To derive the maps, we integrated five spectral parameters specifically developed for use with M3 data, as proposed in [5,8]. We calculated the iron parameter (IP) [5,8], the FeO parameter in wt.% (FeO wt.%) [5,8], the Ti parameter (TP) [5,8], the TiO2 parameter in wt.% (TiO2 wt.%) [5,8], and the chromite parameter (CP) [5,8] by applying band math, as shown in Table 1.

Table 1.
Applied spectral indices to M3 data as proposed by Suárez-Valencia et al. (2024) [5] and Wu et al. (2012) [8].
After generating the indices, we utilized the raster color slice to visualize the density of Fe, Ti, and chromite in seven concentration classes in the resulting image maps of the Dryden lunar impact crater. The resulting maps present the spatial distribution and concentration gradients of FeO and TiO2, and the spatial distribution of chromite, the primary source of chromium (Cr) [9] in equirectangular map projection at a spatial resolution of ~140 m [10]. In previous research (see Ivanov & Filchev [11] for details), the SLDEM2015 dataset was also utilized to generate a morpho-stratigraphic map. The delineated morphological units derived from this map enabled the application of the spatial operations overlay, union, and dissolve within the System for Automated Geoscientific Analyses—Geographic Information System. These operations facilitated the integration with map layers of FeO and TiO2 concentrations (expressed in wt.%), which were classified into three categories: low, medium, and high (1, 2, and 3, respectively). This approach allowed for the extraction of statistical relationships between the defined morphological units and the corresponding elemental concentration levels.
3. Results and Discussions
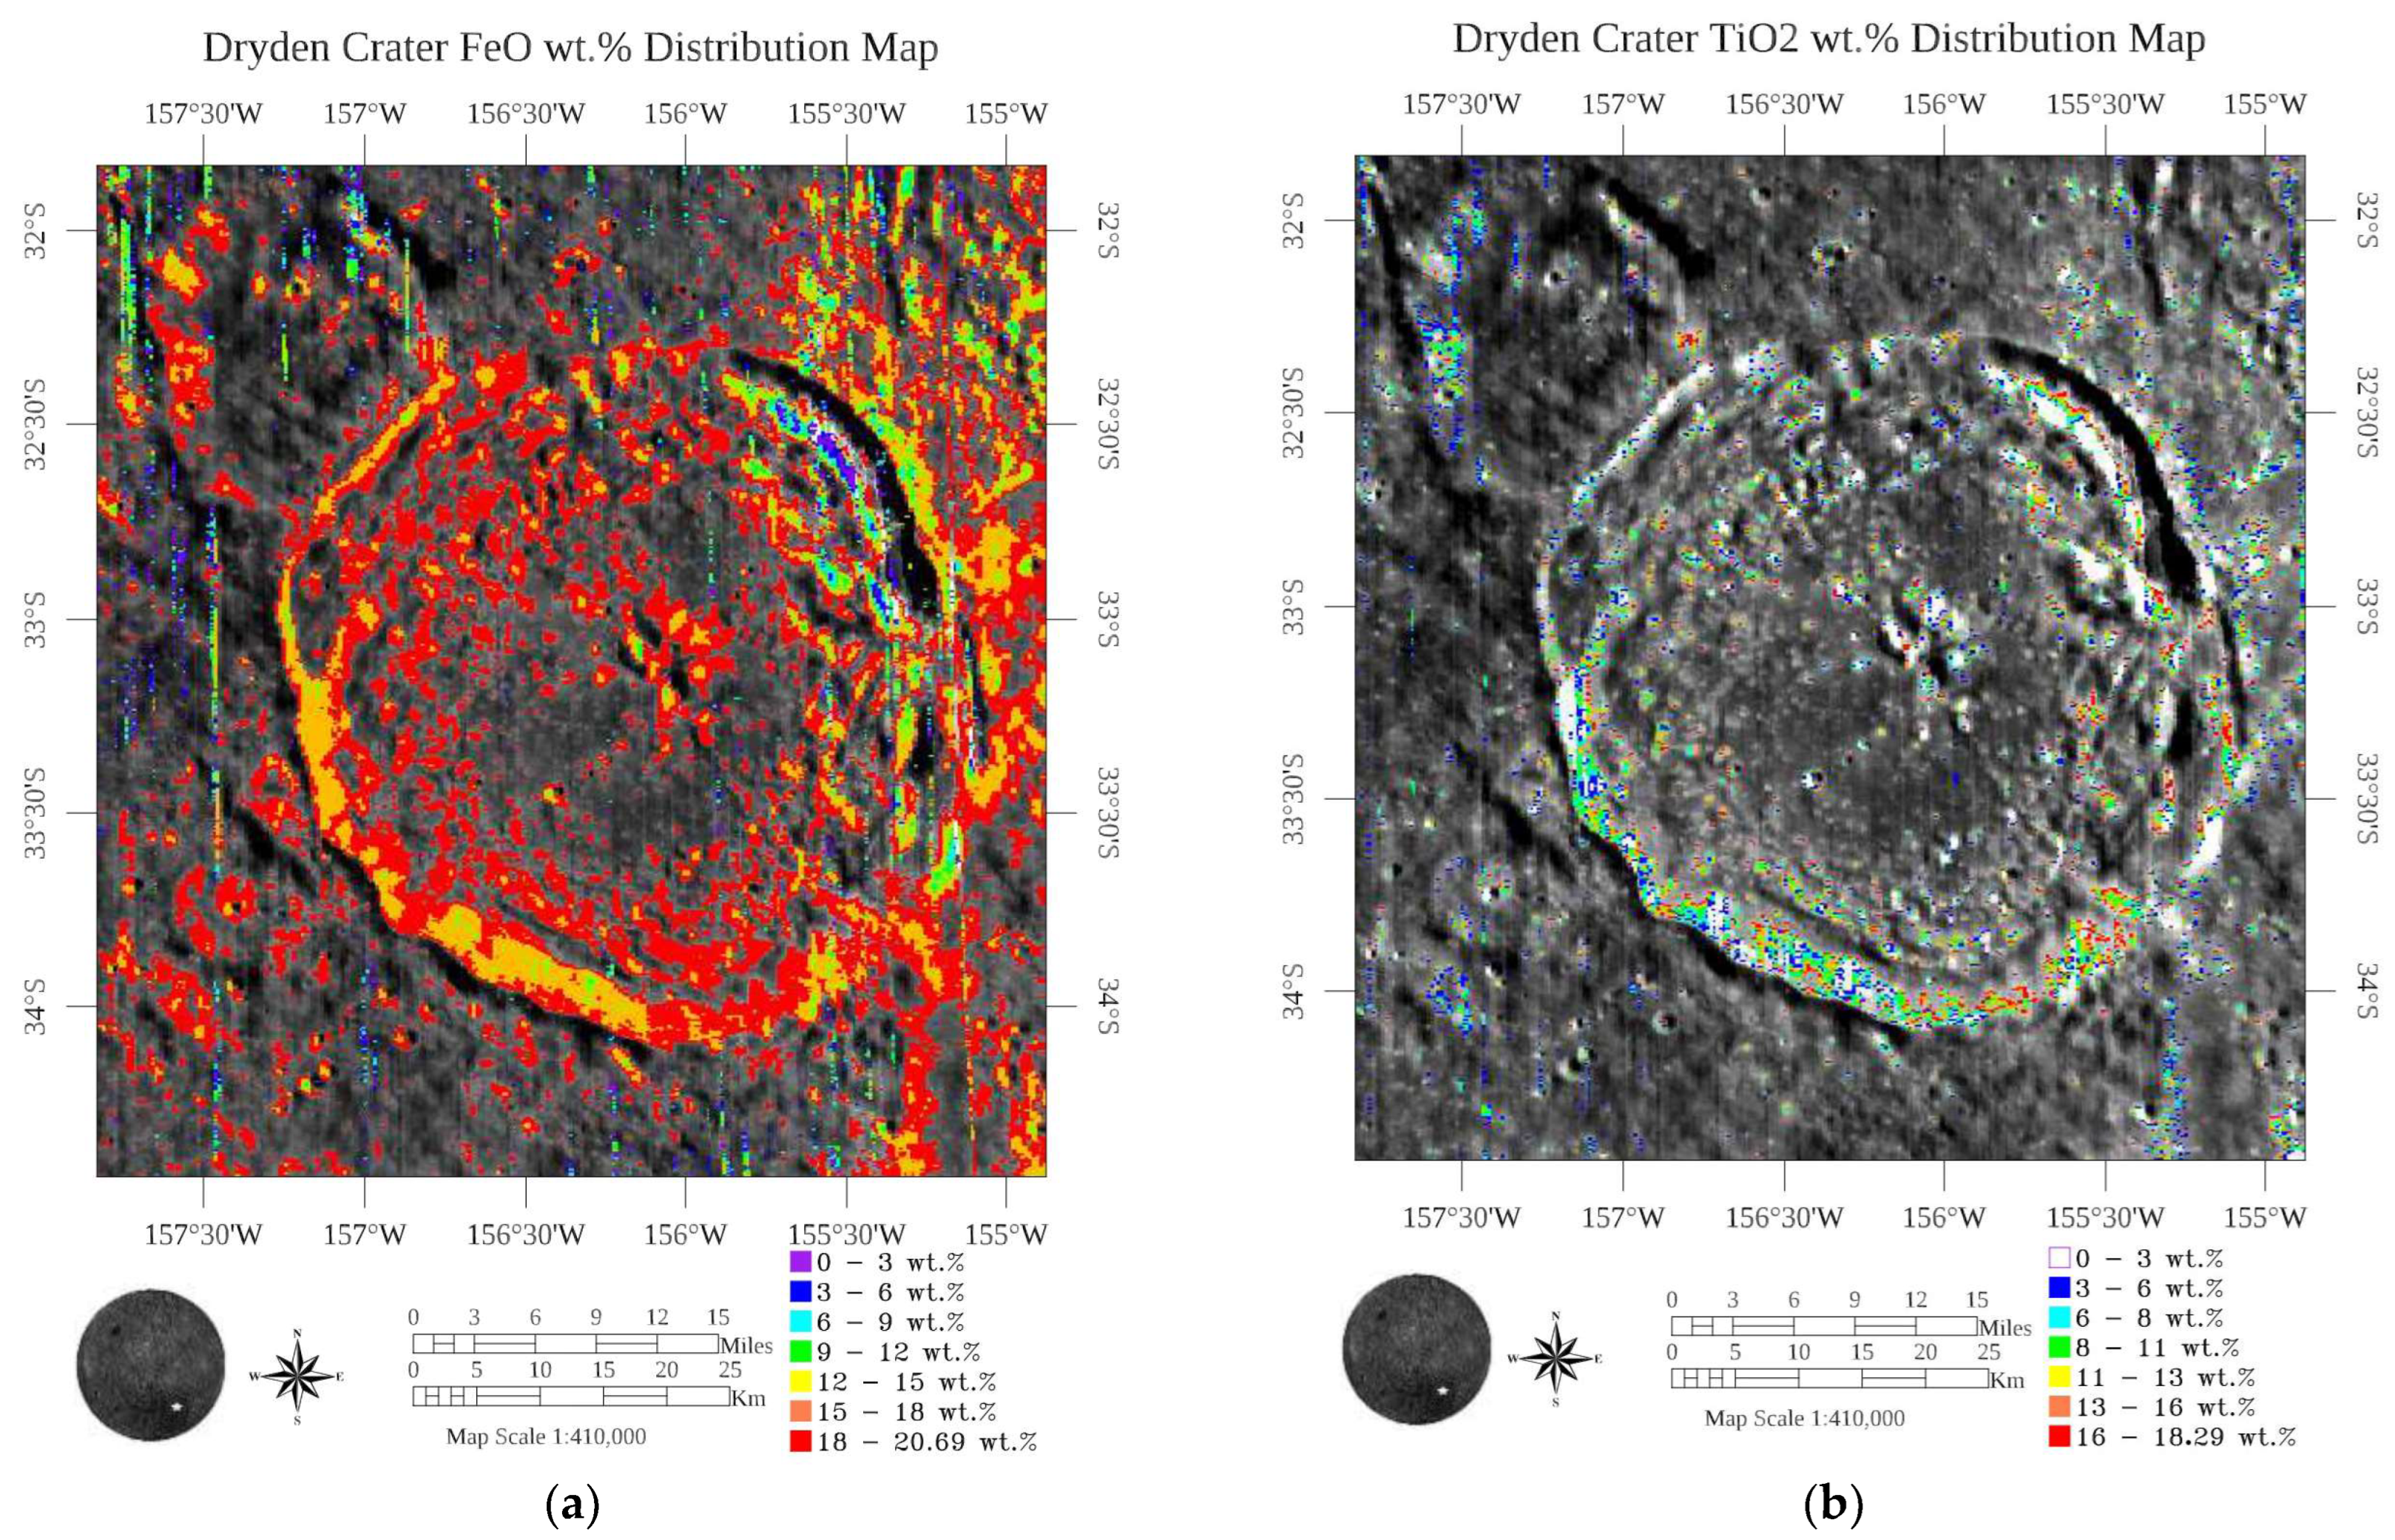
A parametric image of Fe content within Dryden crater was generated by applying the IP. Based on the Fe calculation, a parametric image of FeO wt.% content was generated (Figure 1a), revealing distinct spatial variations, with concentrations ranging from 0.0000 wt.% to 20.6865 wt.%, a mean value of 17.4860 wt.%, and a standard deviation of 4.0432 wt.%. The higher concentrations of FeO wt.% were mainly observed on the slopes of the central peak, crater wall, terraces, and hummocky terrain. Additionally, secondary features, including the slopes of small craters (~1 km in diameter) formed after Dryden’s formation, also showed elevated FeO levels. These regions, characterized by geomorphological activity, displayed FeO values >13 wt.% (Figure 1a and Figure 2b).

Figure 1.
(a) Dryden crater FeO wt.% distribution map; (b) Dryden crater TiO2 wt.% distribution map.

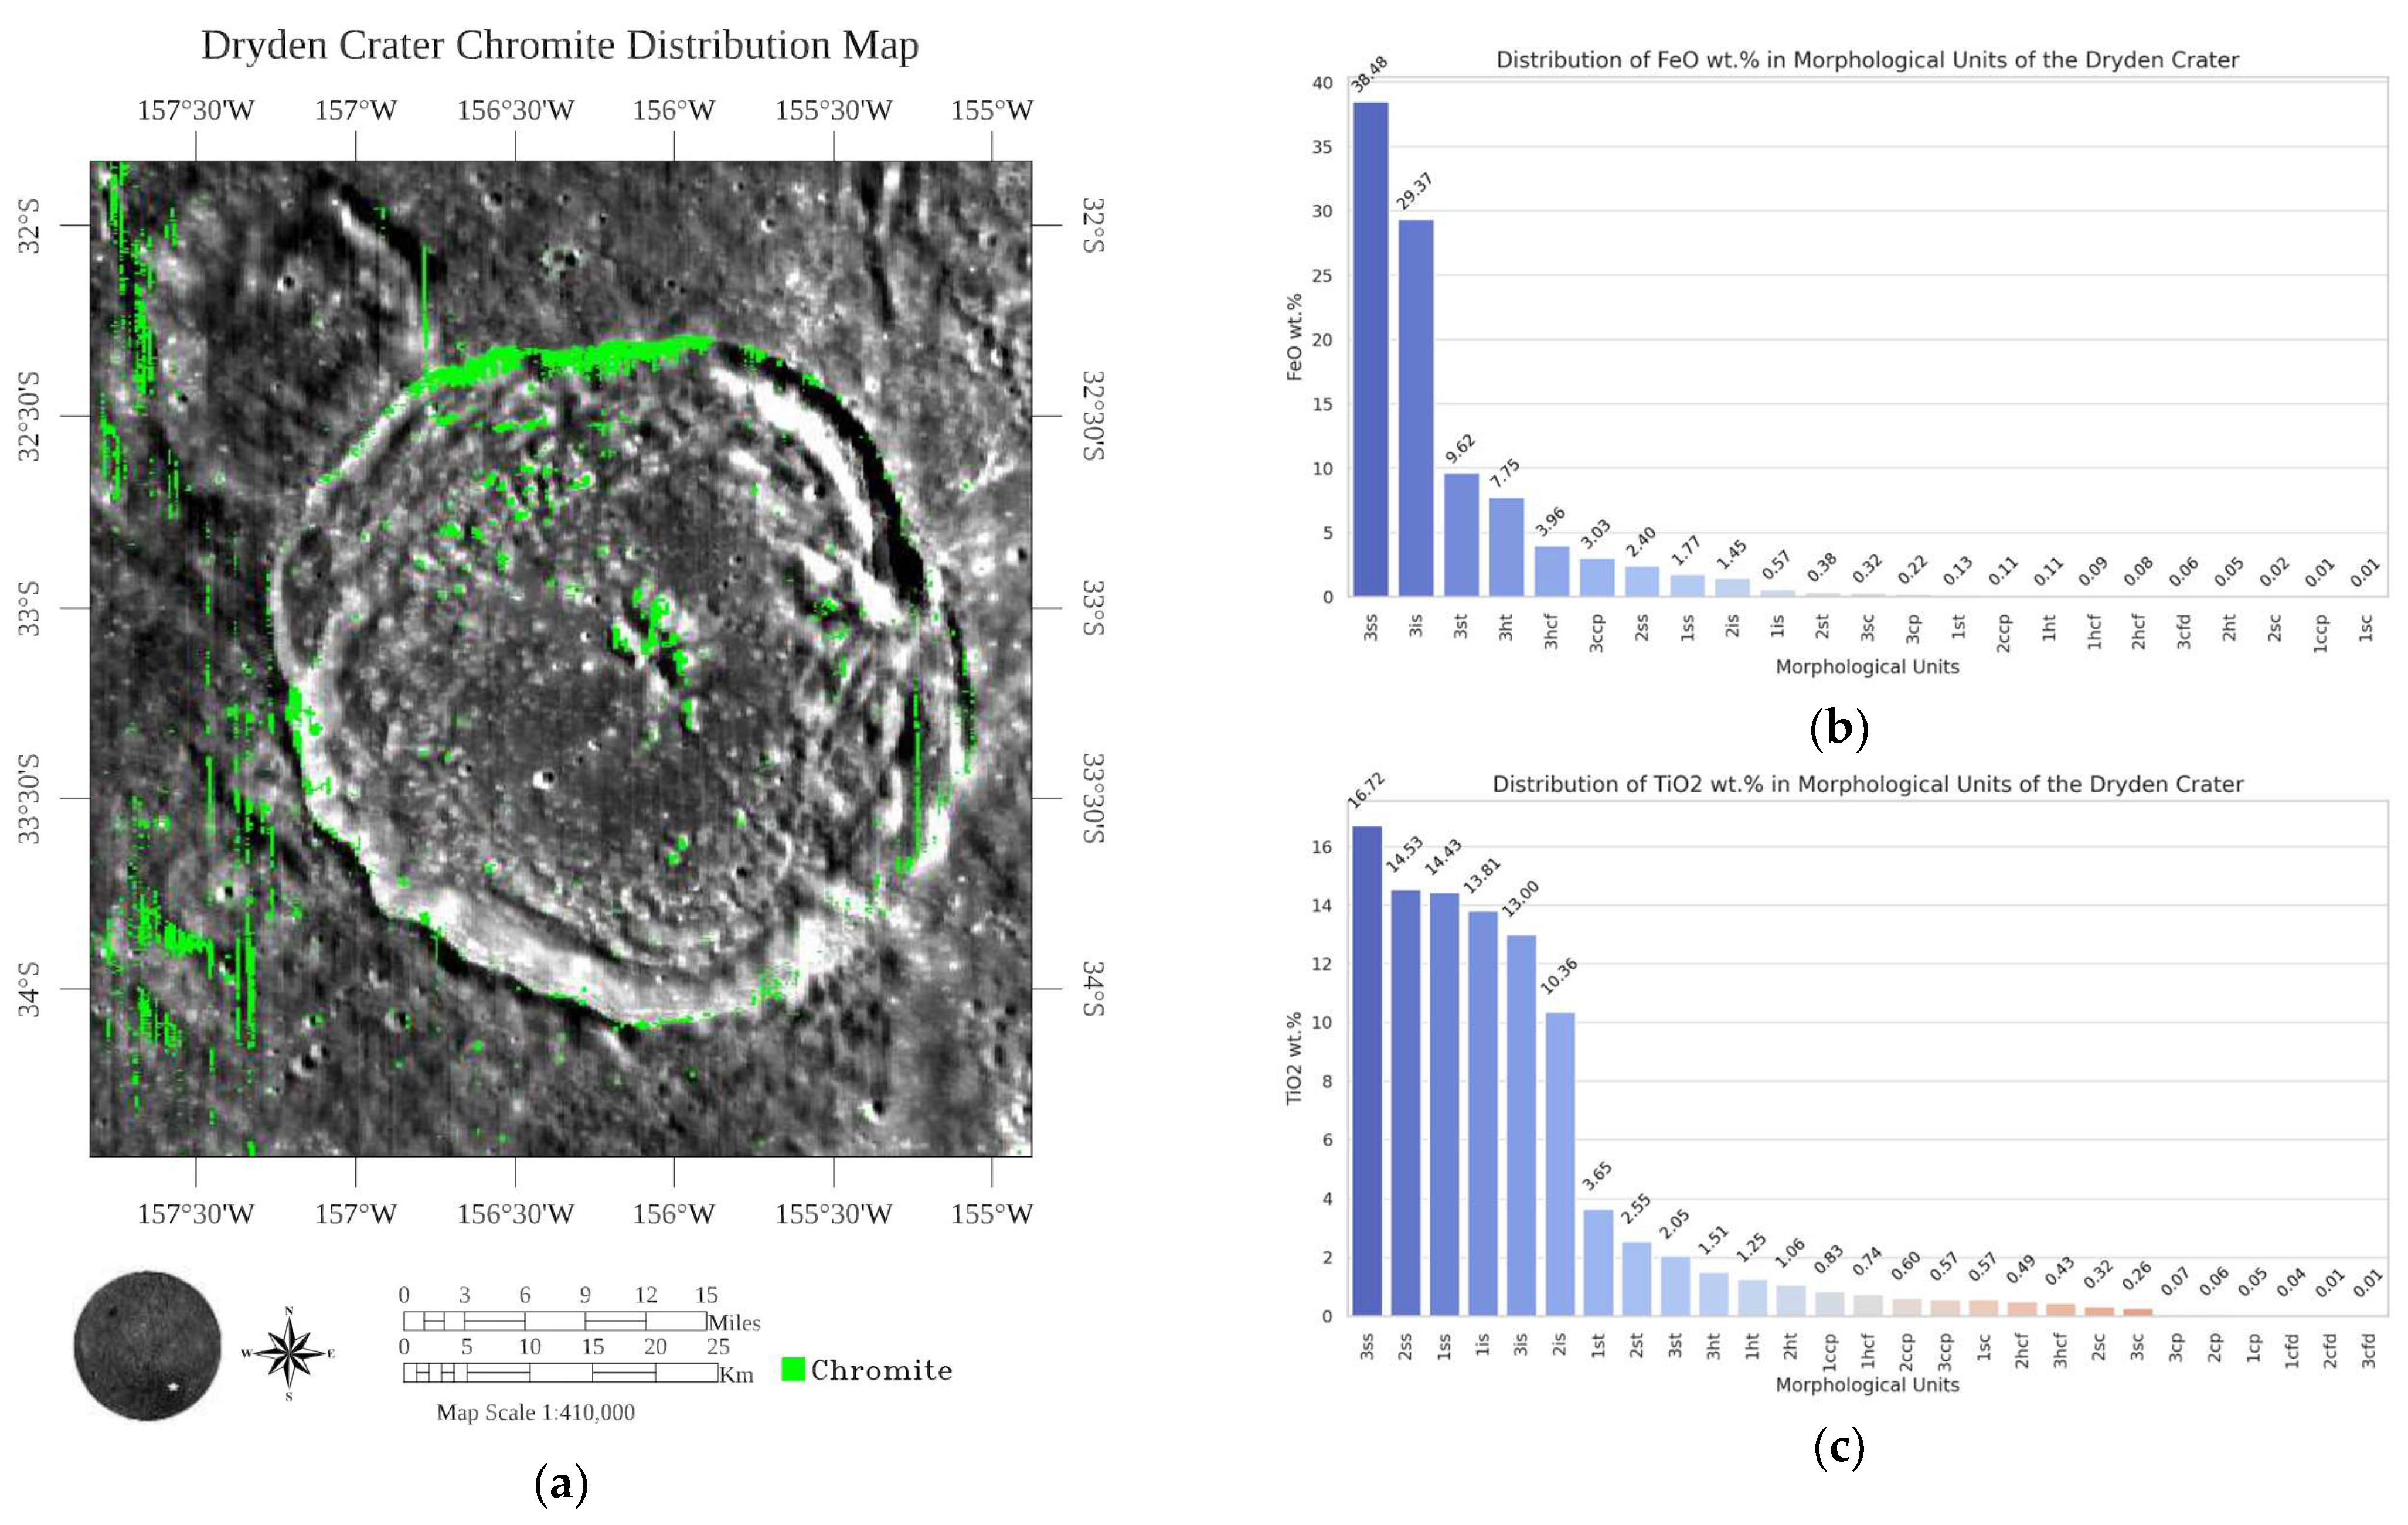
Figure 2.
(a) Dryden crater chromite distribution map; (b) Distribution of FeO wt.% in morphological units of the Dryden crater; (c) Distribution of TiO2 wt.% in morphological units of the Dryden crater.
A parametric image of Ti content within Dryden crater was also generated by applying the TP. Based on the Ti calculation, a parametric image of TiO2 wt.% distribution was generated (Figure 1b), revealing concentrations ranging from 0.0000 wt.% to 18.2864 wt.%, with a mean value of 3.8094 wt.% and a standard deviation of 5.2713%. High Ti and TiO2 values were spatially distributed along the slopes of the crater’s morphological units and overexposed areas adjacent to the crater depression. These included pixels located on the slopes of the crater wall, crater terraces, hills, central peak, and slopes of small craters formed after Dryden’s formation. These regions, characterized by geomorphological activity, displayed TiO2 values > 7 wt.% (Figure 1b and Figure 2c).
A parametric image visualizing chromite (FeCr2O4) distribution was generated by applying the CP (Figure 2a). High chromite pixel values were spatially distributed along the crater rim and the northern slope of the crater wall, including the slopes of crater terraces, hummocky hills, and the central peak.
The spatial distribution of FeO and TiO2 within Dryden crater’s M3 data highlights significant heterogeneity in surface composition, closely associated with geomorphological features. Elevated FeO concentrations, markedly higher than those reported in earlier studies [12], are predominantly localized on steep crater slopes, suggesting excavation of mafic-rich subsurface materials due to high-energy impact events [13]. This distribution pattern supports interpretations linking FeO enrichment with surface degradation processes and regolith turnover, particularly in geomorphologically active zones [14] (Figure 2b).
Similarly, TiO2 concentrations exhibit a spatial correlation with distinct morphological structures (Figure 1b and Figure 2c). The elevated TiO2 values (>10 wt.%) compared to previous studies [12] potentially influenced by the high FeO content are further affected by residual photometric and instrumental anomalies inherent to the M3 dataset. These include uncorrected topographic shading, overexposed pixels, and enhanced backscattering from the regolith surface [8,15,16,17,18].
The chromite distribution map (Figure 2a) identifies areas of high chromite index. The spatial localization of these high-index values supports the hypothesis of subsurface chromite-bearing lithologies excavated and redistributed during the crater-forming event, with fresh material subsequently exposed by active geomorphological processes.
Furthermore, the CP is providing for the detection of chromite (FeCr2O4) but does not quantify it. Chromite is a member of the spinel group and its spectral characteristics due to the chromium (Cr3+) content induce diagnostic absorption features centered near 490 nm and 590 nm, while iron (Fe2+) contributes to absorptions around 1300 nm and near 2000 nm [19]. Although chromite and other spinels exhibit similar spectral profiles, they can be differentiated based on the position of their absorption features near 2000 nm. Spinels generally show absorption minima at wavelengths shorter than 2100 nm, whereas chromite exhibits a shift toward longer wavelengths—greater than 2100 nm [20]. To enhance chromite detection a dedicated spectral index was developed in [5] following the methodology described in [20] designed to highlight materials exhibiting enhanced absorption near 2000 nm [5]. All maps (Figure 1 and Figure 2b,c) reveal that subsurface materials enriched in Fe, FeO, Ti, TiO2, and chromite were exposed during crater formation.
4. Conclusions
This study demonstrates the effective integration of hyperspectral M3 data with high-resolution topographic information (SLDEM2015) to generate detailed geospatial maps of FeO, TiO2, and chromite within Dryden crater, located in the South Pole–Aitken basin. The results reveal distinct spatial correlations between elemental abundances and key geomorphological units highlighting the role of morphology as a significant factor facilitating remote sensing of lunar surface geochemical composition and elemental identification. While impact processes primarily govern the excavation, redistribution, and enrichment of subsurface materials, post-impact geological processes further modulate the spectral characteristics of the surface. Elevated FeO (>17 wt.%) and TiO2 (>10 wt.%) concentrations, particularly in areas with slopes exceeding 15°, correspond to zones of exposed unweathered material [21]. These results align with the stratigraphic model of the SPA basin, wherein deeper, Fe- and Ti-rich lithologies were uplifted and exposed through high-energy impacts. Furthermore, the identification and mapping of chromite distribution, achieved through the application of the chromite parameter, provides additional evidence for the presence of deep-seated cumulate materials within the Dryden crater. The methodological framework established in this study—combining spectral analysis with morpho-stratigraphic data integration—offers a valuable approach for geochemical mapping of complex lunar terrains. These findings contribute to the refined understanding of lunar crustal evolution, impact-driven stratigraphy, and the potential for in situ resource utilization (ISRU), particularly in regions enriched in transition metals. Future work will focus on refining photometric corrections and applying the developed methodology to additional far-side craters, linking surface spectral data with petrologic models.
Author Contributions
Conceptualization, I.I. and L.F.; methodology, I.I.; software, I.I.; validation, I.I., and L.F.; formal analysis, I.I.; investigation, I.I.; resources, I.I.; data curation, I.I.; writing—original draft preparation, I.I.; writing—review and editing, L.F.; visualization, I.I.; supervision, L.F.; project. All authors have read and agreed to the published version of the manuscript.
Funding
This research received no external funding.
Institutional Review Board Statement
Not applicable.
Informed Consent Statement
Not applicable.
Data Availability Statement
Data are available upon request.
Acknowledgments
Iskren Ivanov is a full-time PhD student at the Space Research and Technology Institute, Bulgarian Academy of Sciences. This study utilized data from The National Aeronautics and Space Administration’s Planetary Data System and the United States Geological Survey’s Astropedia (http://astrogeology.usgs.gov/search, accessed on 11 December 2024).
Conflicts of Interest
The authors declare no conflicts of interest.
Abbreviations
The following abbreviations are used in this manuscript:
| Fe | Iron |
| Ti | Titanium |
| Cr | Chromium |
| FeO | Iron oxide |
| TiO2 | Titanium dioxide |
| M3 | Moon Mineralogy Mapper |
| SLDEM2015 | Moon LRO LOLA—SELENE Kaguya TC Shaded Relief Merge 60N60S 59m |
| IP | Iron parameter |
| wt.% | Weight percent |
| TP | Titanium parameter |
| CP | Chromite parameter |
References
- Wilhelms, D.E.; McCauley, J.F.; Trask, N.J. The Geologic History of the Moon; USGS Professional Paper 1348; USGS: Reston, VA, USA, 1987. [Google Scholar]
- Heiken, G.; Vaniman, D.; French, B.M. (Eds.) Lunar Sourcebook: A User’s Guide to the Moon; CUP Archive; Cambridge University Press: Cambridge, UK, 1991. [Google Scholar]
- O’Brien, P.; Byrne, S. Physical and chemical evolution of lunar mare regolith. J. Geophys. Res. Planets 2021, 126, e2020JE006634. [Google Scholar] [CrossRef]
- Sanders, G.; Larson, W. Progress Made in Lunar In-Situ Resource Utilization under NASA’s Exploration Technology and Development Program. J. Aerosp. Eng. 2012, 26, 5–17. [Google Scholar] [CrossRef]
- Suárez-Valencia, J.E.; Rossi, A.P.; Zambon, F.; Carli, C.; Nodjoumi, G. MoonIndex, an open-source tool to generate spectral indexes for the Moon from M3 data. Earth Space Sci. 2024, 11, e2023EA003464. [Google Scholar] [CrossRef]
- Pieters, C.M.; Boardman, J.; Buratti, B.; Chatterjee, A.; Clark, R.; Glavich, T.; Green, R.; Head, J., III; Isaacson, P.; Malaret, E.; et al. The Moon Mineralogy Mapper (M3) on Chandrayaan-1. Curr. Sci. 2009, 96, 500–505. [Google Scholar]
- Barker, M.K.; Mazarico, E.; Neumann, G.A.; Zuber, M.T.; Haruyama, J.; Smith, D.E. A new lunar digital elevation model from the Lunar Orbiter Laser Altimeter and SELENE Terrain Camera. Icarus 2016, 273, 346–355. [Google Scholar] [CrossRef]
- Wu, Y.; Xue, B.; Zhao, B.; Lucey, P.; Chen, J.; Xu, X.; Ouyang, Z. Global estimates of lunar iron and titanium contents from the Chang’E-1 IIM data. J. Geophys. Res. Planets 2012, 117, e2011JE003879. [Google Scholar] [CrossRef]
- Haldar, S.K. Introduction to Mineralogy and Petrology; Elsevier: Amsterdam, The Netherlands, 2020. [Google Scholar]
- Hargitai, H.; Naß, A. Planetary Mapping: A Historical Overview. In Planetary Cartography and GIS; Hargitai, H., Ed.; Lecture Notes in Geoinformation and Cartography; Springer: Cham, Switzerland, 2019; pp. 27–64. [Google Scholar] [CrossRef]
- Ivanov, I.; Filchev, L. Geomorphological Structural Mapping of Dryden Crater on the Moon Using Mappy Tool Plugin in QGIS Software. In Proceedings of the IV International Symposium on Applied Geoinformatics—ISAG2024, Wrocław, Poland, 9–10 May 2024; Bayram, B., Becek, K., Arampatzis, G., Eds.; Oficyna Wydawnicza Politechniki Wrocławskiej: Wrocław, Poland, 2024; pp. 65–69. [Google Scholar] [CrossRef]
- Lucey, P.G.; Taylor, G.J.; Hawke, B.R.; Spudis, P.D. FeO and TiO2 concentrations in the South Pole-Aitken basin: Implications for mantle composition and basin formation. J. Geophys. Res. Planets 1998, 103, 3701–3708. [Google Scholar] [CrossRef]
- Osinski, G.R.; Melosh, H.J.; Andrews-Hanna, J.; Baker, D.; Denevi, B.; Dhingra, D.; Ghent, R.; Hayne, P.O.; Hill, P.; James, P.B.; et al. Lunar impact features and processes. Rev. Mineral. Geochem. 2023, 89, 339–371. [Google Scholar] [CrossRef]
- O’Brien, P.; Byrne, S. Degradation of the lunar surface by small impacts. Planet. Sci. J. 2022, 3, 235. [Google Scholar] [CrossRef]
- Wang, Z.; Wu, Y.; Blewett, D.T.; Cloutis, E.A.; Zheng, Y.; Chen, J. Submicroscopic metallic iron in lunar soils estimated from the in situ spectra of the Chang’e-3 mission. Geophys. Res. Lett. 2017, 44, 3485–3492. [Google Scholar] [CrossRef]
- Lucey, P.G.; Blewett, D.T.; Hawke, B.R. Mapping the FeO and TiO2 content of the lunar surface with multispectral imagery. J. Geophys. Res. 1998, 103, 3679–3699. [Google Scholar] [CrossRef]
- Lucey, P.G.; Blewett, D.T.; Jolliff, B.L. Lunar iron and titanium abundance algorithms based on final processing of Clementine ultraviolet-visible images. J. Geophys. Res. 2000, 105, 20297–20305. [Google Scholar] [CrossRef]
- Shkuratov, Y.; Kaydash, V.; Korokhin, V.; Velikodsky, Y.; Opanasenko, N.; Videen, G. Optical measurements of the Moon as a tool to study its surface. Planet. Space Sci. 2011, 59, 1326–1371. [Google Scholar] [CrossRef]
- Cloutis, E.A.; Sunshine, J.M.; Morris, R.V. Spectral reflectance-compositional properties of spinels and chromites: Implications for planetary remote sensing and geothermometry. Meteorit. Planet. Sci. 2004, 39, 545–565. [Google Scholar] [CrossRef]
- Moriarty, D.P.; Simon, S.B.; Shearer, C.K.; Haggerty, S.E.; Petro, N.; Li, S. Orbital characterization of the composition and distribution of spinels across the Crisium region: Insight from Luna 20 samples. J. Geophys. Res. Planets 2023, 128, e2022JE007482. [Google Scholar] [CrossRef]
- Petro, N.E.; Pieters, C.M. Surviving the heavy bombardment: Ancient material at the surface of South Pole–Aitken Basin. J. Geophys. Res. Planets 2004, 109, e2003JE002182. [Google Scholar] [CrossRef]
Disclaimer/Publisher’s Note: The statements, opinions and data contained in all publications are solely those of the individual author(s) and contributor(s) and not of MDPI and/or the editor(s). MDPI and/or the editor(s) disclaim responsibility for any injury to people or property resulting from any ideas, methods, instructions or products referred to in the content. |
© 2025 by the authors. Licensee MDPI, Basel, Switzerland. This article is an open access article distributed under the terms and conditions of the Creative Commons Attribution (CC BY) license (https://creativecommons.org/licenses/by/4.0/).