
An Algorithm for Assessment of Time Series Data Related to the Materials Used for Packaging in the Market †


Abstract
1. Introduction
- Total _elements (Id, year, value (tons), id_name);
- Country (Id_ name, name);
- Materials (Id_material, material, Id_name);
- Values_tons (Id, year, value (tons), id_material);
- Economic activities (Id_activity, activity, Id_name);
- Production (Id, year, production (BGN), Id_ activity);
- Gross value added (Id, year, GVA (BGN), Id_ activity);
- Personnel (Id, year, number, Id_ activity).
2. Materials and Methods
- Paper/cardboard;
- Plastic;
- Metal;
- Wood;
- Glass;
- Other.
- Materials (Id_material, material, Id_name);
- Values_tons (Id, year, value (tons), id_material);
- Country (Id_ name, name);
- Total _elements (Id, year, value (tons), id_name).
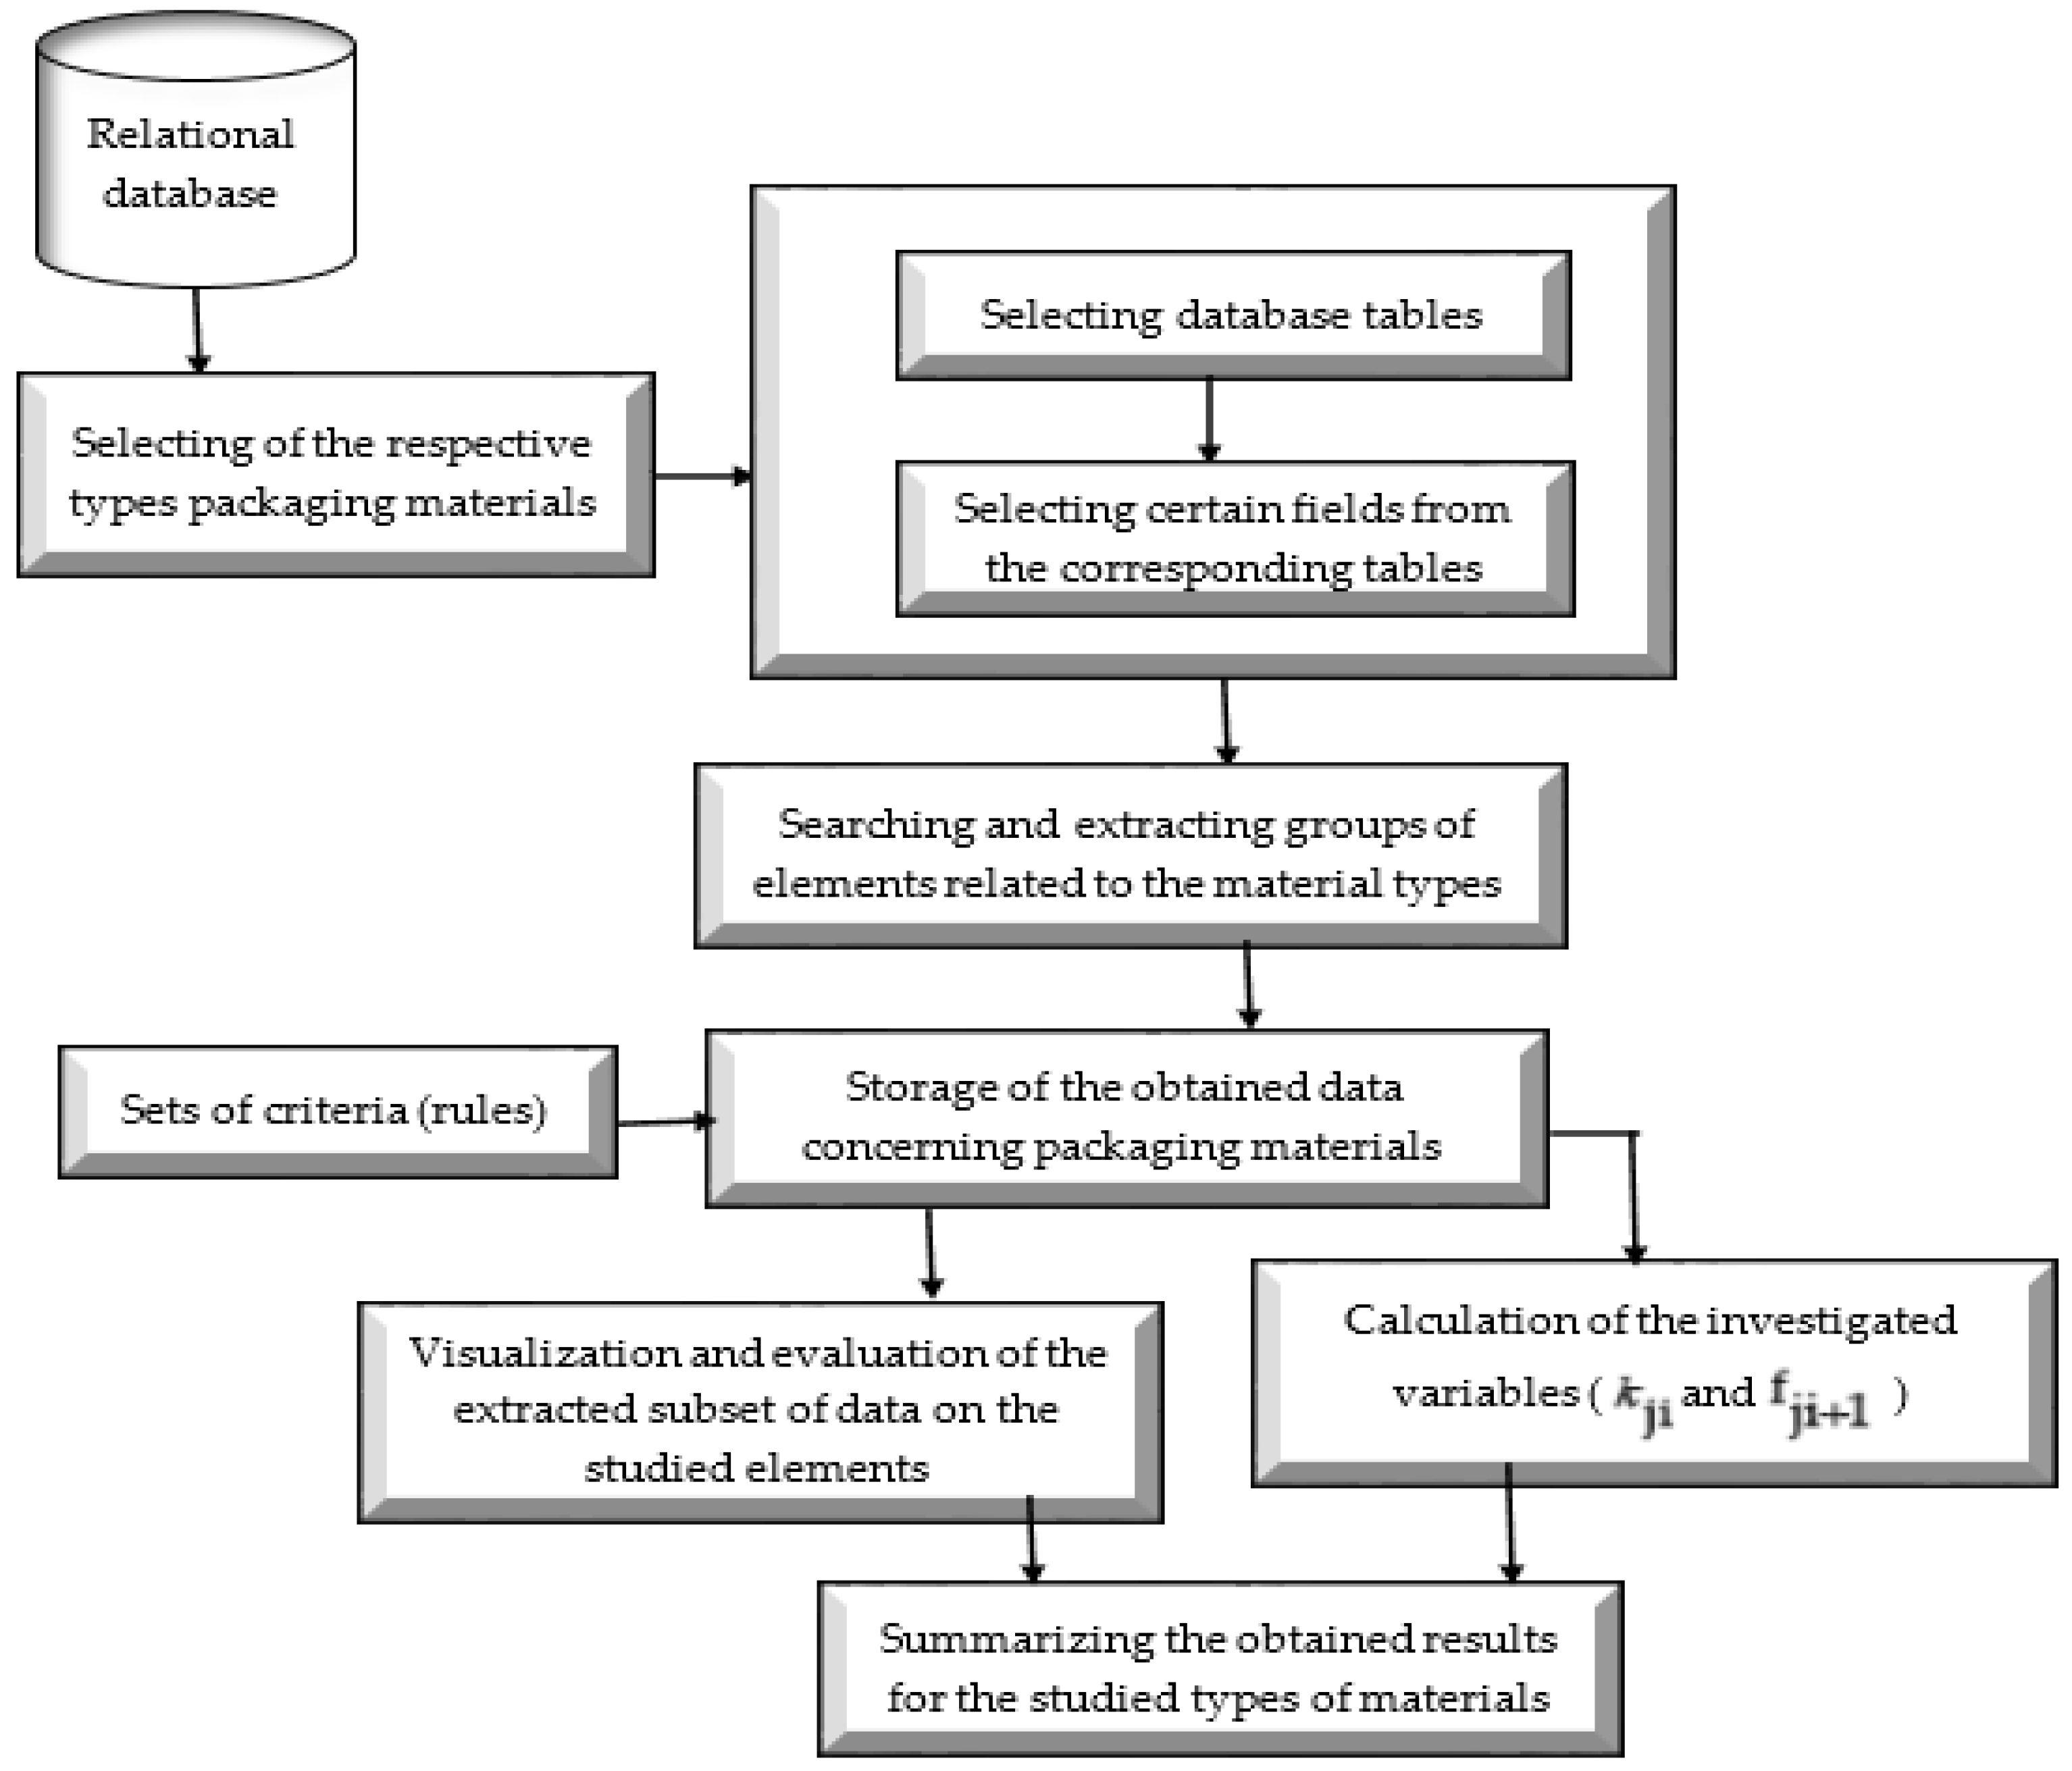
- The quantity of the type of material used for packaging production, which is the highest (, ) and the smallest () for each year of the time period;
- A subset of consecutive years of the studied period where the values of the quantities of a given packaging material (, ,…,; , ) are higher than those for the rest of the materials. Here, the number of elements (p) included in this subset is also found;
- A subset of consecutive years of the considered time interval in which the values of the quantities of a given packaging material (, ,…,; , ) are significantly smaller than the others;
- The relative share of a given quantity of packaging material used in the market to the total quantity of the studied packaging materials used for a given year:where , ;
- The percentage change in a given quantity of material used for packaging in the market () for the current year compared to the previous year:where , .
3. Results and Discussion
- Two types of materials (plastic and paper/cardboard) are included in one group. The values of their quantities are relatively higher. In this case, it can be noted that these materials are more often used for the production of packaging;
- One of the considered materials (glass) is presented in the next group;
- Another studied element (in this case wood) forms a separate group;
- The remaining two considered materials (metal and other) are presented in one group. In this case, the values of their quantities are the lowest.

| Material | Std. Deviation | Assessment of the Packaging Materials Used (Tons) |
|---|---|---|
| Other | 4674.615 | 7146.821 a |
| Metal | 8175.697 | 24,605.856 a |
| Wood | 27,488.32 | 56,075.283 b |
| Glass | 16,334.321 | 85,716.406 c |
| Plastic | 29,168.282 | 122,018.624 d |
| Paper/cardboard | 15,930.922 | 139,751.774 d |
4. Conclusions
Funding
Institutional Review Board Statement
Informed Consent Statement
Data Availability Statement
Conflicts of Interest
References
- Sagiroglu, S.; Sinanc, D. Big data: A review. In Proceedings of the 2013 International Conference on Collaboration Technologies and Systems (CTS), San Diego, CA, USA, 20–24 May 2013; pp. 42–47. [Google Scholar]
- Martinez-Mosquera, D.; Navarrete, R.; Lujan-Mora, S. Modeling and Management Big Data in Databases—A Systematic Literature Review. Sustainability 2020, 12, 634. [Google Scholar] [CrossRef]
- Januschowski, T.; Gasthaus, J.; Wang, Y.; Salinas, D.; Flunkert, V.; Bohlke-Schneider, M.; Callot, L. Criteria for classifying forecasting methods. Int. J. Forecast. 2020, 36, 167–177. [Google Scholar] [CrossRef]
- Ciaburro, G.; Iannace, G. Machine Learning-Based Algorithms to Knowledge Extraction from Time Series Data: A Review. Data 2021, 6, 55. [Google Scholar] [CrossRef]
- Podviezko, A. Use of multiple criteria decision aid methods in case of large amounts of data. J. Bus. Emerg. Mark. 2015, 7, 155–169. [Google Scholar] [CrossRef]
- Wang, F.; Li, M.; Mei, Y.; Li, W. Time Series Data Mining: A Case Study with Big Data Analytics Approach. IEEE Access 2020, 8, 14322–14328. [Google Scholar] [CrossRef]
- Huang, L.; Zhou, X.; Shi, L.; Gong, L. Time Series Feature Selection Method Based on Mutual Information. Appl. Sci. 2024, 14, 1960. [Google Scholar] [CrossRef]
- Azungah, T. Qualitative Research: Deductive and Inductive Approaches to Data Analysis. Qual. Res. J. 2018, 18, 383–400. [Google Scholar] [CrossRef]
- Wilson, S.J. Data Representation for Time Series Data Mining: Time Domain Approaches. Wiley Interdiscip. Rev. Comput. Stat. 2017, 9, e1392. [Google Scholar] [CrossRef]
- Esling, P.; Agon, C. Time-series data mining. ACM Comput. Surv. (CSUR) 2012, 45, 1–34. [Google Scholar] [CrossRef]
- National Statistical Institute, Bulgaria. Available online: http://www.nsi.bg (accessed on 4 March 2025).
- Fox, J. Extending the R Commander by “plug-in” Packages. R News 2007, 7, 46–52. [Google Scholar]
- Levine, D.M.; Stephan, D.F.; Szabat, K.A. Statistics for Managers Using Microsoft Excel, 8th ed.; Pearson: New York, NY, USA, 2016. [Google Scholar]
- Sawyer, S.F. Analysis of Variance: The Fundamental Concepts. J. Man. Manip. Ther. 2009, 17, 27E–38E. [Google Scholar] [CrossRef]
- Gelman, A. Analysis of variance—why it is more important than ever. Ann. Statist. 2005, 33, 1–53. [Google Scholar] [CrossRef]
- Tukey, J.W. Comparing Individual Means in the Analysis of Variance. Biometrics 1949, 5, 99–114. [Google Scholar] [CrossRef] [PubMed]


| Year | Plastic | Paper/ Cardboard | Metal | Wood | Glass | Other |
|---|---|---|---|---|---|---|
| 2010 | 25.52% | 43.19% | 4.90% | 5.83% | 19.91% | 0.64% |
| 2011 | 30.18% | 35.05% | 4.26% | 6.82% | 22.05% | 1.64% |
| 2012 | 29.23% | 37.19% | 4.44% | 6.12% | 21.45% | 1.57% |
| 2013 | 27.58% | 38.36% | 4.54% | 7.06% | 21.15% | 1.31% |
| 2014 | 26.96% | 34.22% | 4.22% | 12.87% | 20.66% | 1.06% |
| 2015 | 25.36% | 34.55% | 6.41% | 11.62% | 20.89% | 1.17% |
| 2016 | 25.70% | 35.20% | 7.57% | 12.20% | 18.38% | 0.94% |
| 2017 | 26.47% | 33.81% | 7.41% | 13.15% | 18.43% | 0.73% |
| 2018 | 26.40% | 33.94% | 7.56% | 13.07% | 18.28% | 0.75% |
| 2019 | 29.38% | 25.03% | 5.63% | 14.36% | 22.37% | 3.22% |
| 2020 | 32.19% | 31.30% | 4.12% | 14.74% | 15.71% | 1.94% |
| 2021 | 29.48% | 26.52% | 5.51% | 17.86% | 18.30% | 2.33% |
| 2022 | 28.36% | 25.47% | 5.60% | 18.29% | 19.85% | 2.43% |
| 2023 | 27.91% | 27.36% | 5.83% | 16.42% | 20.41% | 2.07% |
| Year | Plastic | Paper/ Cardboard | Metal | Wood | Glass | Other |
|---|---|---|---|---|---|---|
| 2011 | 15.84% | −20.51% | −14.80% | 14.42% | 8.46% | 151.77% |
| 2012 | 1.22% | 10.88% | 8.75% | −6.17% | 1.65% | 0.00% |
| 2013 | 0.44% | 9.81% | 8.91% | 22.88% | 4.96% | −11.16% |
| 2014 | 5.74% | −3.49% | 0.70% | 97.07% | 5.72% | −12.53% |
| 2015 | −2.51% | 4.68% | 57.19% | −6.39% | 4.81% | 14.32% |
| 2016 | 8.76% | 9.28% | 26.81% | 12.69% | −5.60% | −13.90% |
| 2017 | 10.82% | 3.36% | 5.34% | 15.93% | 7.87% | −16.12% |
| 2018 | 9.50% | 10.20% | 12.00% | 9.10% | 8.90% | 11.70% |
| 2019 | 24.03% | −17.79% | −16.99% | 22.52% | 36.36% | 381.96% |
| 2020 | 6.23% | 21.28% | −29.13% | −0.50% | −31.88% | −41.66% |
| 2021 | −12.59% | −19.15% | 27.71% | 15.63% | 11.13% | 14.57% |
| 2022 | −1.92 | −2.10% | 3.70% | 4.42% | 10.65% | 6.35% |
| 2023 | −4.41 | 4.34% | 1.15% | −12.77% | −0.12% | −17.32% |
Disclaimer/Publisher’s Note: The statements, opinions and data contained in all publications are solely those of the individual author(s) and contributor(s) and not of MDPI and/or the editor(s). MDPI and/or the editor(s) disclaim responsibility for any injury to people or property resulting from any ideas, methods, instructions or products referred to in the content. |
© 2025 by the author. Licensee MDPI, Basel, Switzerland. This article is an open access article distributed under the terms and conditions of the Creative Commons Attribution (CC BY) license (https://creativecommons.org/licenses/by/4.0/).
Share and Cite
Dimova, D. An Algorithm for Assessment of Time Series Data Related to the Materials Used for Packaging in the Market. Eng. Proc. 2025, 100, 23. https://doi.org/10.3390/engproc2025100023
Dimova D. An Algorithm for Assessment of Time Series Data Related to the Materials Used for Packaging in the Market. Engineering Proceedings. 2025; 100(1):23. https://doi.org/10.3390/engproc2025100023
Chicago/Turabian StyleDimova, Delyana. 2025. "An Algorithm for Assessment of Time Series Data Related to the Materials Used for Packaging in the Market" Engineering Proceedings 100, no. 1: 23. https://doi.org/10.3390/engproc2025100023
APA StyleDimova, D. (2025). An Algorithm for Assessment of Time Series Data Related to the Materials Used for Packaging in the Market. Engineering Proceedings, 100(1), 23. https://doi.org/10.3390/engproc2025100023