Proceeding Paper

Evaluating Temperature Influence on Low-Cost Microphone Response for 3D Printing Process Monitoring †

by
Luanne Barbosa
1,
Thiago Glissoi Lopes
1,
Paulo Roberto Aguiar
1,*,
Reinaldo Götz de Oliveira Junior
1 and
Thiago Valle França
2
1
Department of Electrical Engineering, São Paulo State University, Avenida. Eng. Luiz Edmundo Carrijo Coube, 14-01, Bauru 17033-360, Brazil
2
Department of Mechanical Engineering, São Paulo State University, Avenida. Eng. Luiz Edmundo Carrijo Coube, 14-01, Bauru 17033-360, Brazil
*
Author to whom correspondence should be addressed.
Presented at the 8th International Electronic Conference on Sensors and Applications, 1–15 November 2021; Available online: https://ecsa-8.sciforum.net.
Eng. Proc. 2021, 10(1), 67; https://doi.org/10.3390/ecsa-8-11251
Published: 1 November 2021

Abstract

:
The 3D printing process deals with the manufacture of parts by adding layers of material onto a heated printing bed. Electret microphones are widely used as low-cost and precise measuring devices. However, its response was negatively affected by higher temperatures due to the field effect transistor utilized in its construction. The Pencil Lead Break (PLB) method is a standardized artificial acoustic emission source utilized for the evaluation of sensors response. The present work aimed to study the electret microphone response for 3D printing monitoring and to evaluate the efficiency of a proposed housing to reduce the printing bed temperature’s influence on the electret microphone’s response. The microphone housing was 3D-printed utilizing ABS filament; its geometry was designed with the purpose of separating the sensor from the heated bed and creating an acoustic shell. Then, PLB tests were performed, and the raw signal was collected from housed and non-housed microphones at 5 MHz sampling frequency. The sensors were tested under three temperatures of the printer bed: at 25 °C (ambient), at 65 °C (operating temperature), and, finally, after the temperature of the table was naturally stabilized from 65 °C to 25 °C. The signals were investigated in the time and frequency domain. The results showed that the housing impacts the microphone’s response positively when operating at 25 °C, where the signals presented higher amplitudes in both domains. However, the response obtained by the housed sensor was considerably attenuated at 65 °C. Furthermore, the signals collected at 25 °C after exposing the housed microphone to heat demonstrated a “greenhouse effect”, keeping the sensor at higher temperatures for an extended period. It can be concluded that the proposed housing failed in reducing the temperature effects in the sensor’s response. However, these effects were shown to be significant and the need for an alternative method to attenuate them was reinforced.

1. Introduction

The Fused Deposition Modelling process, commonly referred as the 3D printing process, deals with the manufacture of parts by adding layers of fused material onto a heated printing bed [1]. The material used for 3D printing is usually a type of thermoplastic filament [2]. Each type of filament requires different extruder and bed temperatures. For instance, the recommended bed temperature for the carbon fiber polylactic acid (CFPLA) filament ranges between 45–60 °C, as for the acrylonitrile butadiene styrene (ABS) filament it ranges between 110–115 °C, and for the polylactic acid (PLA) filament is 65 °C [2,3].
The monitoring of the 3D printing process through digital processing of in-situ acquired acoustic signals has been a subject of many studies [4,5]. In the study developed by [4], the authors demonstrated that it was possible to diagnose different types of failures in parts manufactured by 3D printing through feature extraction and statistical analysis of signals acquired with an acoustic emission (AE) sensor placed on the 3D printer hot printing bed. On the other hand, in the study developed by [5], the authors demonstrated that it was possible to evaluate the first layer bond quality, a very important feature in the part adhesion and, consequently, final part quality, by means of digital processing of signals acquired by a piezoelectric polyvinylidene difluoride (PVDF) vibroacoustic sensor placed on the 3D printer hot printing bed.
On the other hand, electret microphones are widely used, low-cost and precise measuring devices [6]. There are some examples in the literature of the electret microphone usage in the monitoring of manufacturing process studies [7,8]. However, the electret microphone response is negatively affected by higher temperatures due to the field effect transistor (FET) utilized in its construction [9].
A proper evaluation of the response of sensors is essential due to their importance in in-situ monitoring. The Pencil Lead Break (PLB) method stands out among the methods that verify this response [10], since it is a standardized method settled as a replicable artificial source of acoustic emission [11]. The graphite tip of a mechanical pencil is firmly pressed against the surface of interest until breakage. At this point, the stored stress is swiftly released, releasing acoustic waves that propagate through the analyzed structure and generating microscopic movements on its surface. The quick release of these waves enables the frequency response of the sensor to be measured, acting like an impulse [10].
There are some studies found in the literature that evaluate piezoelectric sensor response placed on a 3D printer heated printing bed when exposed to appropriate printing temperatures [10,12]. Among the studies, it was found that the elevated temperature in 3D printing has a negative effect on the piezoelectric sensor response.
The present work aims to study the electret microphone response for 3D printing monitoring and to evaluate the efficiency of a proposed transducer housing to reduce the printing bed temperature’s influence on the electret microphone’s response.

2. Material and Methods

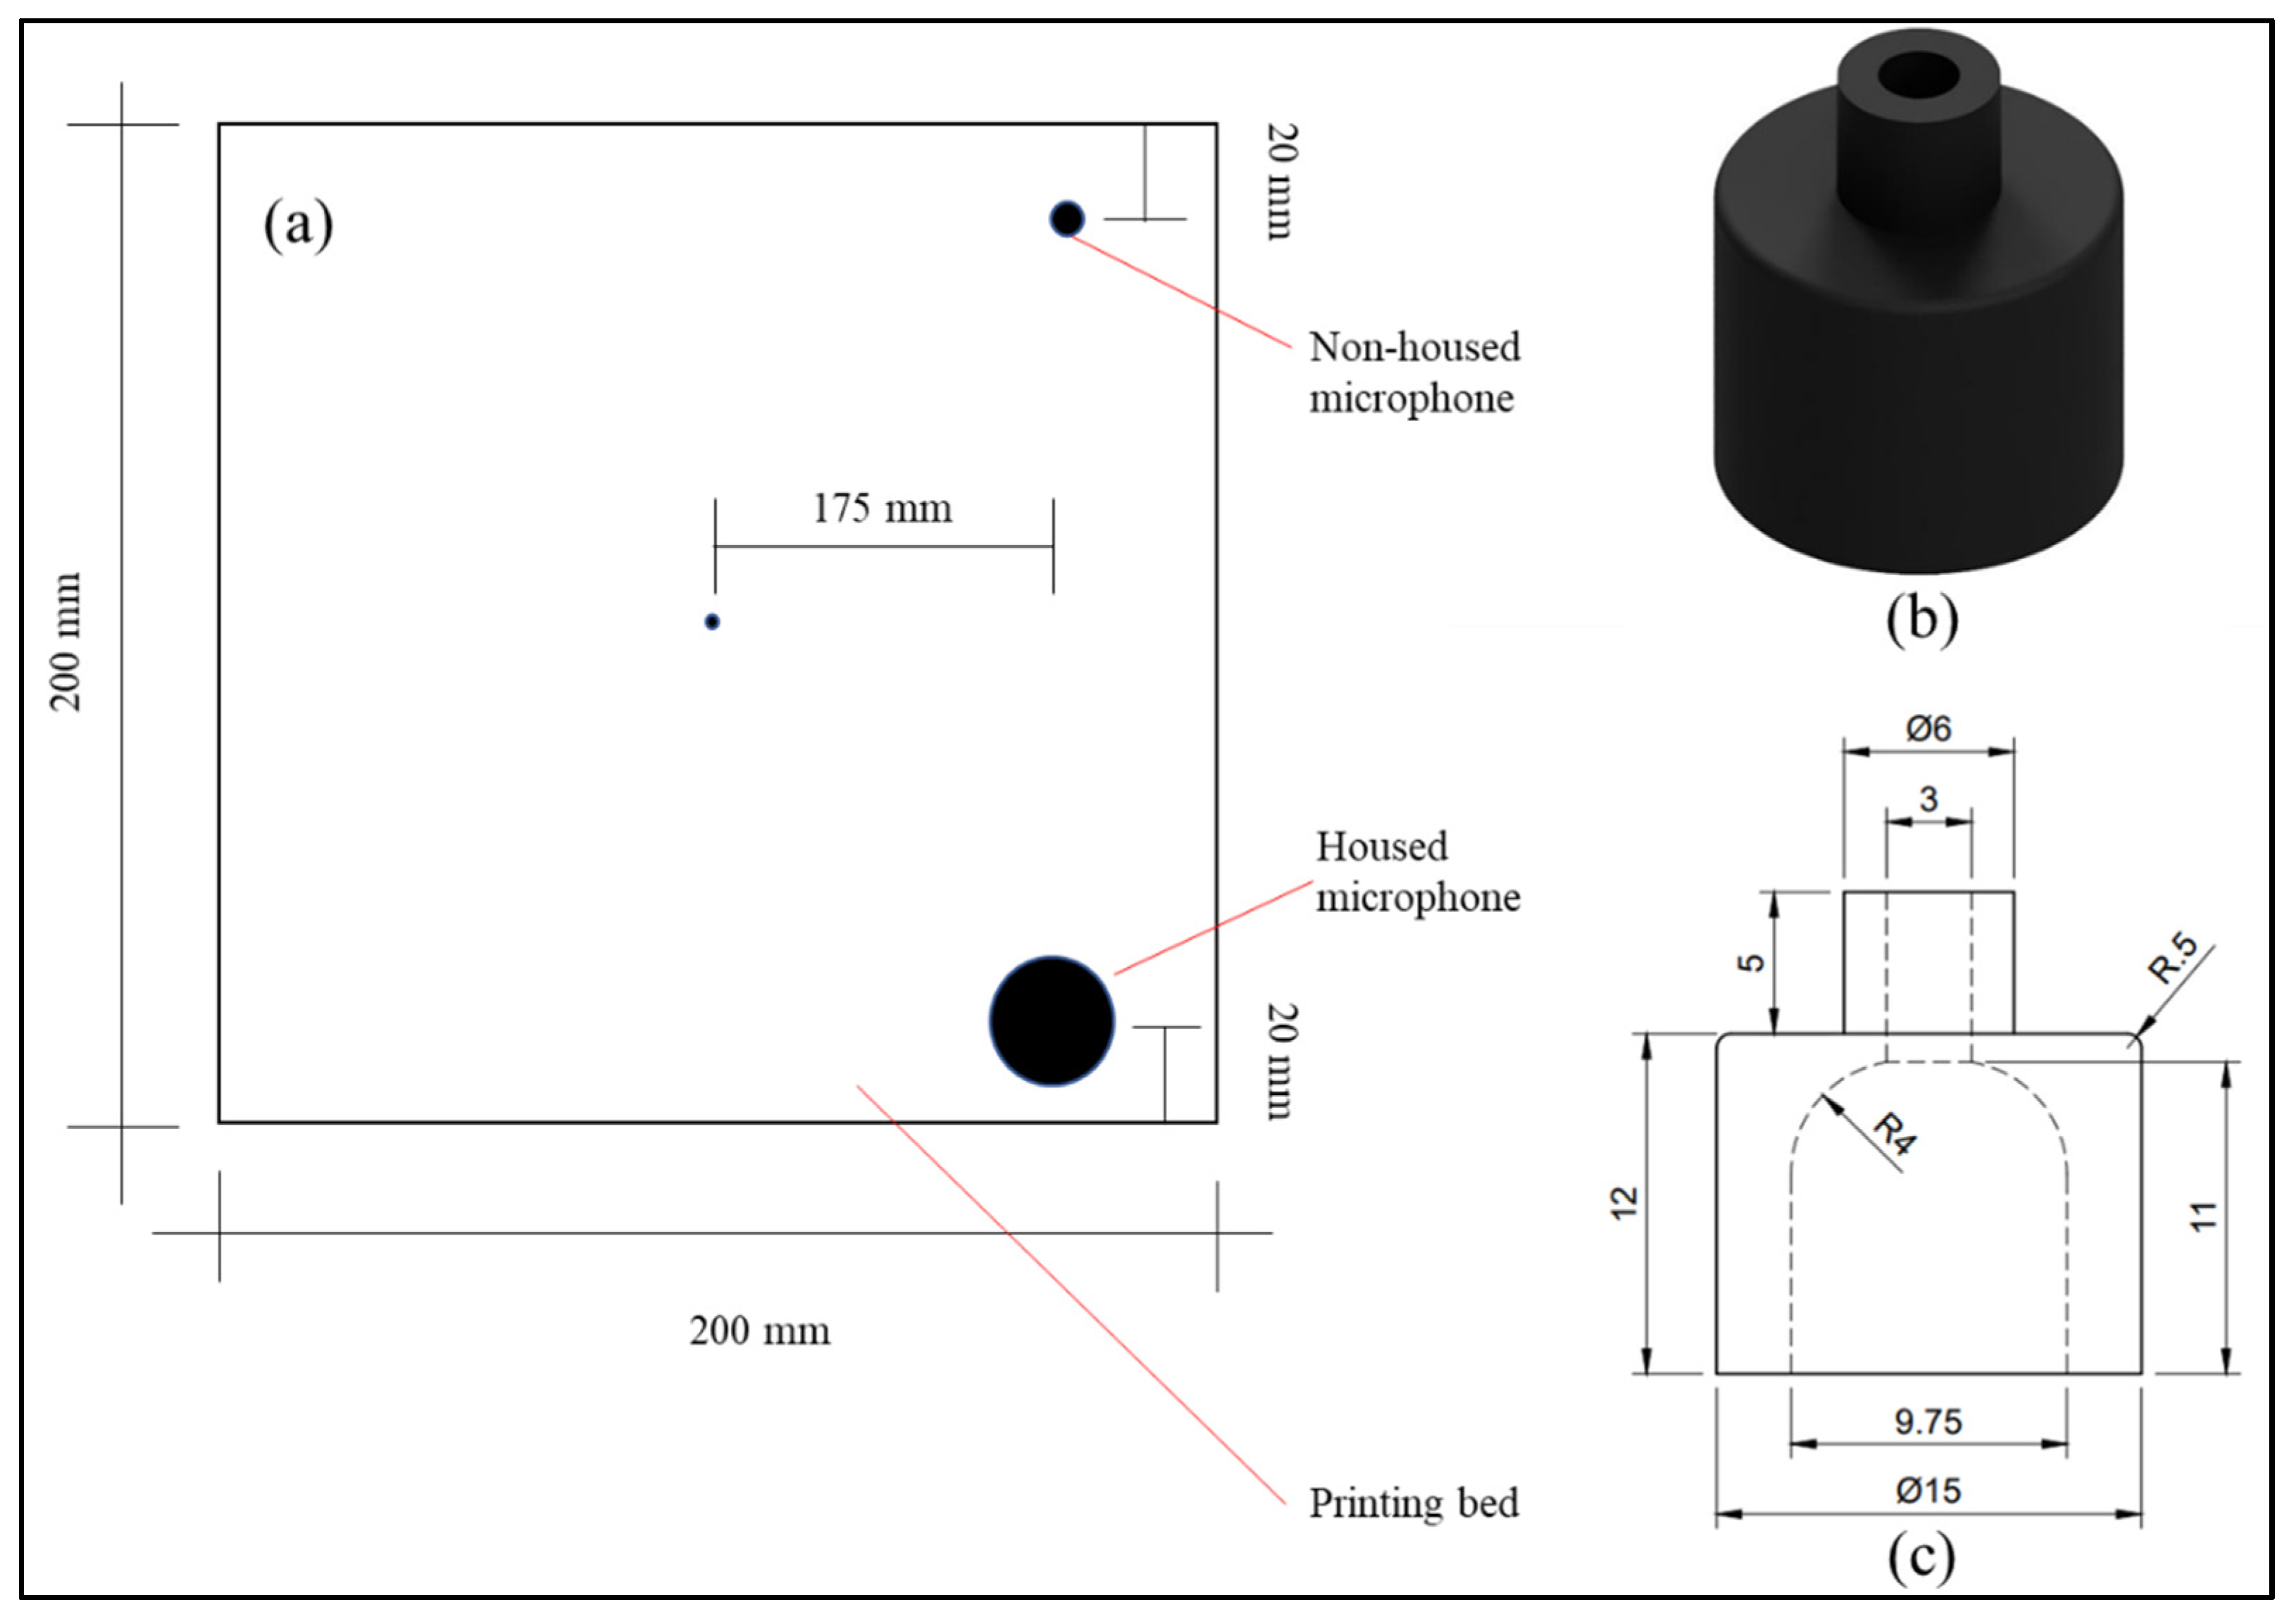
2.1. Experimental Setup

This work is based on experimental procedures to inquire into the influence of temperature variation on electret microphone response in 3D printing process monitoring. The tests were held in a 3D printer, model Graber i3 (GTMax, Americana-SP, Brazil). This model has a heated MK2B Dual Power PCB printing bed with NTC 100 k thermistor type temperature sensor, which is in connected to a glass panel with the dimensions 200 × 200 × 3 mm3.
Two 3 mm diameter electret microphones were used in this study. One of the microphones were attached to the printing bed through various layers of a silicon-based adhesive, in the upper right part of the heated printed bed as seen in Figure 1a. The second microphone were housed in an ABS 3D-printed housing. The housing was fabricated with the geometry seen in Figure 1c, which was designed with the purpose of separating the sensor from the heated bed and creating an acoustic shell. The housed microphone, as seen in Figure 1b, was then attached to the printing bed through various layers of a silicon-based adhesive, in the lower right part of the heated printed bed as seen in Figure 1a.
A ScopeCorder measuring instrument, model DL850, manufactured by Yokogawa, was used for storage and data gathering. The graphite utilized in the PLB method had a 2H hardness and measured 0.5 mm in diameter. The temperature control of the glass printing bed was controlled through Repetier-Host® software and done by the printer heating system. The ambient temperature of 25 °C was considered as baseline.
In the tests, three pencil lead breaks were done for each chosen temperature: 25 °C (baseline temperature), 65 °C (PLA recommended printing bed temperature), and, after turning off the bed’s heating system and waiting for the bed to cool off, again at 25 °C. The PLB tests were performed while keeping a 45° angle between the graphite and the table. The mechanical pencil angle and the graphite length were established in accordance with ASTM E976. The ScopeCorder stored the acoustic signals, gathered at a sampling rate of 5 MHz, and the data were later digitally processed with MATLAB® software.

2.2. Signal Processing

The signals obtained from each microphone were investigated in the frequency and time domain. In each analysis, the temperature effects were compared between evaluated temperatures for each microphone, and between microphones.
In the time domain, an amplitude behavior analysis between the evaluated temperatures was conducted. For each evaluated temperature, only one of the obtained PLB repetitions was chosen to conduct the analysis. This is due to the fact that the three repetitions for each conducted test presented very close amplitude behaviors.
In the frequency domain, the average frequency spectrum was calculated from the three signals obtained for each temperature. From the mean frequency spectrum signal, an amplitude variation study was held similarly to the one used by [10], between the evaluated temperatures.

3. Results and Discussion

3.1. Raw Signal Analysis

The signals collected from the PLB tests are shown in Figure 2. As shown in Figure 2a,d, at room temperature, it can be observed that the housing enhances the sensibility of the microphone. Increasing its voltage output. This occurs due to the housing acting as an acoustic shell. It is also worth noting, however, that the signals share a similar, yet different, shape, where the main difference is a voltage peak in Figure 2d that occurs close to 25 ms, whereas the same cannot be seen in Figure 2a.
The effect of the operating temperature on the response of the sensors can be observed in Figure 2b,e, where amplitudes for both were significantly attenuated in comparison to Figure 2a,d. Nevertheless, it can be pointed out that this effect is more prominent in the housed microphone. In Figure 2e features of the PLB test are almost indistinguishable from background noise, making it difficult to analyze, especially compared to its non-housed counterpart. This reveals that the housing had the opposite effect from what was expected. Lastly, contrasting Figure 2a,b, it can be observed that higher temperature causes the signal of the non-housed microphone to become lower in amplitude. This result is closely related to those obtained by [9].
It is observed in Figure 2c,f that, even when the temperature returned to 25 °C, the performance of the sensors was not the same as previously seen. Looking at Figure 2c specifically, the amplitudes were even lower than the ones shown in Figure 2b. It can be inferred that the temperature effects linger for some time after exposure to heat and can even worsen with time. Figure 2f reveals that the housed microphone recovered better than the non-housed one in relation to amplitude, even if the signal was still more attenuated than the one in Figure 2d. Analyzing its shape, however, it showed significant differences in comparison to the other signals, particularly between 15 ms and 35 ms, where there were barely any similarities between Figure 2d,f.
The effects on the housed microphone present in Figure 2e can be explained by the geometry of the housing creating a “greenhouse” type effect, which maintained the sensor at higher temperatures for an extended period. This defeats the purpose of the housing from keeping the sensor at a lower temperature and influences the results negatively instead. As the sensor will be most useful at the operating temperature of the 3D-printer, this effect is very significant; further analyses should be considered. However, the housing was shown to be capable of attenuating the long-term effects of temperature, as seen in Figure 2f. This is due to the separation between the sensor and the heated bed found on the housed microphone, preserving certain integrity of the electret microphone.

3.2. Frequency Spectrum Analysis

The mean frequency spectra for both housed and non-housed microphones are presented in Figure 3 for each evaluated bed temperature. The frequency range presented in Figure 3 was adopted due to fact that the observed amplitude after 8 kHz presented very low values.
Firstly, the mean spectra for the baseline temperature, presented in Figure 3d for the housed microphone, showed overall more amplitude sensibility than its non-housed counterpart, presented in Figure 3a. This behavior can be easily spotted when observing the amplitude values for the frequency ranges between 0 Hz to 500 Hz and 1.5 kHz to 3 kHz. This improvement seen in the amplitude sensibility on the housed microphone was attributed to the acoustic shell generated by the housing.
On the other hand, the mean spectra for the printing process temperature, presented in Figure 3e for the housed microphone, showed significantly lower amplitude sensibility than its non-housed counterpart, presented in Figure 3b. This behavior can be easily spotted through all the frequency spectra. The deterioration seen in the amplitude sensibility on the housed microphone is attributed to the greenhouse-type effect generated inside the acoustic shell. Due to the heating in the bed, the air inside the housing absorbed heat, which does not dissipate easily due to the heat transfer capabilities of the ABS housing.
Lastly, the mean spectra for the housed microphone, presented in Figure 3f showed higher amplitude sensibility than its non-housed counterpart, as presented in Figure 3c. This behavior can be spotted through all the frequency spectra. The deterioration seen in the non-housed microphone sensibility was attributed to the direct contact of the sensor with the hot printing bed, which damaged the electret microphone. In contrast, the sensibility deterioration seen in the housed microphone, which was easily spotted through all the frequency spectra when comparing the amplitude values to the baseline spectra, as presented in Figure 3d, was considerably lower than its non-housed counterpart, as seen in in Figure 3c. This difference was attributed to the fact that the housed microphone did not have direct contact with the hot printing bed, which alleviated the damages on the electret microphone.

4. Conclusions

In conclusion, the transducer housing failed in its main objective of reducing the temperature effects in the microphone’s response, even having the opposite result in some cases, where it further attenuated the signal. This happened due to an unforeseen “greenhouse effect” happening inside the housing. Additionally, it was also shown that the change in the microphone’s behavior due to the printing bed’s operating temperature can last for some time after exposure to heat and even worsen in that period.
However, the housing was shown to be capable of reducing these long-term effects. Thus, considering the operating temperature of a 3D-printer greatly affects the electret microphone’s response, the use of this transducer in 3D process monitoring was not possible without a method to reduce the negative temperature effects. Therefore, the need for improvement of the transducer housing design or other alternatives to attenuate the temperature effects was reinforced.

Author Contributions

The authors contributed equally to this work. All authors have read and agreed to the published version of the manuscript.

Funding

This work was funded by the São Paulo Research Foundation (FAPESP) grant number #2016/22038-8 and National Council for Scientific and Technological Development (CNPq) grant numbers #306435/2017-9 and #121016/2020-0.

Institutional Review Board Statement

Not applicable.

Informed Consent Statement

Not applicable.

Data Availability Statement

Not applicable.

Conflicts of Interest

The authors declare no conflict of interest.

References

  1. Dhinakaran, V.; Manoj Kumar, K.P.; Bupathi Ram, P.M.; Ravichandran, M.; Vinayagamoorthy, M. A review on recent advancements in fused deposition modeling. Mater. Today Proc. 2020, 27, 752–756. [Google Scholar] [CrossRef]
  2. Srinivasan, R.; Suresh Babu, B.; Udhaya Rani, V.; Suganthi, M.; Dheenasagar, R. Comparision of tribological behaviour for parts fabricated through fused deposition modelling (FDM) process on abs and 20% carbon fibre PLA. Mater. Today Proc. 2020, 27, 1780–1786. [Google Scholar] [CrossRef]
  3. do Carmo, M.G.F.; Lopes, T.G.; Bombonatti, V.S.; Aguiar, P.R.; França, T.V. Study of the Defects and Geometric Anomalies on Monolayer Parts Obtained by Fused Deposition Modeling Process. Proceedings 2020, 69, 40. [Google Scholar] [CrossRef]
  4. Wu, H.; Yu, Z.; Wang, Y. Experimental study of the process failure diagnosis in additive manufacturing based on acoustic emission. Measurement 2019, 136, 445–453. [Google Scholar] [CrossRef]
  5. Bhavsar, P.; Sharma, B.; Moscoso-Kingsley, W.; Madhavan, V. Detecting first layer bond quality during FDM 3D printing using a discrete wavelet energy approach. Procedia Manuf. 2020, 48, 718–724. [Google Scholar] [CrossRef]
  6. Bakhoum, E.G.; Cheng, M.H.M. Novel electret microphone. IEEE Sens. J. 2011, 11, 988–994. [Google Scholar] [CrossRef]
  7. Nguyen, V.; Dugenske, A. An I2C based architecture for monitoring legacy manufacturing equipment. Manuf. Lett. 2018, 15, 67–70. [Google Scholar] [CrossRef]
  8. Iyer, N.G.; Norman, S.R. Analysis of acoustic signals from rotating machines for wear detection. In Proceedings of the 2014 International Conference on Recent Trends in Information Technology, Chennai, India, 10–12 April 2014; pp. 1–6. [Google Scholar]
  9. Yasuno, Y.; Itoh, T.; Yamada, A.; Nojima, Y.; Kidokoro, K.; Tajima, T.; Iguchi, Y. Temperature characteristics of single-crystal silicon electret microphones. IEEE Trans. Dielectr. Electr. Insul. 2015, 22, 3658–3662. [Google Scholar] [CrossRef]
  10. Lopes, T.G.; Rocha, R.M.; Aguiar, P.R.; Alexandre, F.A.; França, T.V. Evaluating Temperature Influence on Low-Cost Piezoelectric Transducer Response for 3D Printing Process Monitoring. Proceedings 2019, 42, 26. [Google Scholar] [CrossRef] [Green Version]
  11. Sause, M.G.R. Investigation of Pencil-Lead Breaks as Acoustic Emission Sources. J. Acoust. Emiss. 2011, 29, 184–196. [Google Scholar]
  12. Lopes, T.G.; Rocha, R.M.; de Aguiar, P.R.; Alexandre, F.A.; de Oliveira Conceição, P.; Viera, M.A.A.; Franca, T.V. Study of the Influence of Temperature on Low-Cost Piezoelectric Transducer Response for 3D Printing Process Monitoring. In Proceedings of the 2019 7th International Engineering, Sciences and Technology Conference (IESTEC), Panama City, Panama, 9–11 October 2019; pp. 544–549. [Google Scholar]
Figure 1. Setup Schematic. (a) Top view, (b) Housed microphone, (c) Housing diagram.
Engproc 10 00067 g001
Figure 2. Raw PLB signal. (a) Non-housed microphone at 25 °C, (b) Non-housed microphone at 65 °C, (c) Non-housed microphone at 25 °C after process, (d) Housed microphone at 25 °C, (e) Housed microphone at 65 °C, (f) Housed microphone at 25 °C after process.
Engproc 10 00067 g002
Figure 3. Mean frequency spectra. (a) Non-housed microphone at 25 °C, (b) Non-housed microphone at 65 °C, (c) Non-housed microphone at 25 °C after process, (d) Housed microphone at 25 °C, (e) Housed microphone at 65 °C, (f) Housed microphone at 25 °C after process.
Engproc 10 00067 g003
Publisher’s Note: MDPI stays neutral with regard to jurisdictional claims in published maps and institutional affiliations.

