Proceeding Paper

Tropomyosin Analysis in Foods Using an Electrochemical Immunosensing Approach †

by
Ricarda Torre
1,
Maria Freitas
1,
Estefanía Costa-Rama
2,
Henri P. A. Nouws
1,* and
Cristina Delerue-Matos
1
1
REQUIMTE/LAQV, Instituto Superior de Engenharia do Porto, Instituto Politécnico do Porto, Dr. António Bernardino de Almeida 431, 4200-072 Porto, Portugal
2
Departamento de Química Física y Analitica, Universidad de Oviedo, Av. Julián Clavería 8, 33006 Oviedo, Spain
*
Author to whom correspondence should be addressed.
Presented at the 1st International Electronic Conference on Chemical Sensors and Analytical Chemistry, 1–15 July 2021; Available online: https://csac2021.sciforum.net/.
Chem. Proc. 2021, 5(1), 62; https://doi.org/10.3390/CSAC2021-10471
Published: 30 June 2021

Abstract

:
A screen-printed carbon electrode was used as the transducer for the development of an electrochemical immunosensor for the determination of tropomyosin (a major shrimp allergen) in food samples. Monoclonal and polyclonal antibodies were used in a sandwich-type immunoassay. The analytical signal was electrochemically obtained using an alkaline phosphatase-labelled secondary antibody and a 3-indoxyl phosphate/silver nitrate substrate. The total assay time was 2 h 50 min and allowed the quantification of tropomyosin between 2.5 and 20 ng mL−1, with a limit of detection of 1.7 ng mL−1 The immunosensor was successfully applied to the analysis of commercial food products.

1. Introduction

Over the past few years, food allergies have increasingly been regarded as a significant worldwide public health problem. Among shellfish allergies, shrimp is the predominant crustacean causing over 80% of allergic reactions that can result in severe hypersensitivity such as urticaria and asthma, and it is a major cause of anaphylaxis [1,2].
Tropomyosin (TPM), a major common allergenic protein found in seafood, is relatively resistant to peptic acidic digestion, which causes a continuous effect of the protein on the immune system. To protect the consumer from harmful allergens and potentially life-threatening reactions, food manufacturers are required to label and highlight shellfish-allergenic ingredients on food packages [3].
Currently, multiple technical approaches have been developed to identify the presence of shrimp tropomyosin in food, including enzyme-linked immunosorbent assays (ELISA), DNA detection, polymerase chain reaction (PCR), microarray and qualitative/semi-quantitative lateral flow assays. Although ELISA is the most commonly used method for TPM detection and quantification, it presents some disadvantages such as the long and tedious steps in the analysis procedure, long analysis times and high costs [4,5]. An alternative way to determine TPM in foods is through the use of electrochemical immunosensors. These sensors provide highly selective, sensitive, fast and cheap analysis and are suitable for in situ applications. Therefore, in this work, a simple voltametric immunosensor for the determination of TPM in commercial food products was developed. The immunoassay was based on a sandwich-type assay using screen-printed carbon electrodes (SPCE) as transducers. Monoclonal and polyclonal antibodies were used to capture and detect TPM. To obtain the analytical signal, an alkaline phosphatase-labelled secondary antibody and 3-indoxyl phosphate/silver nitrate (enzymatic substrate) were employed; the enzymatically deposited silver was analyzed by linear sweep voltammetry [6,7,8].
The applicability of the immunosensor was assessed by analyzing different food samples.

2. Materials and Methods

2.1. Instrumentation

Linear sweep voltametric analyses were performed using an Autolab PGSTAT204 potentiostat/galvanostat from Methrohm Autolab. Disposable screen-printed carbon electrodes (DRP-110) with a carbon working electrode (WE, d = 4 mm), a carbon counter electrode and a silver pseudoreference electrode were purchased from Methrohm DropSens.

2.2. Reagents and Solutions

Tris(hydroxymethyl)aminomethane (Tris, ≥99.8%), magnesium nitrate hexahydrate (Mg(NO3)2, 99%), nitric acid (HNO3, ≥65%), 3-indoxyl phosphate (3-IP, ≥98%), silver nitrate (AgNO3, ≥99.9995%), β-casein from bovine milk (≥98%), and bovine serum albumin (BSA) were obtained from Sigma-Aldrich.
Mouse IgG1 monoclonal antibody (capture antibody, C-Ab), purified natural shrimp tropomyosin standard (antigen) and rabbit polyclonal antiserum shrimp tropomyosin (detection antibody, D-Ab) were purchased from Indoor Biotechnologies. An alkaline phosphatase goat anti-rabbit IgG antibody (AP-Ab) was supplied by Invitrogen. Throughout the work, ultra-pure water (resistivity = 18.2 MΩ cm), obtained from a Millipore (Simplicity 185) water purification system, was used. Working solutions of BSA, the antibodies and the antigen were prepared in 0.1 M Tris-HNO3 pH 7.4 buffer (Buffer 1, B1). A second buffer (B2, 0.1 M Tris-HNO3 pH 9.8 containing Mg(NO3)2 (2 × 10⁻² M)) was used to prepare the solution containing 3-IP (1 × 10⁻³ M) and AgNO3 (4 × 10⁻⁴ M).

2.3. Sample Preparation

Shrimp, shrimp sauce and crab and chicken paste were used to evaluate the immunosensor’s applicability to food analysis. Samples were prepared as follows: (a) 1 g of sample was mixed with 10 mL of Tris-HNO3 (pH 8.2, 1% NaCl) at 60 °C during 15 min in a water bath; (b) the resulting suspension was then centrifuged at 2500 rpm for 20 min and (c) the supernatant was divided in aliquots and stored at −20 °C until use.

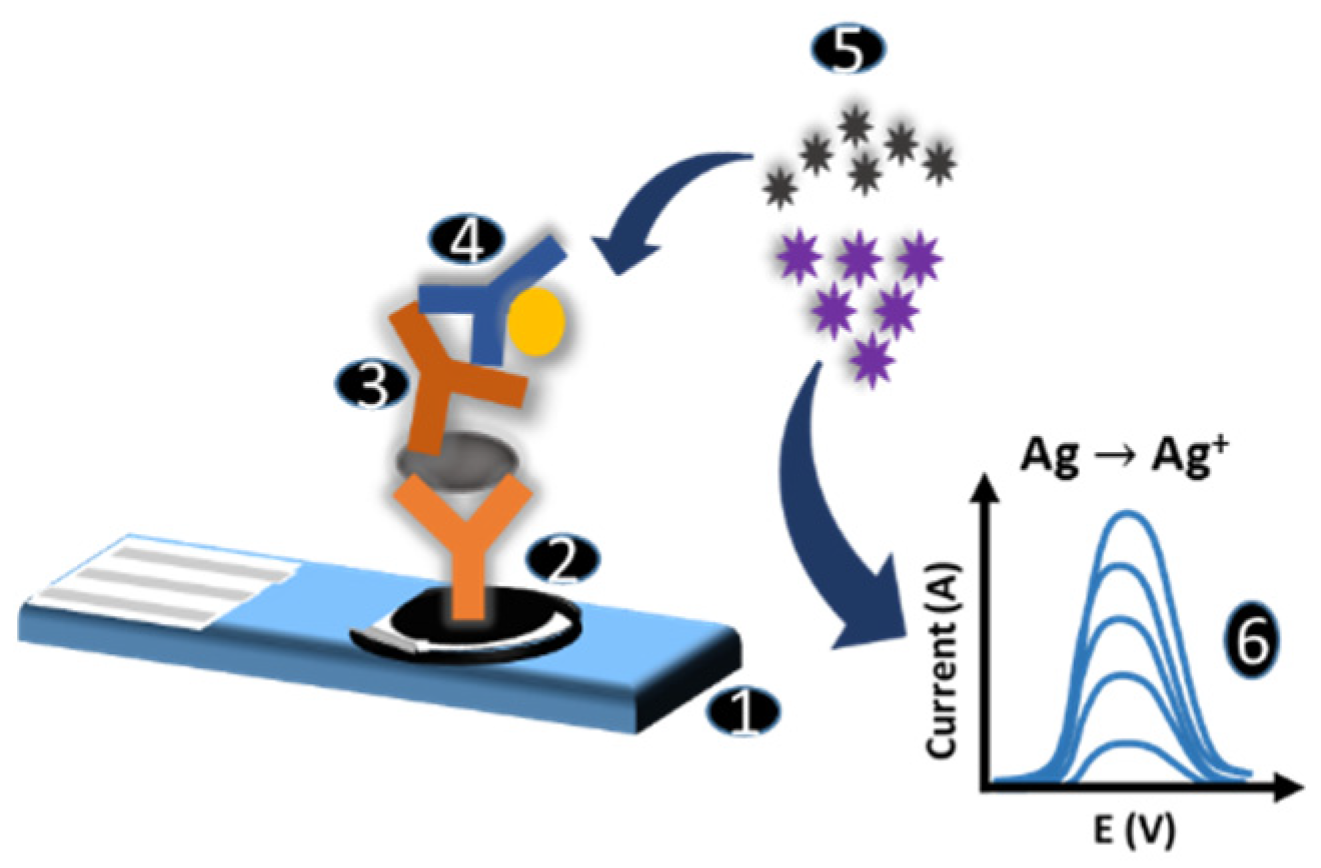
2.4. Immunosensor Assay and Electrochemical Measurements

The representative scheme of the immunosensor assay and detection strategy is presented in Figure 1. The WE of the SPCE was coated with C-Ab (10 µL, 20 µg mL−1) and left to incubate overnight at 4 °C. After rinsing the sensor with buffer B1, surface blocking was carried out using 40 µL of a 2-% (m/V) BSA solution during 30 min. After this, the sensor was washed with buffer B1 and incubated with 40 µL of a previously mixed (10 min before use) solution containing the antigen, the detection antibody (1:2000) and BSA (1% (m/V)) during 60 min. After rinsing with buffer B1, 40 µL of an AP-Ab solution (1:40,000) was placed on the sensor for 60 min. The sensor was then rinsed with buffer B2, and the enzymatic reaction was carried out by depositing 40 µL of a mixed solution containing 3-IP and silver nitrate on the SPCE for 20 min. LSV was used to record the analytical signal (potential range: −0.03 V to +0.4 V; scan rate: 50 mV/s). All analyses were performed in triplicate and carried out at room temperature (20 ± 1 °C).

3. Results and Discussion

3.1. Optimization Studies

The immunosensing strategy was based on a sandwich-type assay performed on bare SPCEs as transducers. In the first phase of the immunosensor development, two different surface blockers were tested: β-casein (2% (m/V)) and BSA (2% (m/V)). As can be observed in Figure 2, when BSA was used, the highest peak current intensity (ip) and signal-to-blank ratio (S/B) was obtained.
In order to select the optimum concentrations of both the capture and detection antibodies, a standard solution of tropomyosin (10 ng mL−1) was used. First, for fixed dilutions of D-Ab (1:250) and AP-Ab (1:20,000), different C-Ab concentrations of between 2.5 and 20 µg mL−1 were tested. The obtained results reveal that a concentration of 20 µg mL−1 resulted in the highest peak current intensity and S/B ratio. After this and maintaining the AP-Ab dilution at 1:20,000, different D-Ab dilutions (between 1:250 and 1:12,000) were tested. The selected dilution was 1:2000 because the highest ip and lowest blank signal were obtained. After selecting the C-Ab concentration (20 µg mL−1) and D-Ab dilution (1:2000), different assay formats were studied in order to reduce the number of incubation steps and, subsequently, the assay time. Different steps were combined and the most adequate combination, the previous mixing of the antigen with the D-Ab, led to a 60-min reduction in the assay time. The next studies were performed to select the optimum AP-Ab dilution by testing dilutions of between 1:10,000 and 1:40,000. A 1:40,000 dilution was selected because a low blank signal and the highest S/B ratio were observed. After this, the AP-Ab incubation time was studied between 15 and 60 min, with the best results obtained for the 60 min incubation time. A summary of the optimization studies is indicated in Table 1.

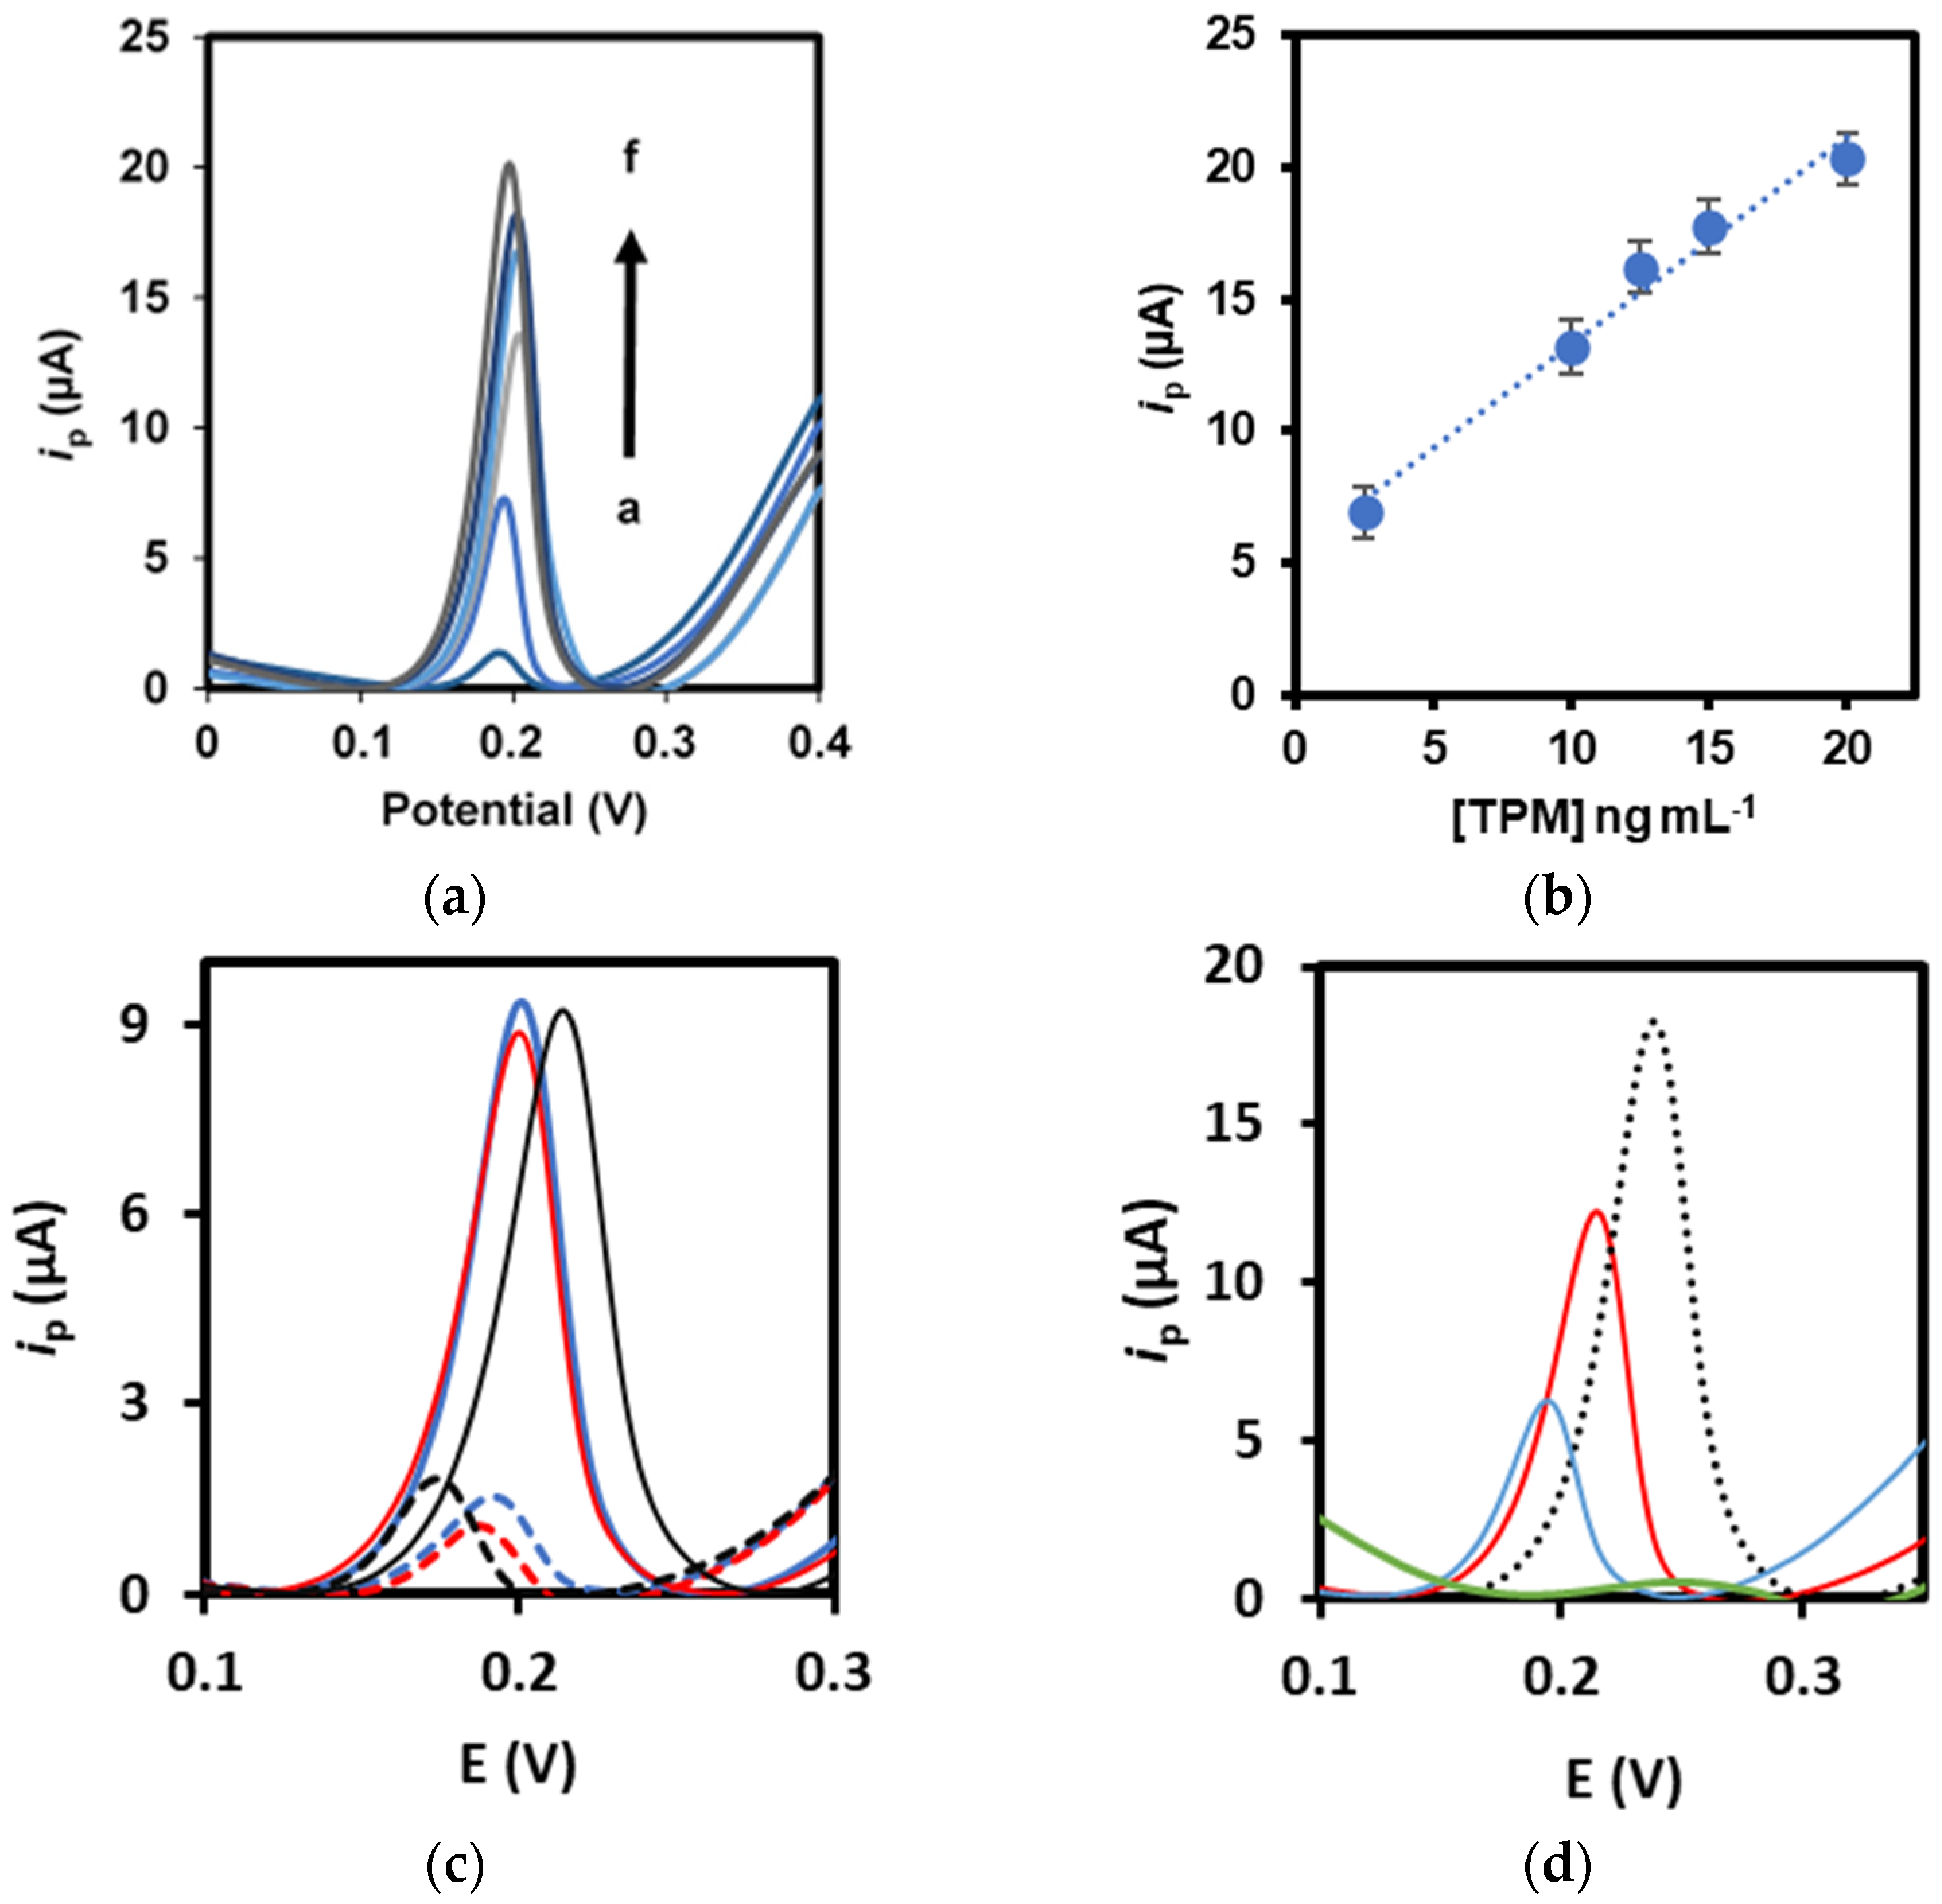
3.2. Analytical Performance

To establish the performance characteristics of the immunosensor, standard solutions with different TPM concentrations (2.5–50 ng mL−1) were analyzed. A linear relationship was observed between 2.5 and 20 ng mL−1 (ip (µA) = 0.787 (tropomyosin) (ng mL−1) + 5.45, r = 0.990, n = 5). Examples of voltammograms in the linear range (Figure 3a) and the calibration plot (Figure 3b) are shown in Figure 3. The limit of detection (LOD) was calculated as three times the standard deviation of the blank divided by the slope and the value obtained was 1.7 ng mL−1. The limit of quantification (LOQ) was calculated as 10 times the standard deviation of the blank divided by the slope, obtaining a concentration of 5.7 ng mL−1. The coefficient of variation of the method was <9%.

3.3. Selectivity and Interference Studies

The selectivity of the sensor towards TPM was evaluated by analyzing other allergens such as Ara h 1 (peanut allergen, 250 ng mL−1), Cyp C 1 (fish allergen, 20 ng mL−1) and Ovalbumin (GAL d 2, chicken egg allergen, 1% (m/V)). Examples of the obtained voltammograms are shown in Figure 3c. Besides these allergens, histamine (6.8 mg mL−1), a biogenic amine and the most important fish freshness indicator, was also included in this study. The signal for all these compounds was similar to the blank signal, confirming the selectivity of the proposed sensor. Besides this, TPM was mixed with each of the compounds to evaluate their interference in the analysis. The obtained signals were nearly the same as the one obtained for a 10-ng mL−1 TPM solution, which indicates that the other allergens and histamine did not significantly interfere in the analysis.

3.4. Applicability to Food Analysis

The feasibility of the sensor for the determination of TPM in commercial food samples was tested. Shrimp, shrimp sauce and crab paste were analyzed, obtaining TPM concentrations of 80.42 ± 2.7 µg g−1, 170.4 ± 1.80 ng g−1 and 21.6 ± 4.13 ng g−1, respectively. The developed immunosensor was also used to detect the presence of TPM in chicken paste. As expected, this sample gave a negative result (no significant difference when compared with the blank signal), so the TPM concentration was below the sensor’s LOD. Examples of the obtained voltammograms are shown in Figure 3d.

4. Conclusions

The current trends in analytical chemistry are focused on the development of simple and in situ analysis devices to ensure food safety. In this work, a simple immunosensor for tropomyosin analysis was developed. This immunoassay only takes 2 h 50 min, and it requires 40 µL of sample to perform the analysis. The sensor can determine tropomyosin in a concentration range between 2.5 and 20 ng mL−1 and a limit of detection of 1.7 ng mL−1 was achieved. The developed methodology fulfills the requirements of (bio)sensor construction such as small size and the use of low amounts of reagents and samples. Moreover, it allows the possibility of decentralized analysis, which could be useful for the control of tropomyosin, avoiding cases of food allergy.

Author Contributions

Conceptualization, M.F. and H.P.A.N.; methodology, M.F. and H.P.A.N.; validation, all authors; formal analysis, M.F. and R.T.; investigation, M.F. and R.T.; resources, H.P.A.N. and C.D.-M.; data curation, M.F. and R.T.; writing—original draft preparation, R.T.; writing—review and editing, M.F. and H.P.A.N.; visualization, R.T.; supervision, M.F., H.P.A.N., E.C.-R. and C.D.-M.; project administration, H.P.A.N.; funding acquisition, H.P.A.N. and C.D.-M. All authors have read and agreed to the published version of the manuscript.

Funding

This research was funded by the European Union (FEDER funds through COMPETE POCI-01-0145-FEDER-030735) and National Funds (Fundação para a Ciência e a Tecnologia) through the project PTDC/QUI-QAN/30735/2017—TracAllerSens—Electrochemical sensors for the detection and quantification of trace amounts of allergens in food products.

Institutional Review Board Statement

Not applicable.

Informed Consent Statement

Not applicable.

Data Availability Statement

Not applicable.

Acknowledgments

This work was also supported by Portuguese national funds (FCT/MCTES, Fundação para a Ciência e a Tecnologia and Ministério da Ciência, Tecnologia e Ensino Superior) through the project UIDB/50006/2020.

Conflicts of Interest

The authors declare no conflict of interest.

References

  1. Jiang, D.; Ji, J.; Sun, X.; Zhang, Y.; Zhang, G.; Tang, L. Mast cell-based electrochemical biosensor for quantification of the major shrimp allergen Pen a 1 (tropomyosin). Biosens. Bioelectron. 2013, 50, 150–156. [Google Scholar] [CrossRef]
  2. Angulo-Ibáñez, A.; Eletxigerra, U.; Lasheras, X.; Campuzano, S.; Merino, S. Electrochemical tropomyosin allergen immunosensor for complex food matrix analysis. Anal. Chim. Acta 2019, 1079, 94–102. [Google Scholar] [CrossRef]
  3. Wang, Y.; Rao, Z.; Zhou, J.; Zheng, L.; Fu, L. A chiral assembly of gold nanoparticle trimer-based biosensors for ultrasensitive detection of the major allergen tropomyosin in shellfish. Biosens. Bioelectron. 2019, 132, 84–89. [Google Scholar] [CrossRef]
  4. Mohamad, A.; Rizwan, M.; Keasberry, N.A.; Nguyen, A.S.; Lam, T.D.; Ahmed, M.U. Gold-microrods/Pd-nanoparticles/polyaniline-nanocomposite-interface as a peroxidase-mimic for sensitive detection of tropomyosin. Biosens. Bioelectron. 2020, 155, 112108. [Google Scholar] [CrossRef]
  5. Chinnappan, R.; Rahamn, A.A.; AlZabn, R.; Kamath, S.; Lopata, A.L.; Abu-Salah, K.M.; Zourob, M. Aptameric biosensor for the sensitive detection of major shrimp allergen, tropomyosin. Food Chem. 2020, 314, 126133. [Google Scholar] [CrossRef] [PubMed]
  6. Fanjul-Bolado, P.; Hernández-Santos, D.; González-García, M.B.; Costa-García, A. Alkaline Phosphatase-Catalyzed Silver Deposition for Electrochemical Detection. Anal. Chem. 2007, 79, 5272–5277. [Google Scholar] [CrossRef] [PubMed]
  7. Neves, M.M.P.S.; González-García, M.B.; Nouws, H.P.A.; Costa-García, A. An electrochemical deamidated gliadin antibody immunosensor for celiac disease clinical diagnosis. Analyst 2013, 138, 1956–1958. [Google Scholar] [CrossRef] [PubMed] [Green Version]
  8. Neves, M.M.P.S.; González-García, M.B.; Nouws, H.P.A.; Costa-García, A. Celiac disease detection using a transglutaminase electrochemical immunosensor fabricated on nanohybrid screen-printed carbon electrodes. Biosens. Bioelectron. 2012, 31, 95–100. [Google Scholar] [CrossRef] [PubMed] [Green Version]
Figure 1. Schematic representation of the developed immunoassay. (1) Screen-printed carbon electrode; (2) C-Ab immobilization; (3) addition of a mixture containing standard/sample and D-Ab; (4) addition of AP-Ab; (5) addition of the enzymatic substrate (3-IP) and silver ions; and (6) voltametric detection of Ag0.
Chemproc 05 00062 g001
Figure 2. Peak current intensities (ip) obtained for the study of the surface blocker (casein and BSA, both at 2% (m/V)). Black bars: blank assay. White bars: TPM (10 ng mL−1). Results are presented as average ± standard deviation (n = 3). Experimental conditions: C-Ab—10 µg mL−1; D-Ab—1:250 dilution; AP-Ab—1:20,000 dilution; 3-IP—1.0 × 10⁻³ M; and AgNO3—4.0 × 10⁻⁴ M.
Chemproc 05 00062 g002
Figure 3. (a) Examples of voltammograms in the linear range (a—blank; b—2.5 ng mL−1; c—10 ng mL−1; d—12.5 ng mL−1; e—15 ng mL−1; and f—20 ng mL−1). (b) Calibration plot. (c) Examples of voltammograms obtained in the selectivity and interference studies: TPM (10 mg L−1, blue line, control) combined with Cyp C 1 (20 ng mL−1, red line) and Ovalbumin (1% (m/V), black line) and blank (0 ng mL−1, blue dashed line, control) with the addition of Cyp c 1 (200 ng mL−1, red dashed line) and Ovalbumin (1% (m/V), black dashed line). (d) Examples of voltammograms obtained in the analysis of food samples (shrimp sauce—black dashed line; shrimp—red line; crab paste—blue line; and chicken paste—green line). Experimental conditions: C-Ab—20 µg mL−1; BSA—2% (m/V); mixture of standard TPM solutions with D-Ab—1:2000; AP-Ab—1:40,000; 3-IP—1 × 10⁻³ M; and AgNO3—4 × 10⁻⁴ M.
Chemproc 05 00062 g003
Table 1. Optimization of the different experimental variables involved in the construction of the immunosensor for TPM analysis.
VariableStudied RangeSelected Value
(C-Ab), µg mL−12.5–2020
(D-Ab), dilution1:250–1:12,0001:2000
(AP-Ab), dilution1:10,000–1:40,0001:40,000
AP-Ab incubation time, min15–6060
Publisher’s Note: MDPI stays neutral with regard to jurisdictional claims in published maps and institutional affiliations.

