Proceeding Paper

Field Nitrogen Dioxide and Ozone Monitoring Using Electrochemical Sensors with Partial Least Squares Regression †

Laboratoire de Conception, Optimisation et Modélisation des Systèmes, LCOMS EA 7306 Université de Loraine, 57000 Metz, France
*
Author to whom correspondence should be addressed.
Presented at the 1st International Electronic Conference on Chemical Sensors and Analytical Chemistry, 1–15 July 2021; Available online: https://csac2021.sciforum.net/.
Chem. Proc. 2021, 5(1), 61; https://doi.org/10.3390/CSAC2021-10622
Published: 6 July 2021

Abstract

:
Low-cost gas sensors detect pollutants gas at the parts-per-billion level and may be installed in small devices to densify air quality monitoring networks for the spread analysis of pollutants around an emissive source. However, these sensors suffer from several issues such as the impact of environmental factors and cross-interfering gases. For instance, the ozone (O3) electrochemical sensor senses nitrogen dioxide (NO2) and O3 simultaneously without discrimination. Alphasense proposes the use of a pair of sensors; the first one, NO2-B43F, is equipped with a filter dedicated to measure NO2. The second one, OX-B431, is sensitive to both NO2 and O3. Thus, O3 concentration can be obtained by subtracting the concentration of NO2 from the sum of the two concentrations. This technique is not practical and requires calibrating each sensor individually, leading to biased concentration estimation. In this paper, we propose Partial Least Square regression (PLS) to build a calibration model including both sensors’ responses and also temperature and humidity variations. The results obtained from data collected in the field for two months show that PLS regression provides better gas concentration estimation in terms of accuracy than calibrating each sensor individually.

1. Introduction

Urban air pollution is a major preoccupation [1]. Government organizations encourage research on low-cost gas sensors to improve their performances in order to complement the actual air pollution monitoring networks by providing better spatiotemporal resolution of the pollutants’ spread [2]. Today, low-cost sensors such as electrochemical sensors can sense most pollutant gases at the magnitude of parts per billion (ppb) [3]. However, several limitations inhibit systems based on these sensors to reach high performance similar to the regular instruments [4]. Among these limitations is the influence of environmental factors—essentially, the temperature and humidity and the interfering gases present in the ambient air, particularly in the case of measuring O3 and NO2 [5]. The existing commercial electrochemical sensors for measuring O3 respond simultaneously to O3 and NO2, without discrimination, because NO2 and O3 are reducible at similar potentials on carbon or gold electrodes [6]. Therefore, the responses of these sensors are proportional to the combined concentration of O3 and NO2. This nonselectivity of sensors becomes an obstacle for air monitoring applications where NO2 and O3 are present simultaneously with the same order of concentration magnitude. In this paper, we evaluate electrochemical sensors for O3 and NO2 for in field and in real application conditions. We propose to calibrate simultaneously the two sensors using Partial Least Square regression (PLS) while considering also the temperature and humidity variations. The remainder of this paper is organized as follows: we present first the experimental set up and data collection, then, the calibration procedure with results, and finally, a conclusion.

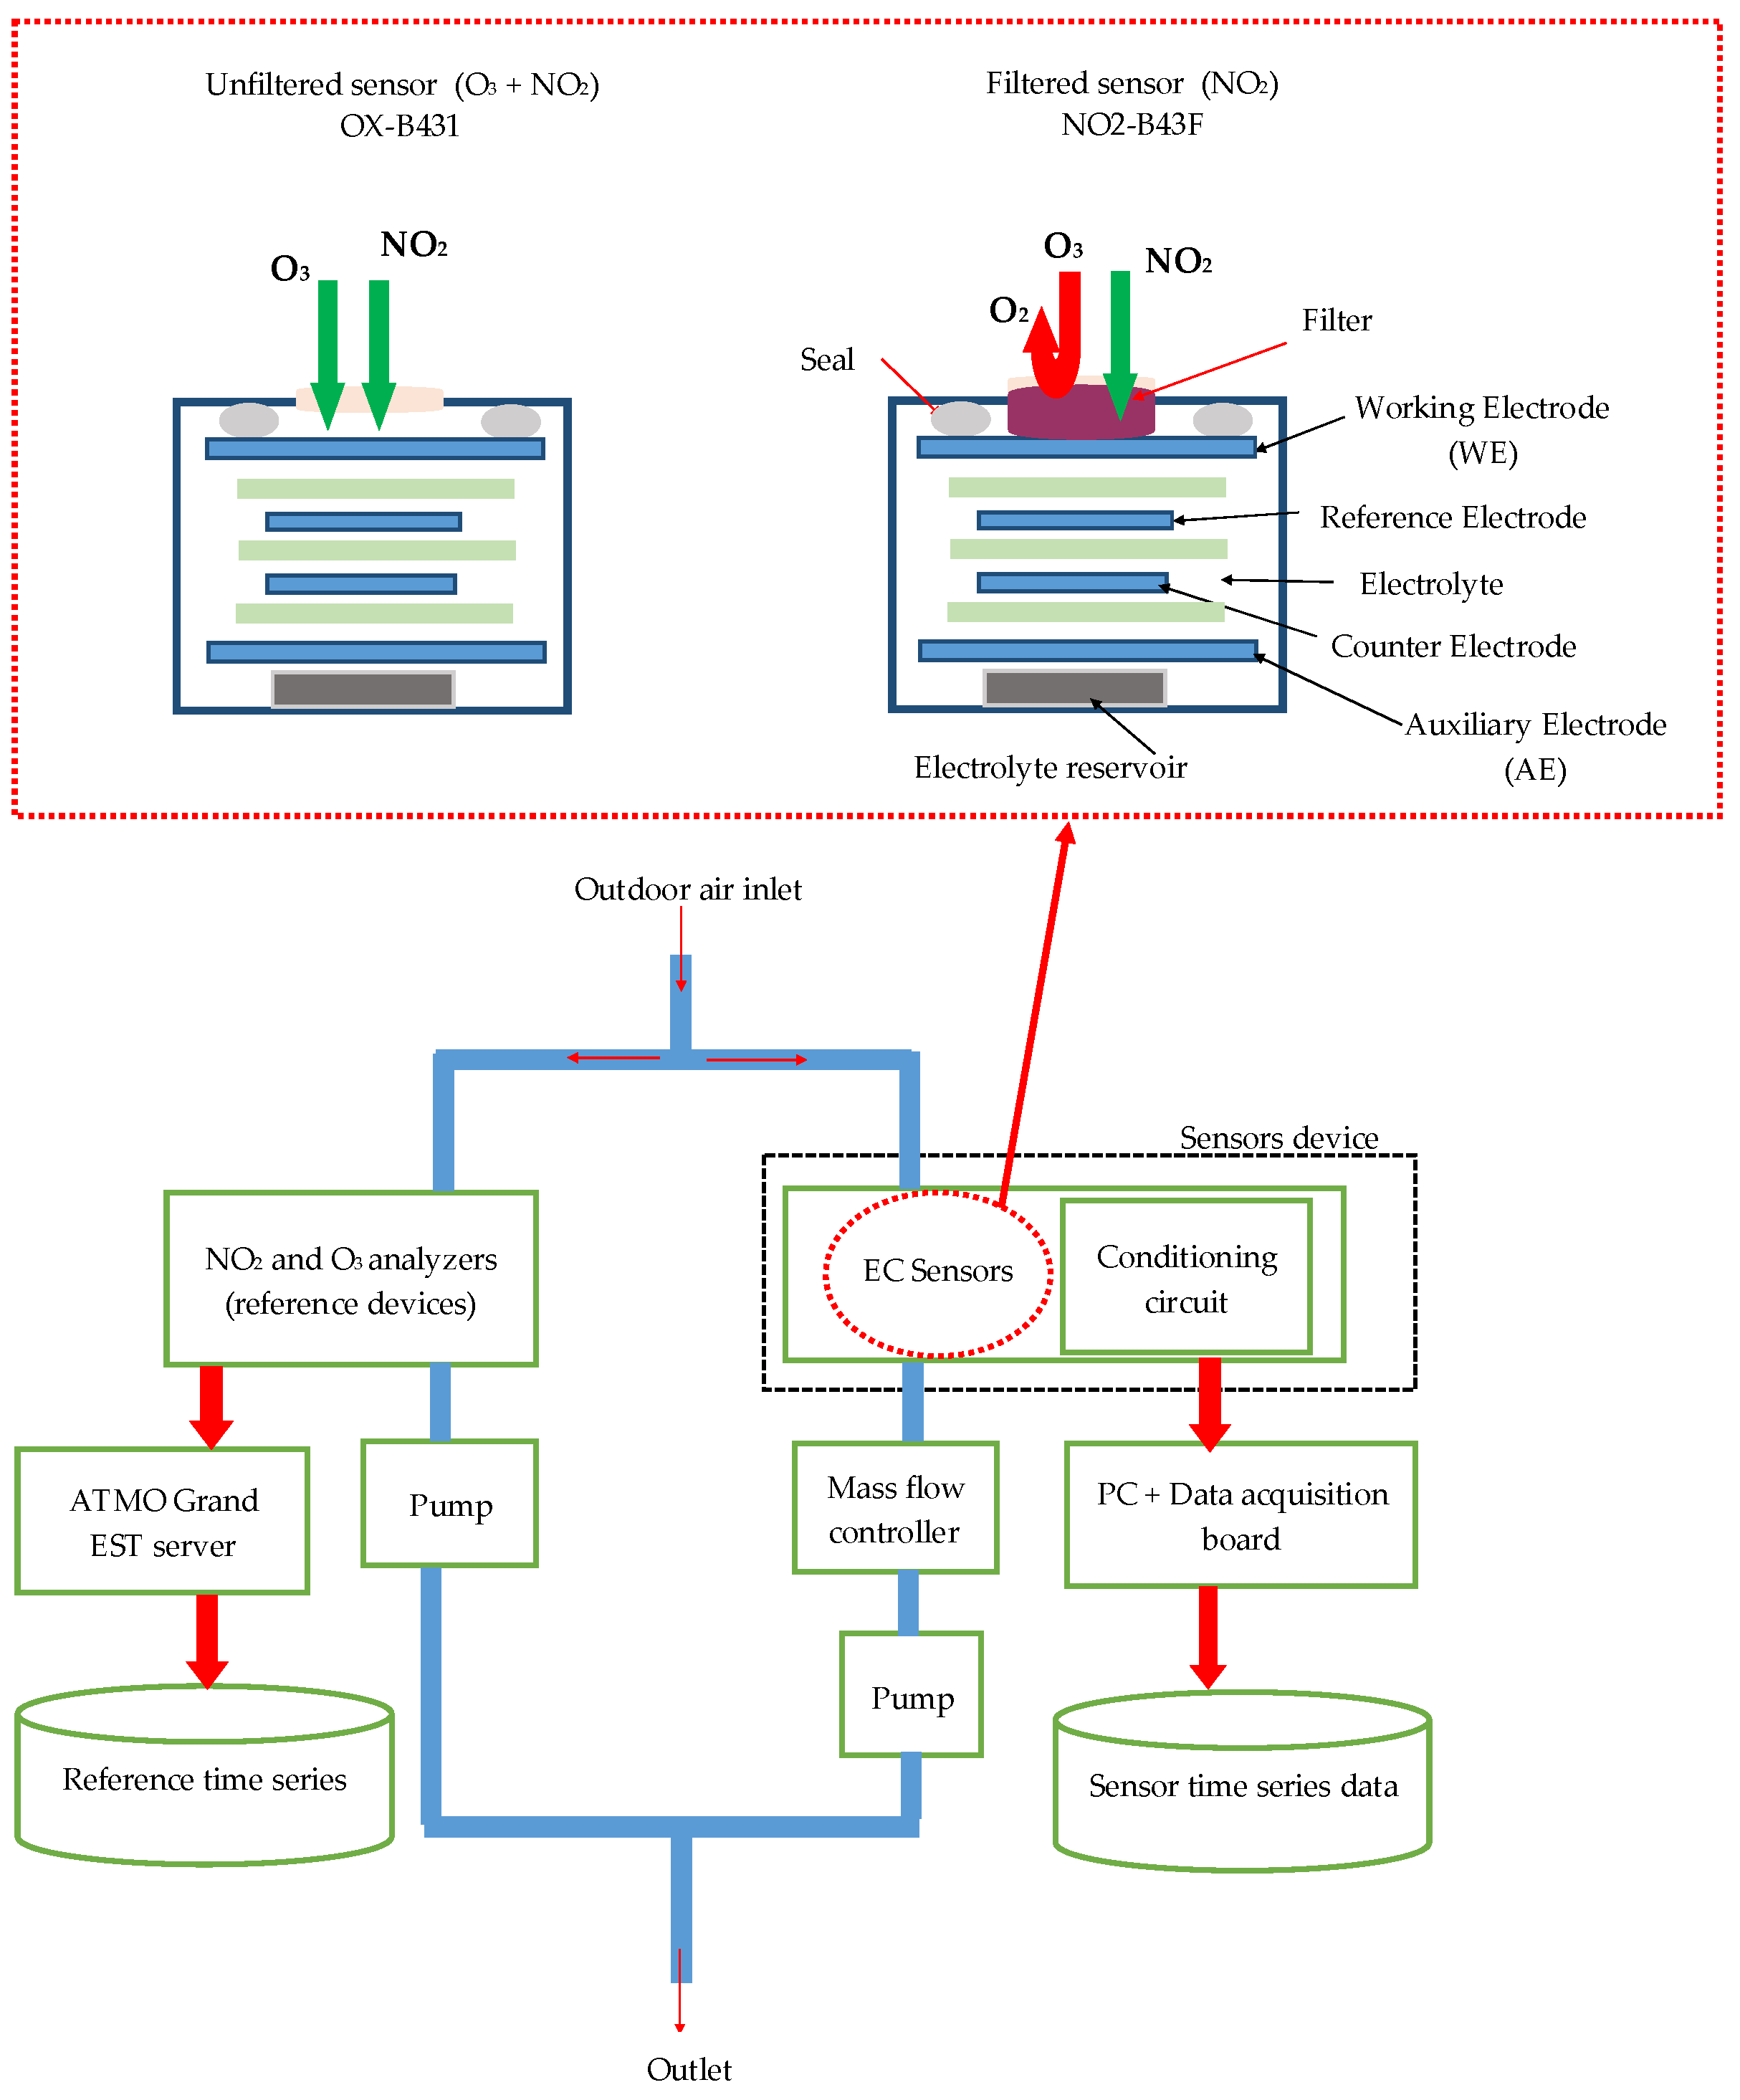
2. Experiment Set Up and Data Collection

In this work, we focused on measuring the concentration of O3 and NO2 in ambient air because they are the principal pollutant gases in French cities that are still exceeding the limited values defined by the European directives [7]. Therefore, we designed a device constituted of two electrochemical sensors provided by Alphasense LTD—NO2-B41F and OX-B431—dedicated to measure NO2 and oxidizing gases, respectively. The device also contains the sensors’ conditioning circuits, the gas exposure chamber, and the data acquisition unit. The conditioning circuits consist of potentiostat circuits that allow amplifying and converting the sensor electrode currents to voltages. The device is placed inside the air monitoring station managed by ATMO Grand Est agency. This station is located beside a highway, crossing Metz city, France. Our device works in dynamic mode for air sampling; thus, a pump and a mass flow controller are placed on the exposure chamber exit to generate a constant and continuous airflow by suction (Figure 1). We set the airflow rate to 500 mL/min, in order to obtain the same airflow rate as the ATMO Grand Est O3 and NO2 analyzers. The collected data represent the voltages of the sensor responses with a data sampling frequency of 200 Hz. Sensor responses are then averaged over a period of 10 s and recorded on a computer using Matlab software. Finally, recorded data are averaged again every 15 min in order to comply with the reference data provided by ATMO Grand Est. Data are collected continuously from 22 February 2019 to 14 April 2019.

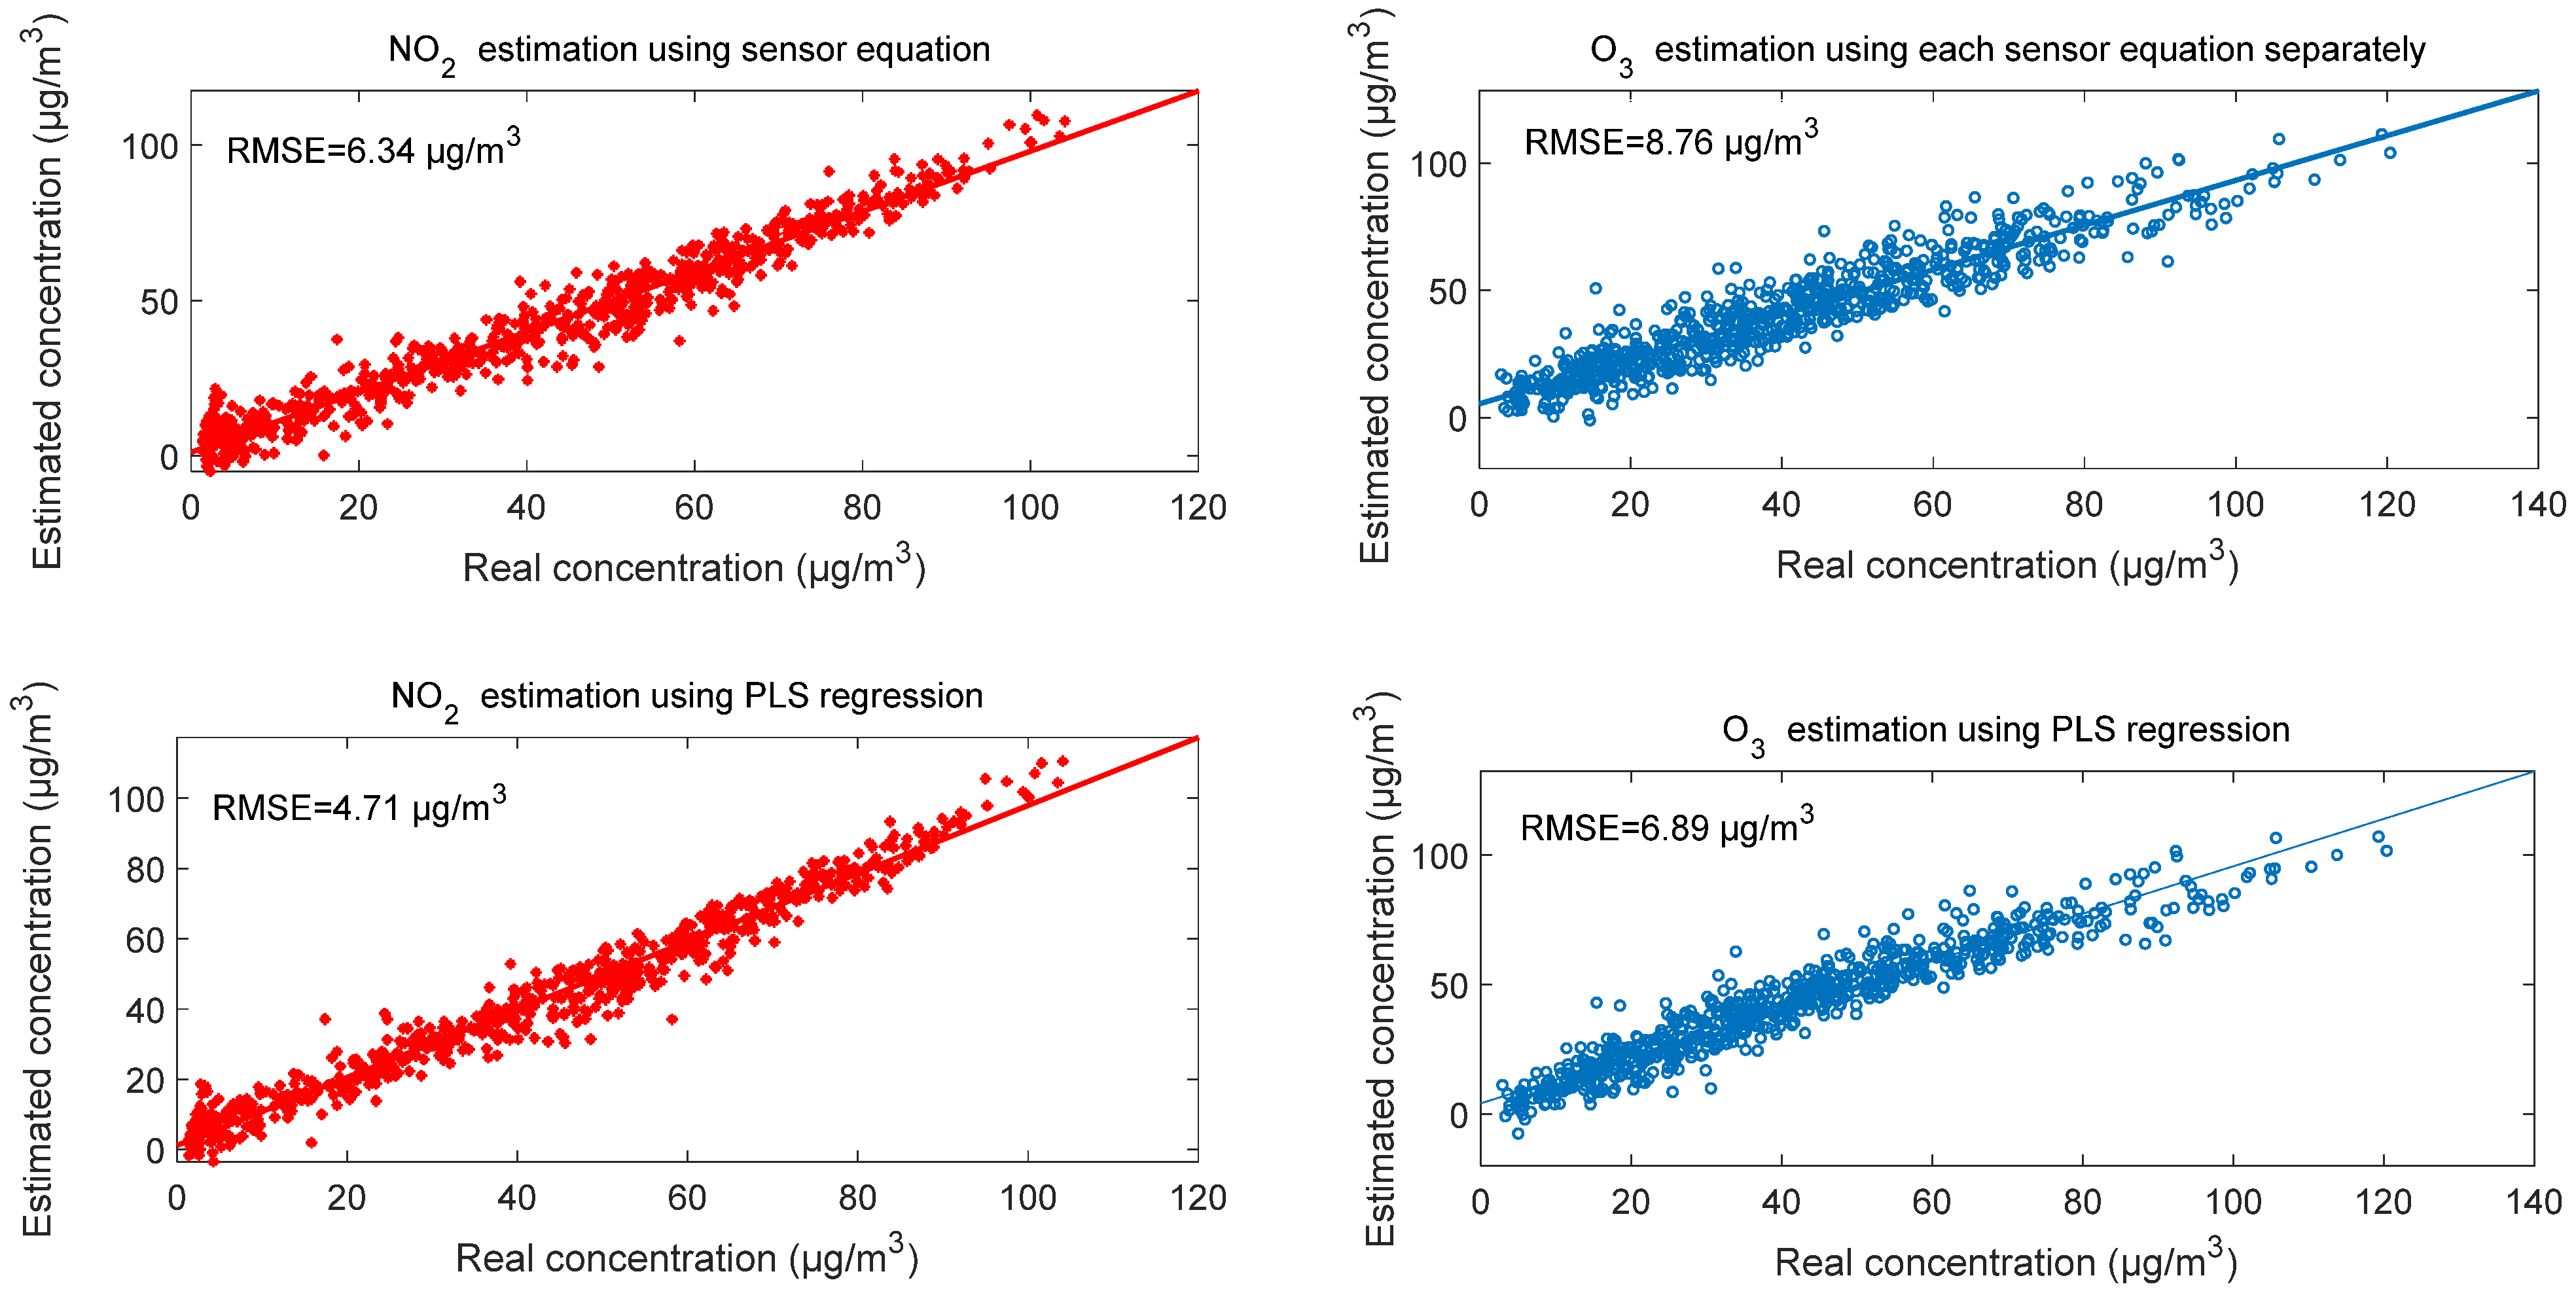
3. Sensors Calibration

To quantify O3 and NO2 concentrations, the manufacturer Alphasense recommends the use of a pair of electrochemical sensors: a model OX-B431 that responds to both gases (O3 + NO2) and a model NO2-B43F that responds only to NO2. The NO2-B43F sensor is equipped with a manganese dioxide filter, which catalyzes O3 into oxygen, thus preventing the sensor from responding to O3 present in the environment (Figure 1). To determine the O3 concentration, the contribution of NO2 to the response of the OX-B431 sensor must be removed. Therefore, we first need to calculate the NO2 concentration with the NO2-B43F sensor and then subtract it from the concentration provided by the OX-B431 sensor. The calibration procedure of this pair of sensors is performed as follows:
  • Calibrate the NO2-B43F sensor for measuring NO2 according to Equation (1):
    [NO2] = (WENO2-B43F − AENO2-B43F) α1 + α2,
    where [NO2] is the concentration of the NO2; WENO2-B43F and AENO2-B43F are signals of the working and auxiliary electrodes of NO2-B43F sensor, respectively; α1 and α2 are regression coefficients that can be determined by a simple linear regression.
  • Calibrate the OX-B431 sensor to measure the mixture (NO2 + O3) according to Equation (2):
    [NO2 + O3] = (WEOX-B431) − AEOX-B431) b1 + b2,
    where WEOX-B431 and AEOX-B431 are signals of the working and auxiliary electrodes of OX-B431 sensor, respectively; b1 and b2 are regression coefficients determined by a simple linear regression.
The concentration of O3 will be the difference between the concentration obtained by the OX-B431 sensor and the concentration obtained by the NO2-B43F sensor:
[O3] = [NO2 + O3] − [NO2],
The concentrations of both O3 and NO2 are typically 5 to 120 µg/m3 at the roadside, so intelligent data analysis is required to differentiate each gas concentration. Our proposition is to combine both sensors’ signals in the same equation plus the temperature and humidity variations:
[NO2] = c0 + c1 WENO2-B43F + c2 AENO2-B43F + c3 WEOX-B431 + c4 AEOX-B431 + c5 T + c6 H,
[O3] = d0 + d1 WENO2-B43F + d2 AENO2-B43F + d3 WEOX-B431 + d4 AEOX-B431 + d5 T + d6 H,
where c0, c1….c6 and d0, d1….d6 are regression coefficients determined by using PLS [8]; T and H are the temperature and humidity, respectively.
The comparison between calibration of each sensor individually and the combination of the two sensors’ signals with temperature and humidity variation using PLS regression shows that the concentration estimation is better in the case of using PLS regression than the case of calibrating each sensor individually. Figure 2 illustrates that in the case of using PLS regression, the root-mean-square errors (RMSE) are 4.71 µg/m3 and 6.89 µg/m3 for NO2 and O3, respectively, whereas in the case of using each sensor individually, the RMSE values were 6.34 µg/m3 and 8.76 µg/m3, respectively. We note also that the estimation of NO2 is better than the estimation of O3 in both calibration cases. The reason behind this is that NO2 estimation depends essentially on one sensor, whereas the estimation of O3 depends on both sensors.

4. Conclusions

In this work, electrochemical sensors calibration is proposed using PLS regression. First, we deployed a device to collect data in real outdoor conditions; then, we proposed multiple linear regression to estimate simultaneously nitrogen dioxide and ozone concentration. We found that the use of a pair with PLS regression is better than calibrating each sensor individually, as the RMSE reduced from 8.76 µg/m3 to 6.89 µg/m3 for ozone concentration estimation.

Author Contributions

The work presented here was carried out in collaboration between all authors. Conceptualization, R.L.; methodology, R.L.; validation, E.L., A.S., and M.S.; writing—original draft, R.L.; writing—review and editing, E.L., A.S., and M.S. All authors have read and agreed to the published version of the manuscript.

Funding

This research received no external funding.

Institutional Review Board Statement

Not applicable.

Informed Consent Statement

Not applicable.

Data Availability Statement

Not applicable.

Acknowledgments

We would like to thank ATMO GRAND EST agency for their support, including access to monitoring stations and data from their analyzers. The authors would also to thank Damien Durant from ATMO GRAND EST, head of metrological unit for his assistance and his helpful advice.

Conflicts of Interest

The authors declare no conflict of interest.

References

  1. Helmut, M. Air pollution in cities. Atmos. Environ. 1999, 33, 4029–4037. [Google Scholar] [CrossRef]
  2. Castell Balaguer, N.; Dauge, F.R.; Schneider, P.; Vogt, M.; Lerner, U.; Fishbain, B.; Broday, D.; Bartonova, A. Can commercial low-cost sensor platforms contribute to air quality monitoring and exposure estimates? Environ. Int. 2017, 99, 293–302. [Google Scholar] [CrossRef] [PubMed]
  3. Wei, P.; Ning, Z.; Ye, S.; Sun, L.; Yang, F.; Wong, K.C.; Westerdahl, D.; Louie, P.K. Impact Analysis of Temperature and Humidity Conditions on Electrochemical Sensor Response in Ambient Air Quality Monitoring. Sensors 2018, 18, 59. [Google Scholar] [CrossRef] [PubMed] [Green Version]
  4. Maag, B.; Zhou, Z.; Thiele, L.B. A Survey on Sensor Calibration in Air Pollution Monitoring Deployments. IEEE Internet Things J. 2018, 5, 4857–4870. [Google Scholar] [CrossRef] [Green Version]
  5. Laref, R.; Losson, E.; Sava, A.; Siadat, M. Field Evaluation of Low Cost Sensors Array for Air Pollution Monitoring. In Proceedings of the 10th IEEE International Conference on Intelligent Data Acquisition and Advanced Computing Systems: Technology and Applications, Metz, France, 18–21 September 2019; pp. 849–853. [Google Scholar] [CrossRef]
  6. Hossain, M.; Saffell, J.; Baron, R. Differentiating NO2 and O3 at Low Cost Air Quality Amperometric Gas Sensors. ACS Sens. 2016, 1, 1291–1294. [Google Scholar] [CrossRef]
  7. Le Moullec, A. Bilan de la qualité de l’air extérieur en France en 2017. 2018, p. 36. Available online: https://www.statistiques.developpement-durable.gouv.fr/sites/default/files/2018-10/datalab-45-bilan-qualite-air-exterieur-france-2017-octobre2018.pdf (accessed on 5 July 2021).
  8. Jurs, P.C.; Bakken, G.A.; McClelland, H.E. Computational methods for the analysis of chemical sensor array data from volatile analytes. Chem. Rev. 2000, 100, 2649–2678. [Google Scholar] [CrossRef] [PubMed]
Figure 1. Experiment setup diagram and the schematic of filtered and unfiltered electrochemical sensors.
Chemproc 05 00061 g001
Figure 2. Correlation between reference concentration and estimated concentration of NO2 and O3.
Chemproc 05 00061 g002
Publisher’s Note: MDPI stays neutral with regard to jurisdictional claims in published maps and institutional affiliations.

