
Article

Impact of a History of Obesity on Diabetic Microvascular Complications in Patients with Type 2 Diabetes

1
Department of Pharmacotherapy, Meiji Pharmaceutical University, Tokyo 204-8588, Japan
2
Department of Diabetes and Metabolism, The Institute for Medical Science, Asahi Life Foundation, Tokyo 103-0002, Japan
*
Author to whom correspondence should be addressed.
Diabetology 2026, 7(8), 146; https://doi.org/10.3390/diabetology7080146
Submission received: 16 June 2026 / Revised: 14 July 2026 / Accepted: 20 July 2026 / Published: 3 August 2026

Abstract

Background/Objectives: The prevalence of obesity is increasing among Japanese patients with type 2 diabetes (T2D); however, the impact of obesity history and severity on microvascular complications remains poorly understood. This study aimed to investigate the association of lifetime maximum body mass index (BMI) and BMI at the first clinical visit with the development and progression of diabetic nephropathy and retinopathy. Methods: This retrospective cohort study included T2D patients who first visited the clinic of the Institute for Medical Sciences, Asahi Life Foundation between 2005 and 2022. Patients were categorized into five groups based on both lifetime maximum and first-visit BMI: underweight, normal weight, class I obesity, class II obesity, and severe obesity. The primary endpoints were renal events (sustained increase in proteinuria or ≥40% decline in eGFR) and retinal events (worsening of diabetic retinopathy by ≥1 stage). Results: A history of severe obesity, based on the lifetime maximum BMI, was an independent risk factor for proteinuria progression. While a history of severe obesity was associated with all endpoints in unadjusted analyses, these associations with eGFR decline and retinopathy were not significant after adjusting for covariates. In contrast, the BMI at the first visit was significantly associated with retinal events but not with renal events. Conclusions: A history of maximum lifetime obesity is a critical predictor of the proteinuria progression. A history of obesity, a simple clinical metric, is a valuable tool for identifying high-risk patients and may contribute to more effective preventative strategies.

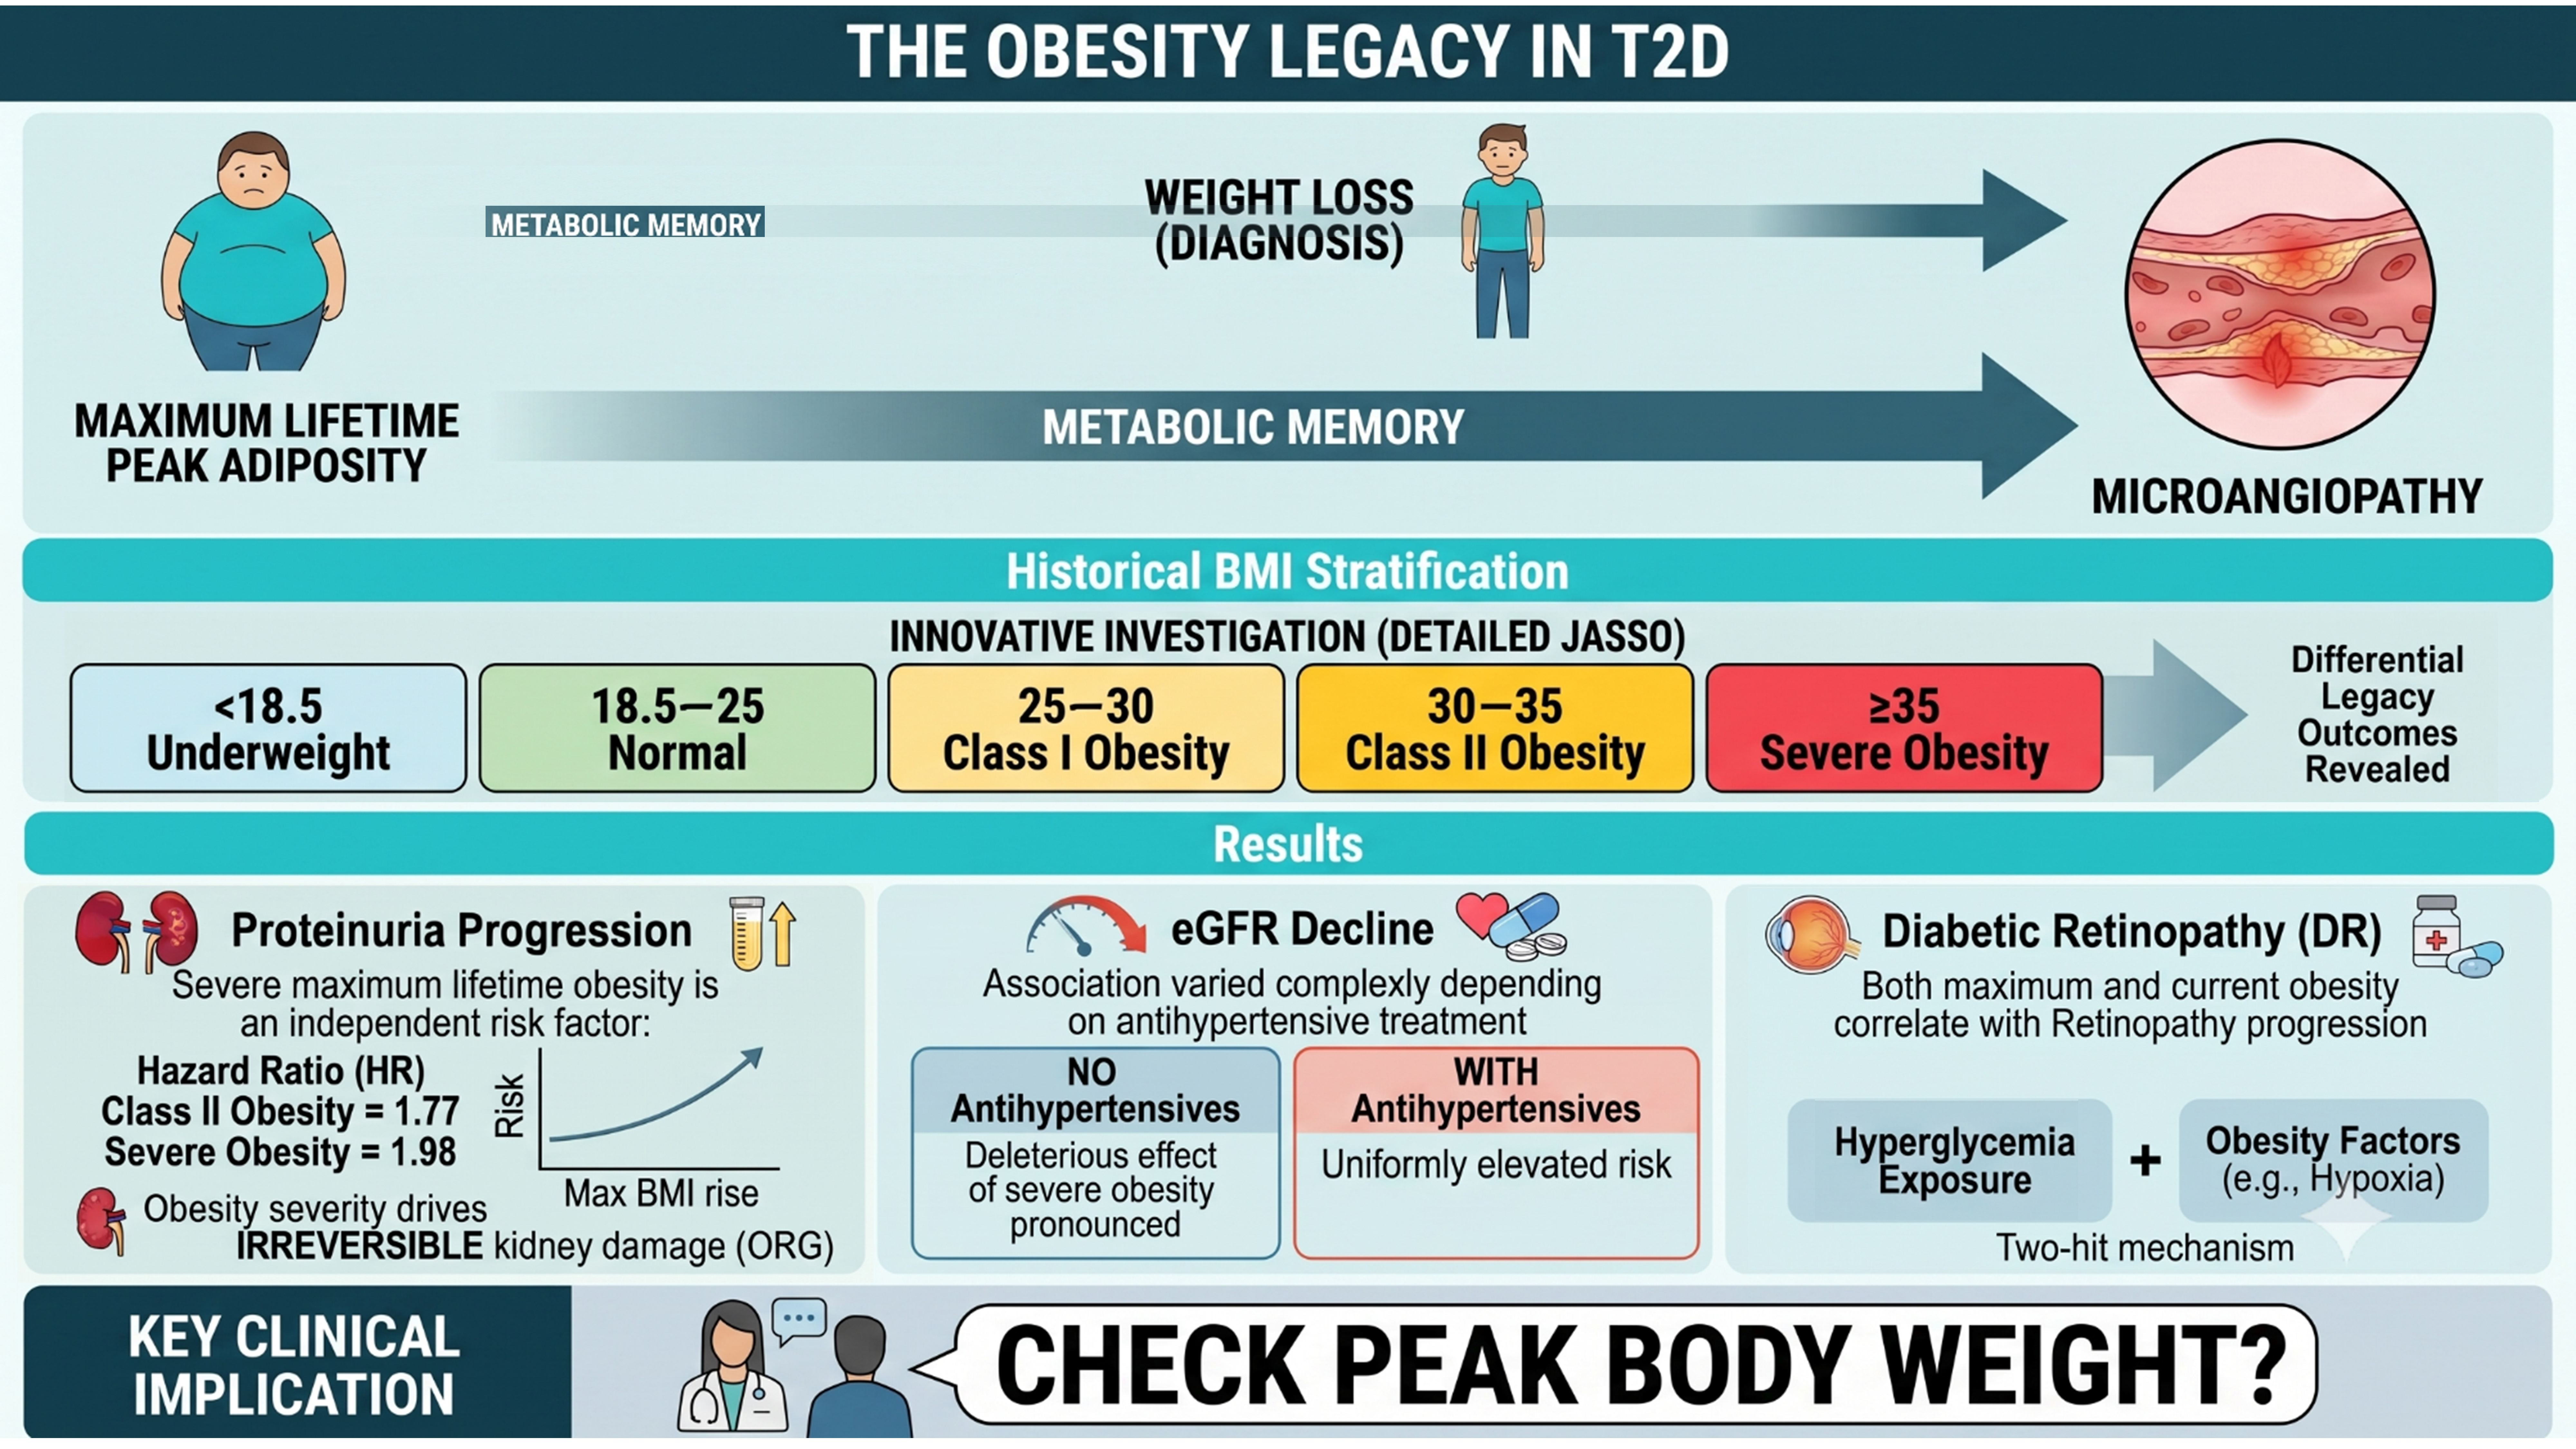
Graphical Abstract

1. Introduction

Diabetic kidney disease (DKD) is a primary microvascular complication affecting 30–40% of individuals with type 2 diabetes (T2D) and is the leading cause of end-stage renal disease (ESRD) worldwide [1]. While the classical pathway involves progression from albuminuria to a decline in the glomerular filtration rate (GFR), a non-albuminuria phenotype, characterized by GFR loss without preceding overt proteinuria, is increasingly recognized, particularly in the Japanese populations [2,3,4]. Diabetic retinopathy (DR) is the leading cause of blindness in the working-age population, with a global prevalence of 22.27% among individuals with diabetes [5,6]. As symptoms often manifest only in advanced stages, early risk assessment is crucial for preserving vision and quality of life [7].
Obesity with T2D has been continuously increasing in Japan [8,9] and worldwide [10]. Obesity is a key pathophysiological driver of diabetes and a modifiable risk factor for both DKD and DR [11,12,13,14]. The recent understanding of this relationship refers to it as cardiovascular–kidney–metabolic syndrome, which describes the complex, multisystem interactions among dysfunctional adiposity, metabolic risk factors, CKD, and cardiovascular disease. Under this progressive disease framework, excess adiposity triggers systemic low-grade chronic inflammation, oxidative stress, and severe insulin resistance [15], which can propagate vascular endothelial damage and accelerate both glomerular and retinal injury. Increasing BMI trajectory after the diagnosis of T2D is strongly associated with an increased risk of microvascular complications [16]. However, most studies evaluating this link rely on body mass index (BMI) measured at a single time point, such as at the diagnosis or study enrollment. There is a risk of overlooking the patient’s condition, particularly when assessing patients at their initial diabetes presentation. This is because patients with type 2 diabetes (T2D) frequently experience significant weight loss prior to the clinical diagnosis due to hyperglycemic catabolism (glucosuria) and metabolic dysregulation [17,18,19]. Consequently, when used alone, a present BMI assessment may underestimate the historical exposure to adiposity and the hypothesized cumulative “metabolic memory” associated with past obesity. As an example of this proposed legacy effect, high adiposity over adulthood is associated with evidence of adverse cardiac structure and function. Some of these associations are independent of adiposity in later life [20].
This limitation underscores the need to investigate longitudinal weight trajectories, and a typical example of a representative value is the maximum weight in one’s lifetime. A previous Japanese cohort study suggested that a lifetime maximum BMI of ≥25 kg/m2 is a significant risk factor for microvascular complications [21]. However, that study dichotomized past obesity at a single cutoff of 25 kg/m2, leaving the incremental impact of obesity severity unexamined. While a simple binary cutoff of 25 kg/m2 is clinically convenient, it groups patients with mild obesity together with those with severe obesity. According to the Japan Society for the Study of Obesity (JASSO) guidelines [22], obesity is structured into distinct classes because advanced obesity severity (Classes II and III) is incrementally associated with an exponentially heightened burden of metabolic and renal disease [23]. Therefore, evaluating past obesity using a detailed stratified approach is necessary to determine the clinical rationale for severity-dependent risk. Therefore, this study aimed to determine the association between lifetime maximum BMI and BMI at the first clinical visit, stratified in detail by severity, with the long-term risk of developing diabetic nephropathy and retinopathy.

2. Materials and Methods

2.1. Study Design and Population

This retrospective cohort study utilized the electronic medical records of patients with diabetes who first presented to the Institute for Medical Science, Asahi Life Foundation, between January 2005 and December 2022. The study protocol was approved by the Ethics Committee of Meiji Pharmaceutical University, Tokyo, Japan (approval number: 202441) and complied with the principles of the Helsinki Declaration. We included patients diagnosed with T2D. Patients were excluded if they had other types of diabetes, had missing data for height or maximum lifetime weight, or if their baseline laboratory or ophthalmologic examinations were not performed within a specified timeframe (90 days for blood/urine tests and 365 days for fundus examination). Further exclusion criteria included fewer than three proteinuria measurements or two fundus examinations during follow-up, severe urinary protein (4+) or proliferative diabetic retinopathy (PDR) at baseline, and a documented history of non-diabetic renal or ocular diseases that could confound the outcomes (Table A1).

2.2. BMI Classification

Lifetime maximum weight was defined as the highest value among the self-reported weight at age 20 years, self-reported lifetime maximum weight, and measured weight at the first clinical visit. Lifetime maximum BMI and first-visit BMI were calculated and categorized according to the Japan Society for the Study of Obesity criteria [22]:
Group I (Underweight): BMI < 18.5, Group II (Normal weight): BMI 18.5 to <25, Group III (Class I obesity): BMI 25 to <30, Group IV (Class II obesity): BMI 30 to <35, Group V (Severe obesity): BMI ≥ 35.
For the sub-analysis of pre-visit weight changes, within each first-visit BMI group, the historical BMI trajectory from the lifetime maximum to the first clinical visit was classified into two categories: “decrease,” defined as a reduction in one or more BMI categories, and “no change,” defined as remaining in the same BMI category.

2.3. Outcomes and Covariates

The three primary endpoints were as follows: a proteinuria event was defined as an increase of at least one grade in dipstick urinalysis (e.g., negative to trace, or 1+ to 2+), confirmed on two consecutive visits; an eGFR event was defined as a sustained decline of at least 40% in the estimated GFR (eGFR) from the baseline measurement; a retinopathy event was defined as progression of at least one stage in the modified Davis classification.
Baseline covariates included age, sex, duration of diabetes, HbA1c level, smoking and alcohol history, family history of diabetes, and use of antidiabetic and antihypertensive medications. The duration of diabetes was calculated using the date of diabetes based on the first documented diagnostic glucose value or physician’s note in the medical record. HbA1c values, if initially measured using the Japan Diabetes Society (JDS) scale, were converted to the National Glycohemoglobin Standardization Program (NGSP) equivalent values using the following established formula [24]:
HbA1c (NGSP) = 1.02 × HbA1c (JDS) + 0.25
eGFR was calculated using the formula recommended for Japanese populations [25]:
eGFR (mL/min/1.73 m2) = 194 × Scr−1.094 × Age−0.287 (×0.739 if female)

2.4. Statistical Analysis

Baseline characteristics were compared across the BMI groups using ANOVA or the chi-squared test, as appropriate. Event-free survival was analyzed using the Kaplan–Meier method with the log-rank test. Hazard ratios (HRs) and 95% confidence intervals (CIs) were estimated using univariate and multivariate Cox proportional hazards models. The multivariable model (Model 2) was adjusted for age, sex, duration of diabetes, baseline HbA1c level, baseline proteinuria, baseline eGFR, baseline retinopathy stage, family history of diabetes, and use of antidiabetic and antihypertensive medications. All analyses were performed using JMP® Student Edition Ver. 19 (SAS Institute Inc., Cary, NC, USA). Two-sided p-values < 0.05 were considered to indicate statistical significance.

3. Results

3.1. Patient Characteristics

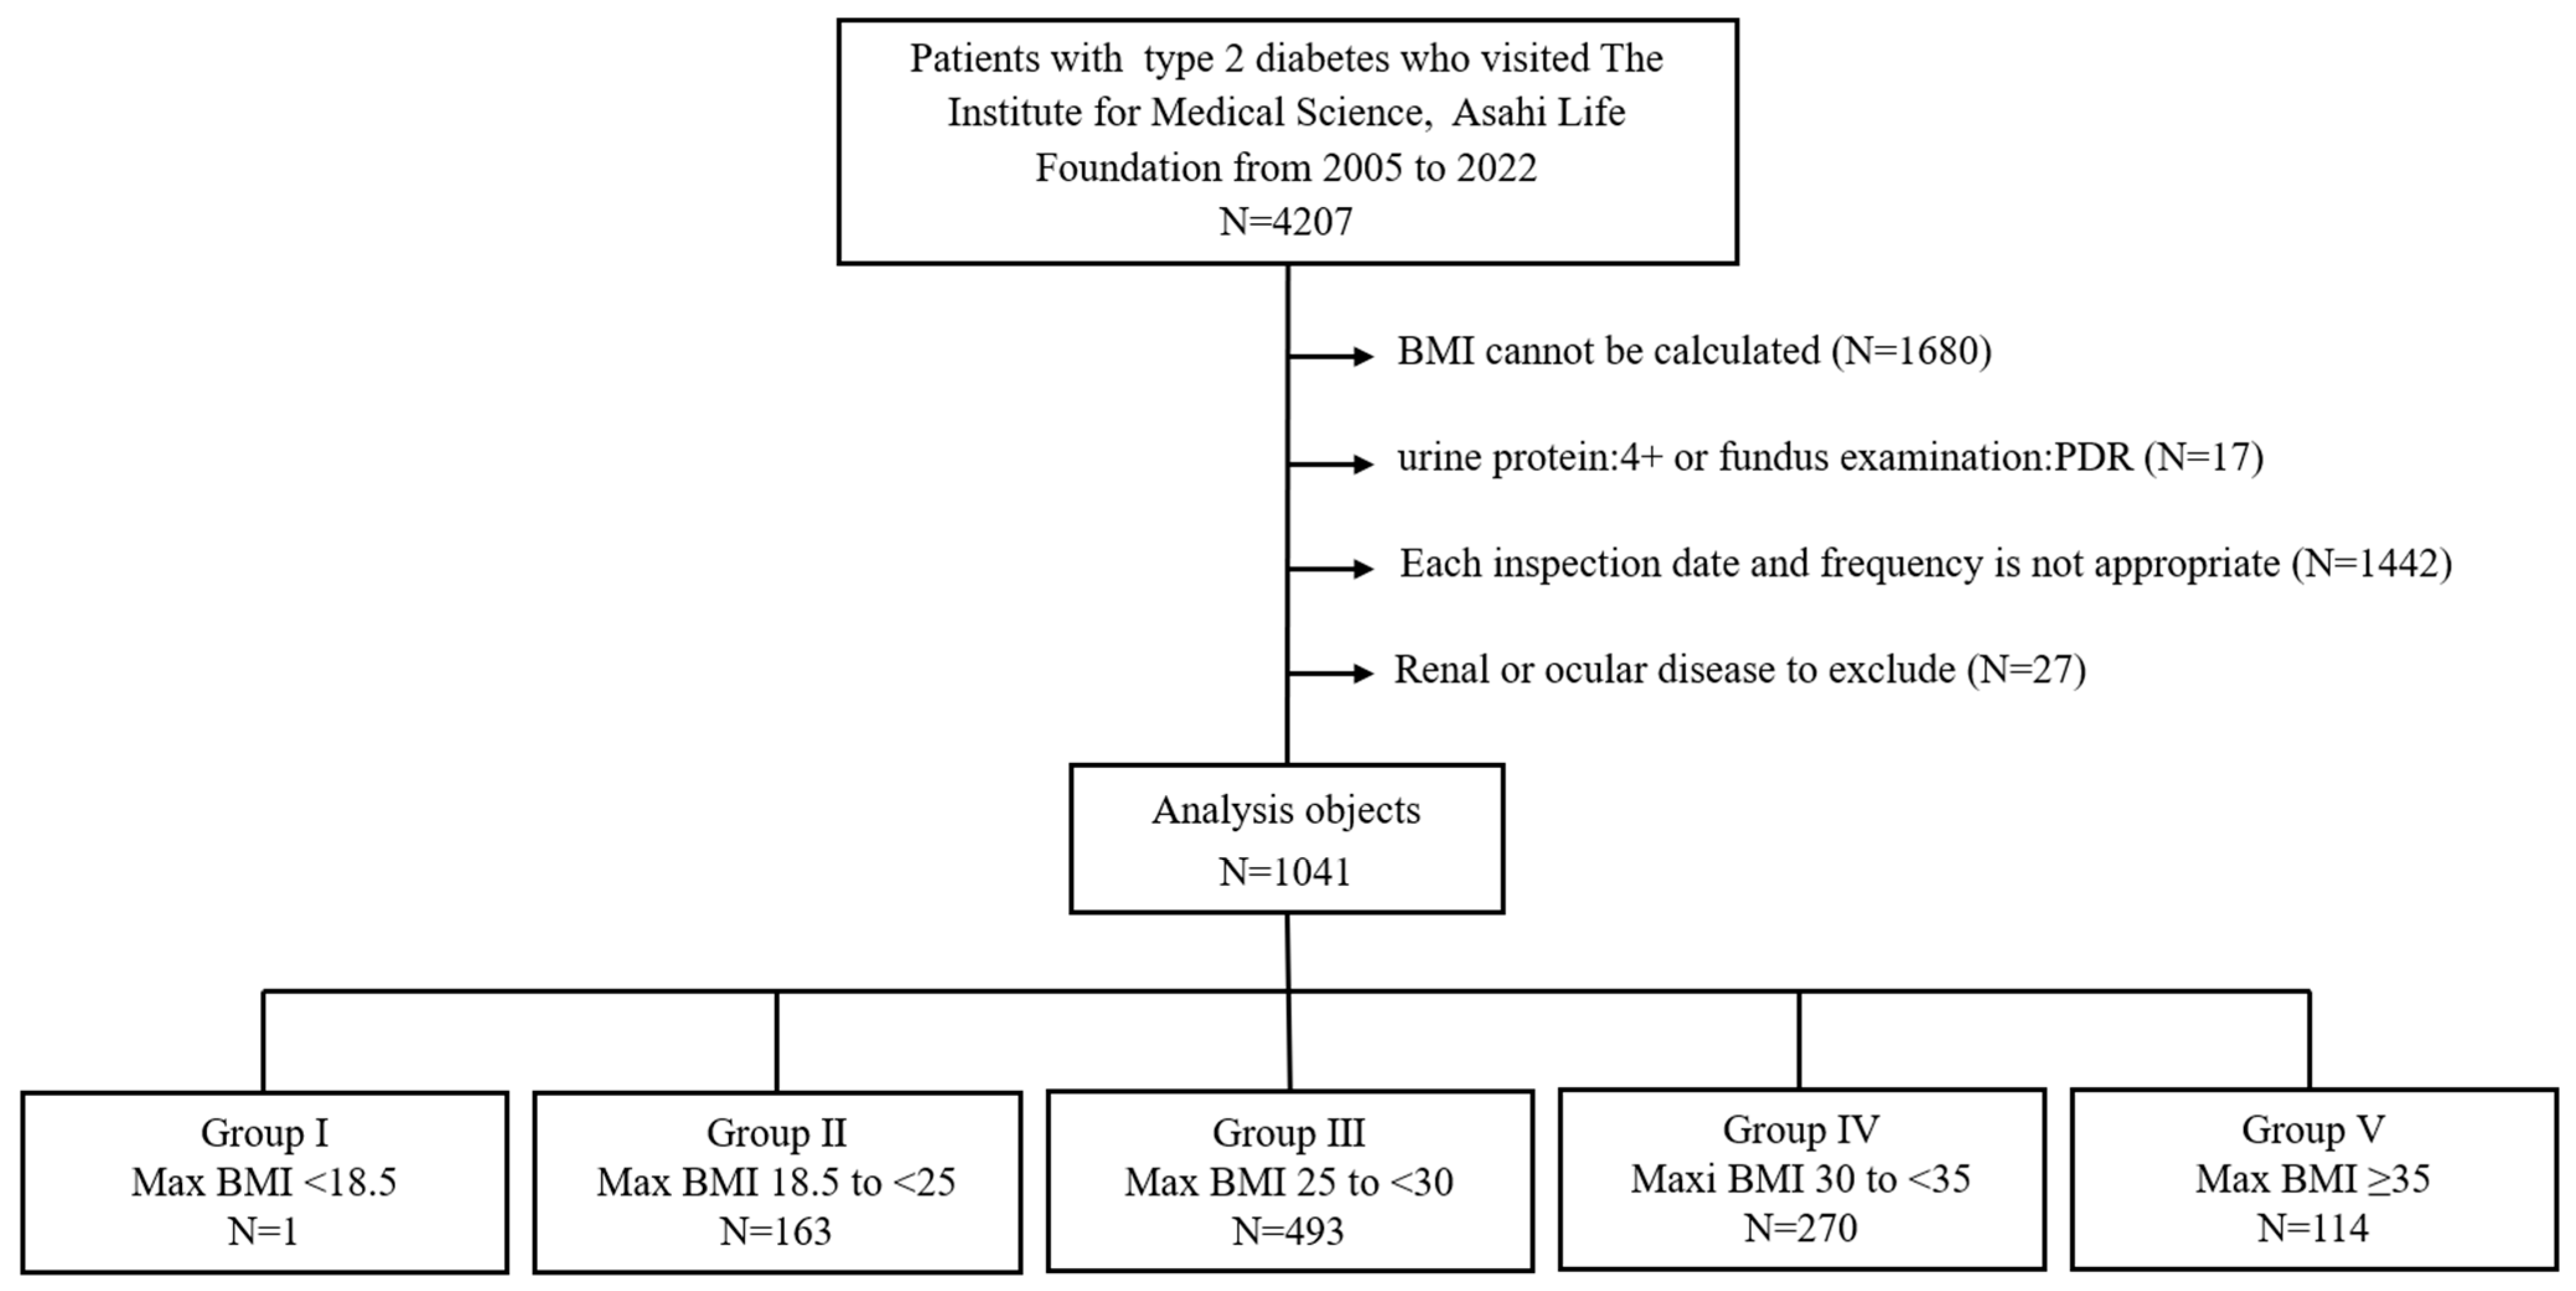
From an initial cohort of 4207 patients, 1041 (832 men; mean age 54.9 ± 10.5 years) were included in the final analysis (Figure 1). Based on the lifetime maximum BMI, the cohort was distributed as follows: Group I (underweight, N = 1), Group II (normal, 15.7%), Group III (class I obesity, 47.4%), Group IV (class II obesity, 25.9%), and Group V (severe obesity, 11.0%).
The study analyzed 1041 participants divided into five groups based on their maximum BMI according to the Japanese criteria for obesity.
The baseline characteristics are presented in Table 1. Patients with a higher lifetime maximum BMI tended to be younger at their first visit, have higher HbA1c levels, greater weight gain since the age of 20 years, and a higher prevalence of a first-degree family history of diabetes. They were also more likely to be prescribed antidiabetic (e.g., biguanides and GLP-1 agonists) and antihypertensive (e.g., RAS inhibitors) medications.

3.2. Incidence of Microvascular Events

The overall incidence rates of proteinuria, eGFR decline, and retinopathy events were 55.2, 20.9, and 40.7 per 1000 person-years, respectively. The incidence of all three events increased in a dose-dependent manner with higher lifetime maximum BMI category.

3.3. Association of BMI with Clinical Endpoints

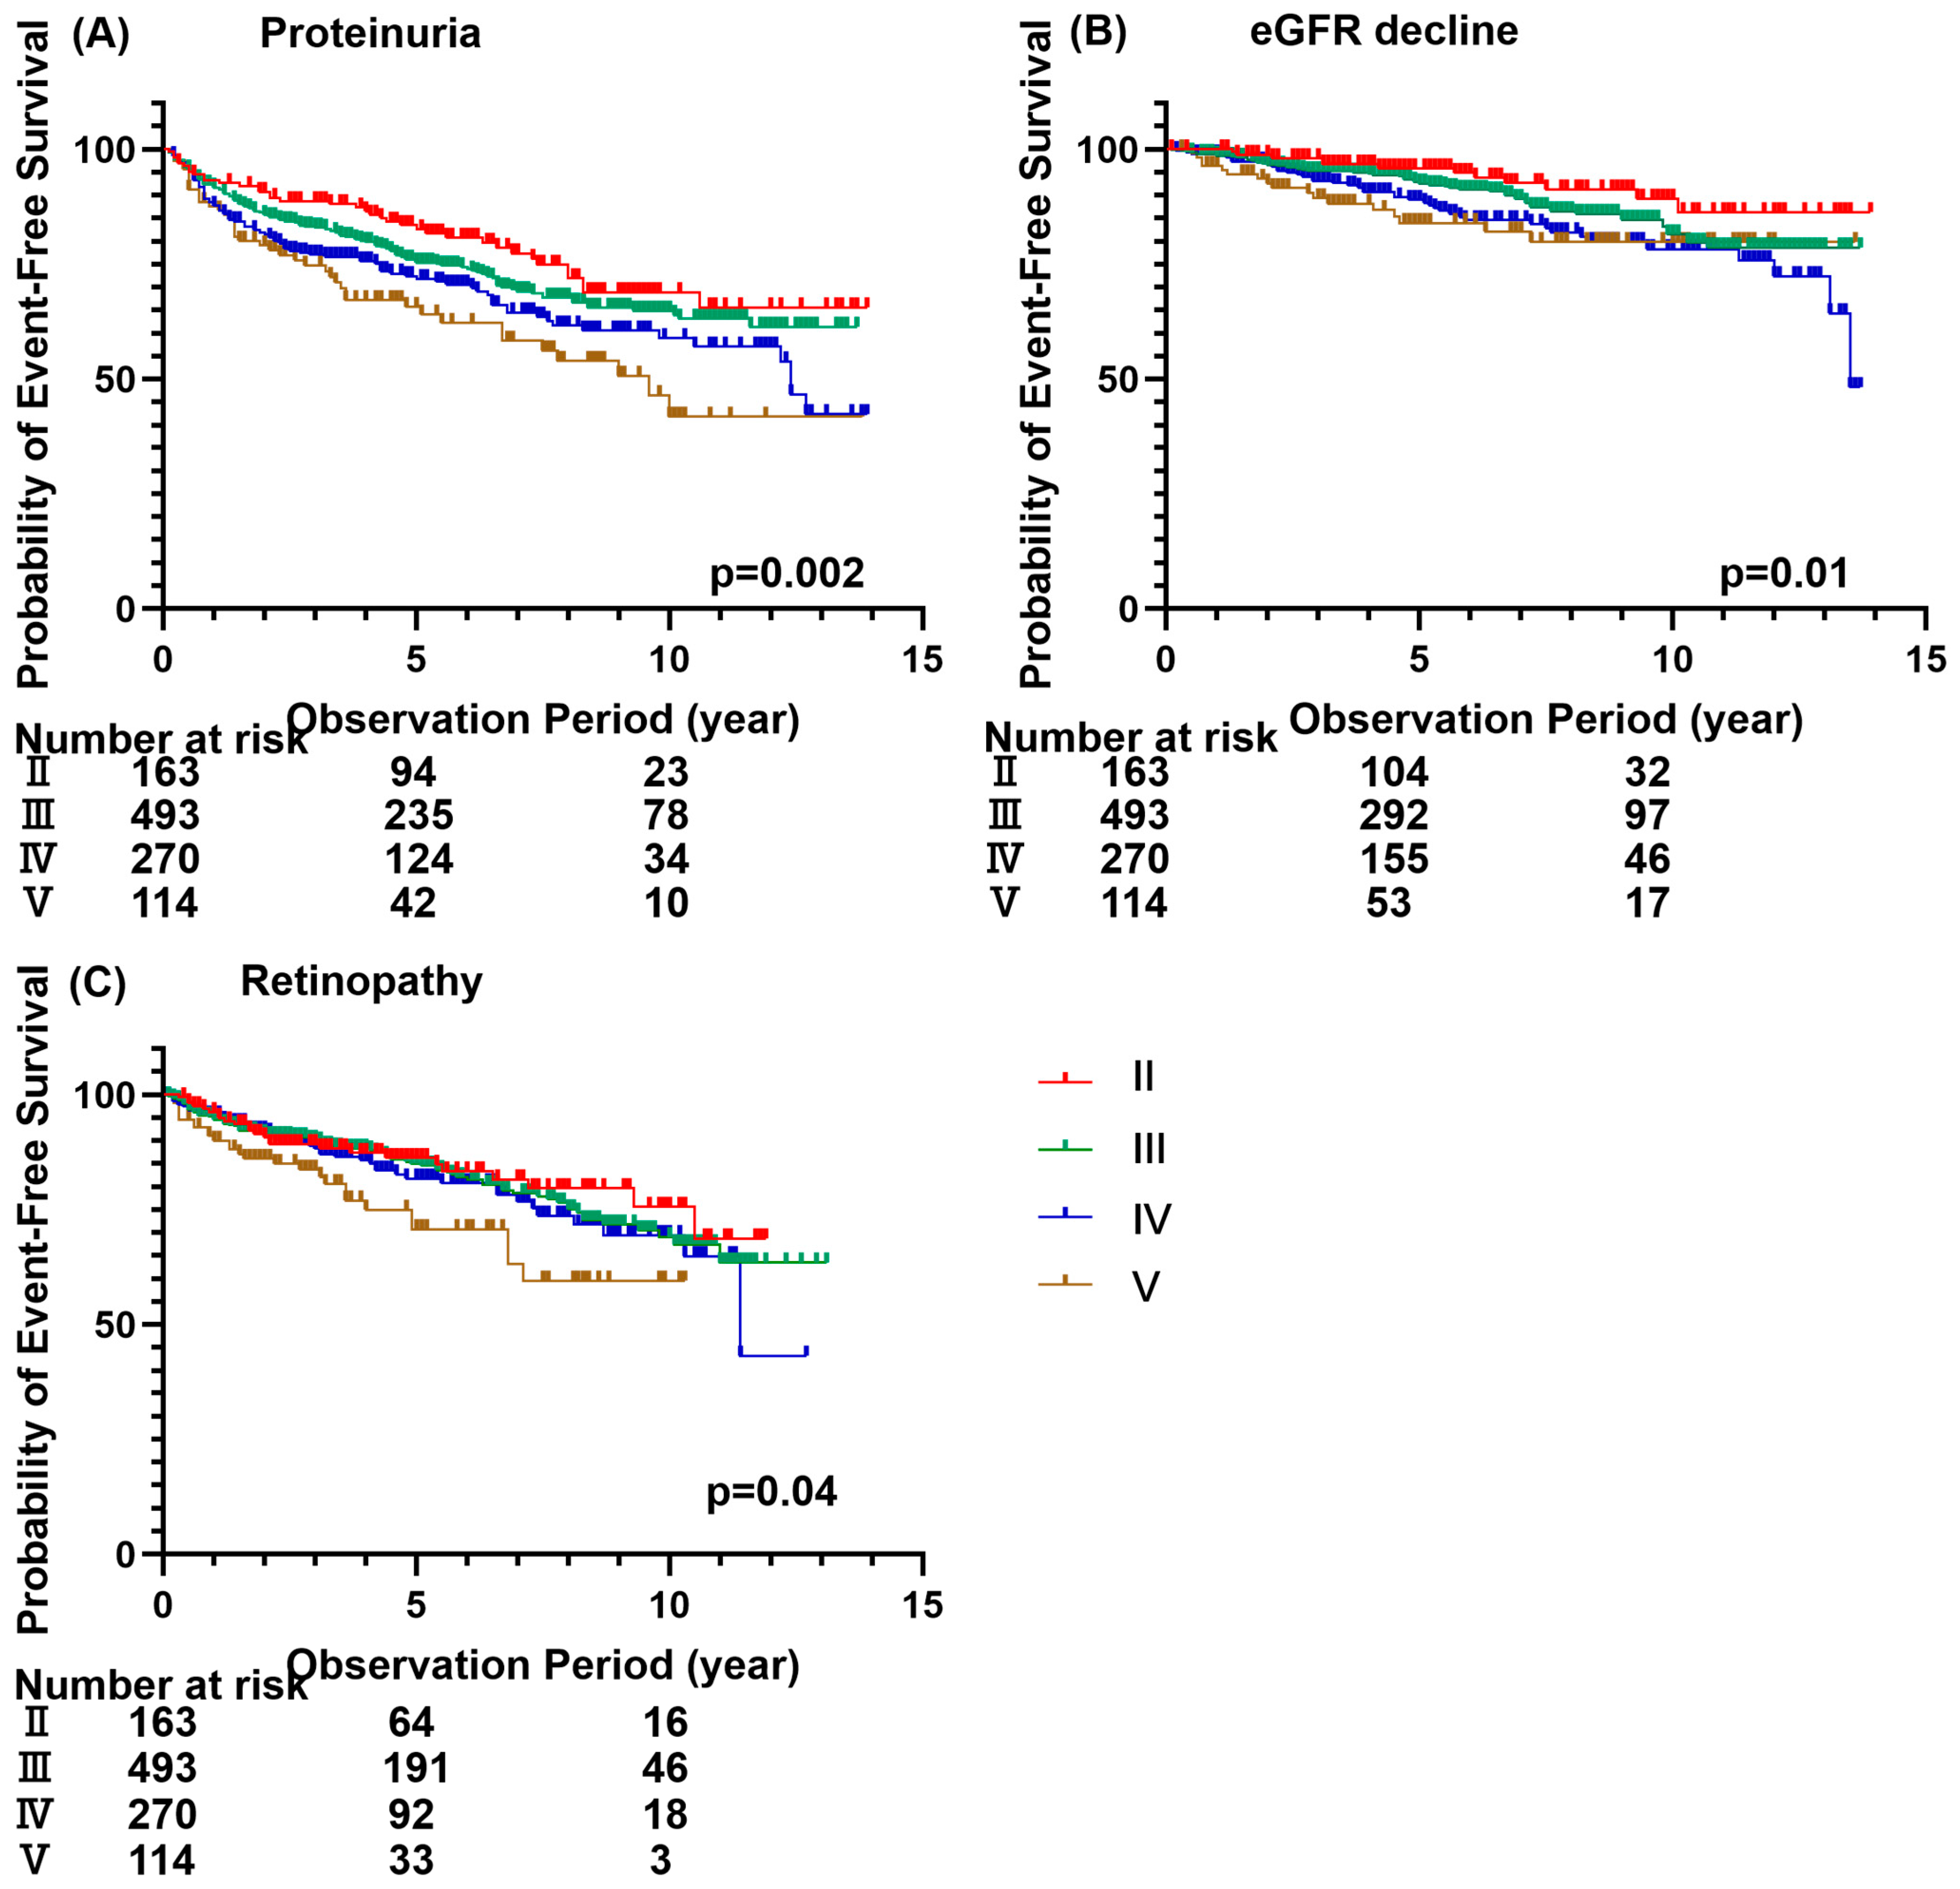
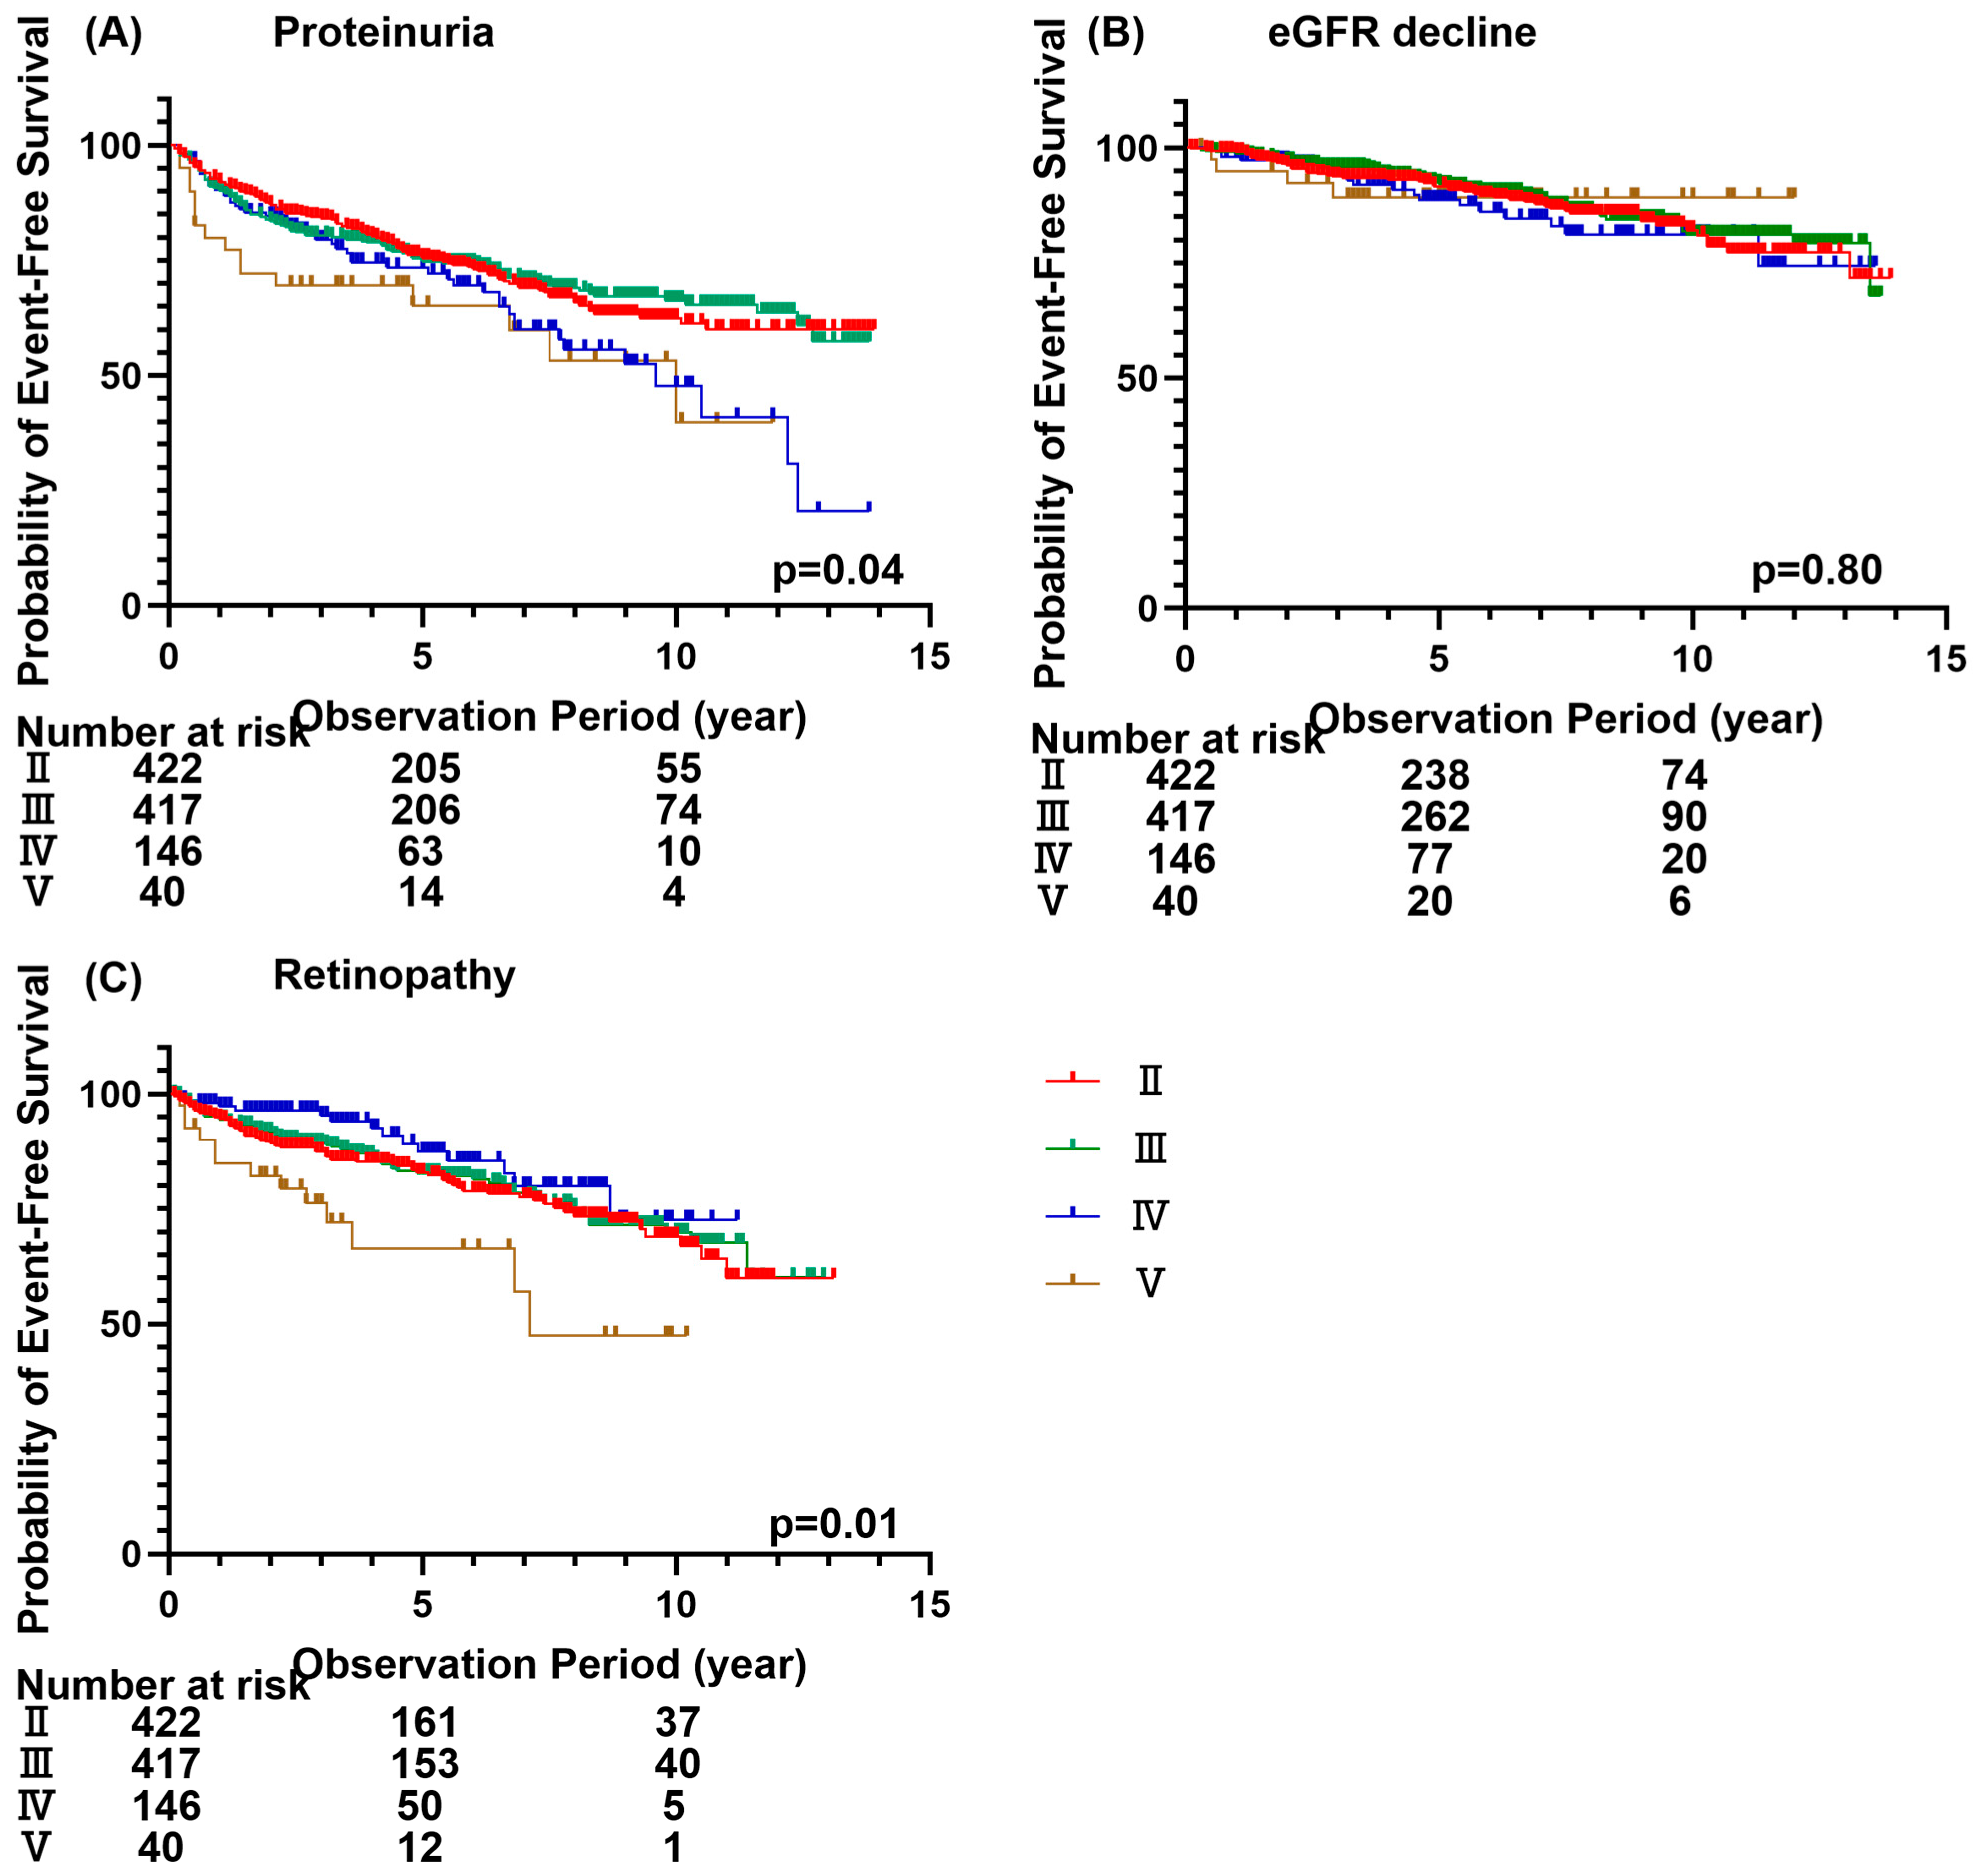
Owing to the limited sample size, Group I (lifetime maximum BMI < 18.5 kg/m2, N = 1) was excluded from both the Kaplan–Meier and proportional hazards regression analyses. In addition, individuals with a BMI at the first visit of <18.5 kg/m2 (N = 16) were omitted from the Kaplan–Meier curve analysis. The Kaplan–Meier analysis demonstrated that a higher lifetime maximum BMI was associated with a significantly increased risk of all three endpoints (Figure 2A–C).
Notably, the severe obesity group (Group V) had a significantly worse prognosis for retinopathy progression than all other groups (log-rank p = 0.04). When analyzed by BMI at the first visit, a higher BMI was associated with an increased risk of proteinuria and retinopathy events but not with the eGFR lowering events (Figure 3A–C).

3.4. Cox Proportional Hazards Analysis

In the unadjusted Cox analysis (Model 1), the lifetime maximum BMI in the class II and severe obesity groups was associated with a significantly higher risk of both proteinuria and eGFR events than that in the normal weight group. Only the severe obesity group had a significantly elevated risk of retinopathy (Table 2).
After multivariable adjustment (Model 2), the association between lifetime maximum BMI and proteinuria events remained strong and significant for Group IV (HR 1.77, 95% CI 1.19–2.62) and Group V (HR 1.98, 95% CI 1.24–3.17). However, the associations between lifetime maximum BMI and eGFR and retinopathy events were no longer statistically significant after adjusting for clinical covariates.

3.5. Stratified Analyses

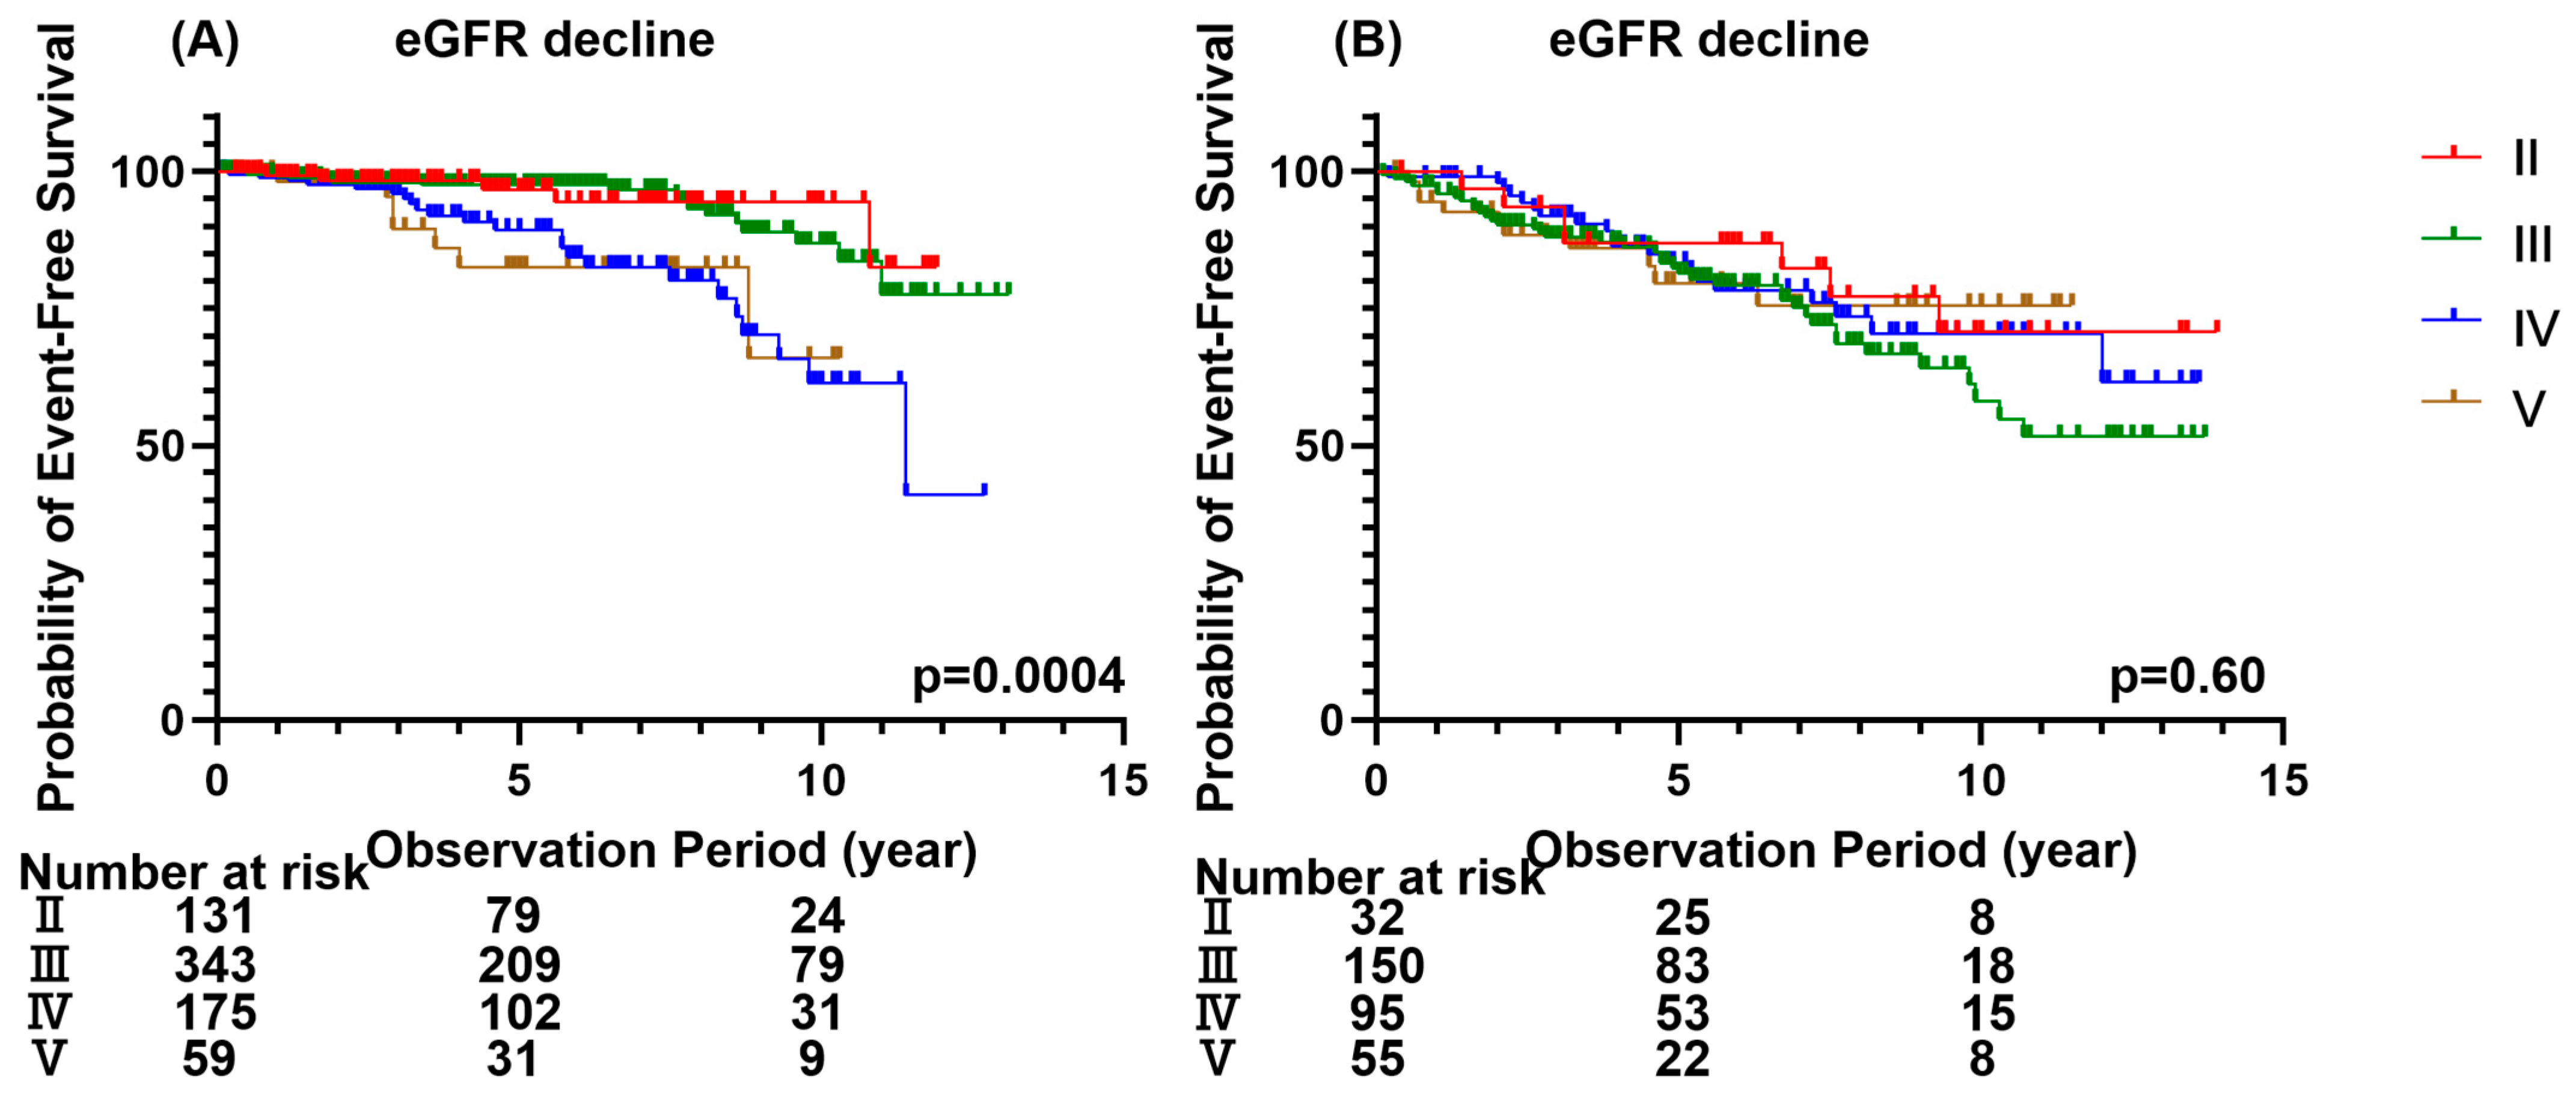
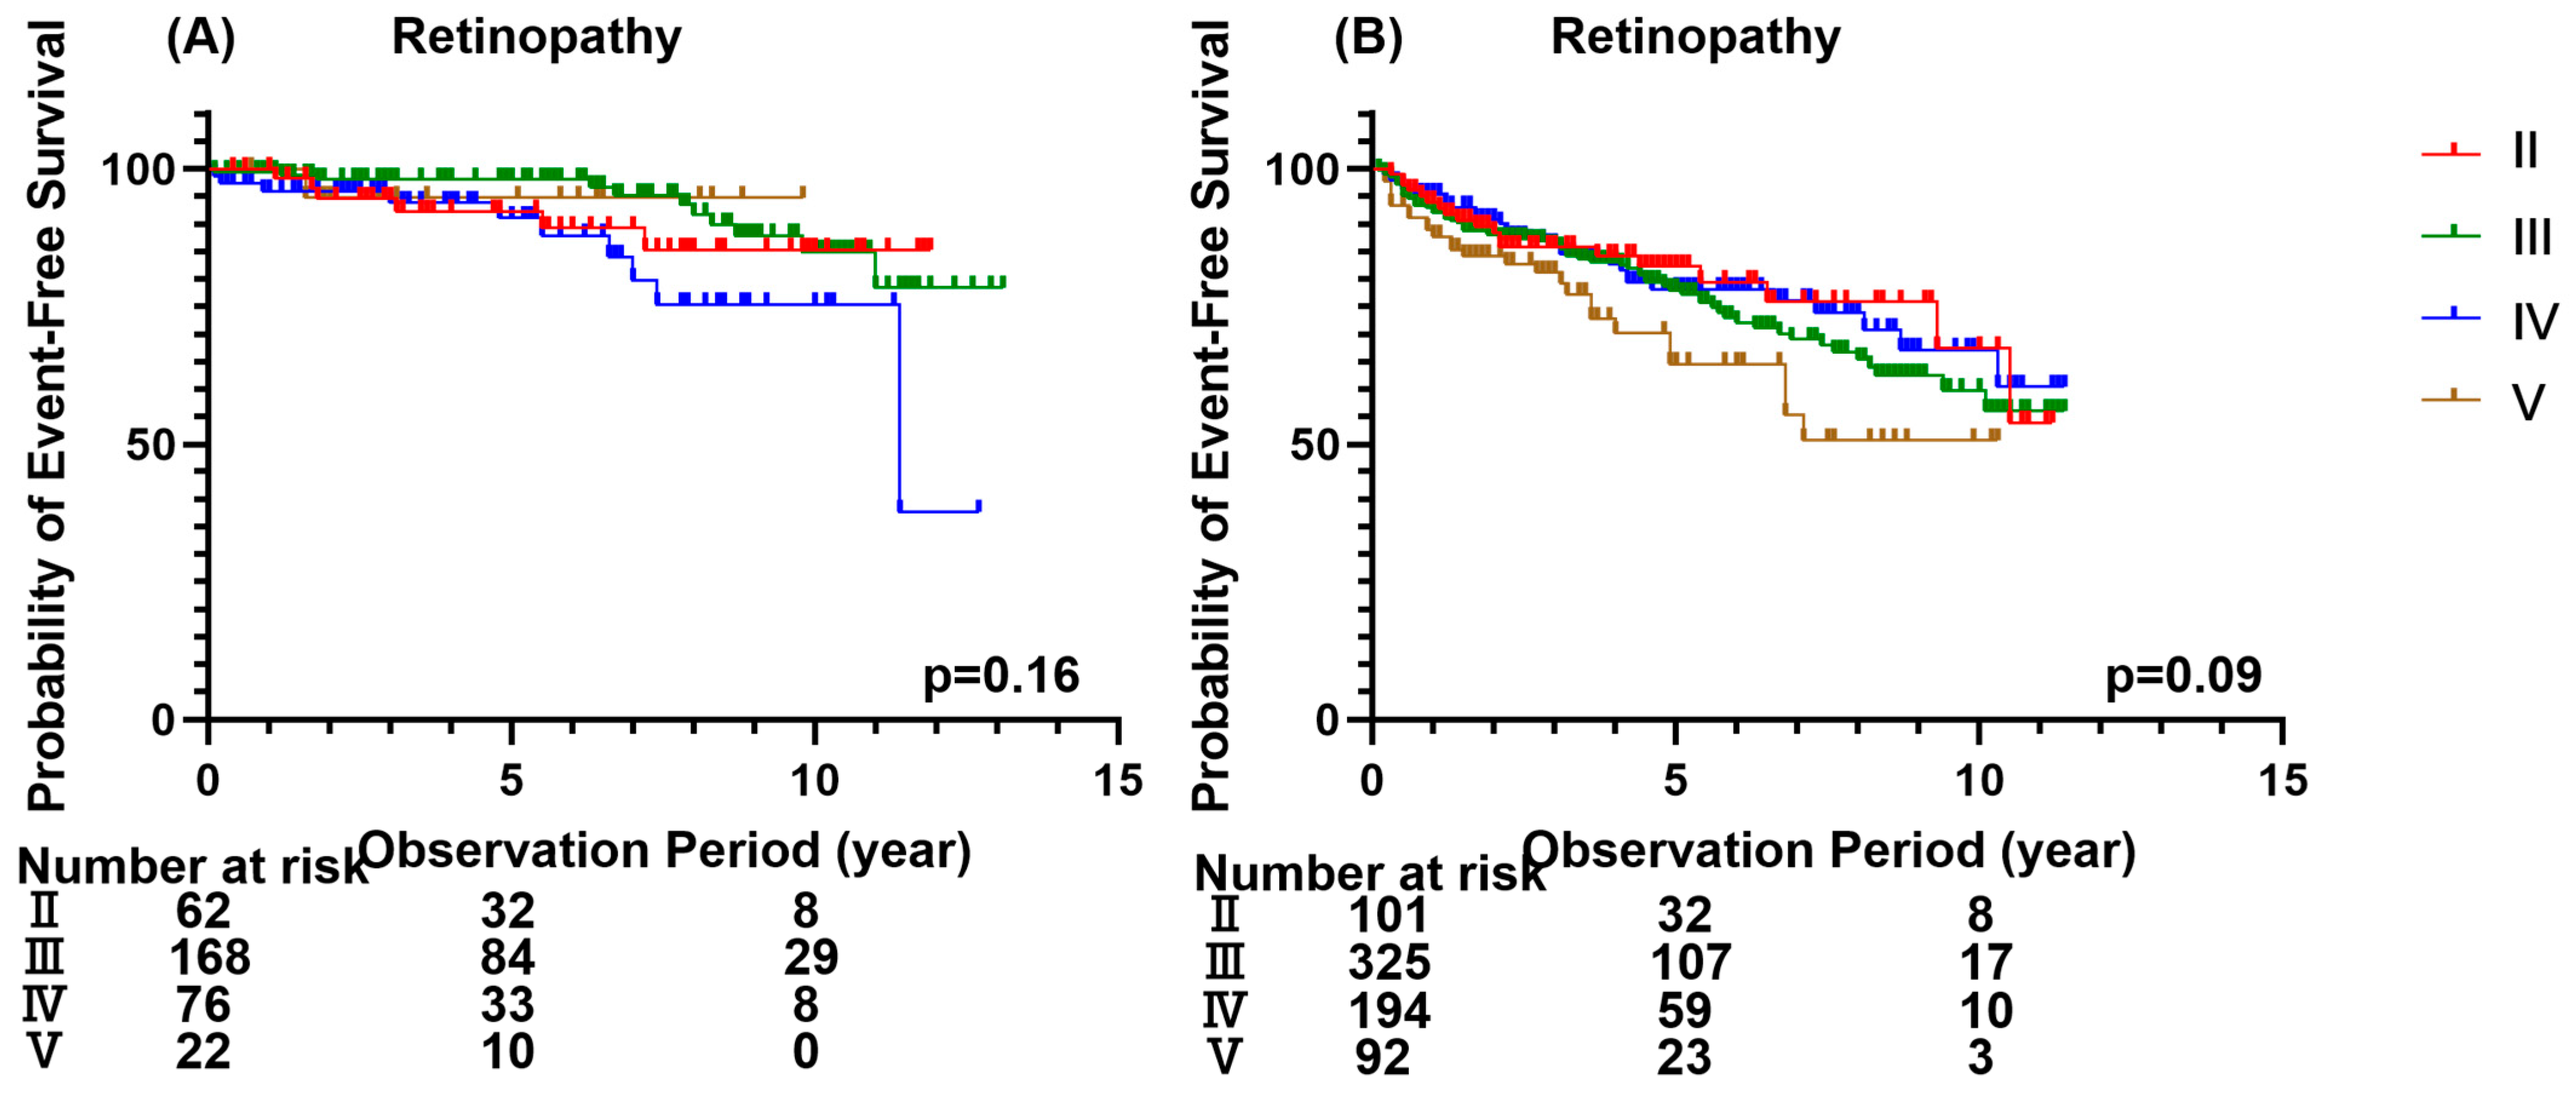
The stratified analysis of eGFR lowering events showed that among patients not taking antihypertensive medications, a history of severe obesity (Groups IV and V) was associated with a higher event risk. In contrast, among patients taking antihypertensives, the risk was similarly elevated across all groups, masking the effect of obesity (Figure 4). For retinopathy, the increased risk associated with past severe obesity (Group V) was evident only in patients receiving antidiabetic medication (Figure 5).

3.6. Analysis of the BMI Trajectory Before the First Visit

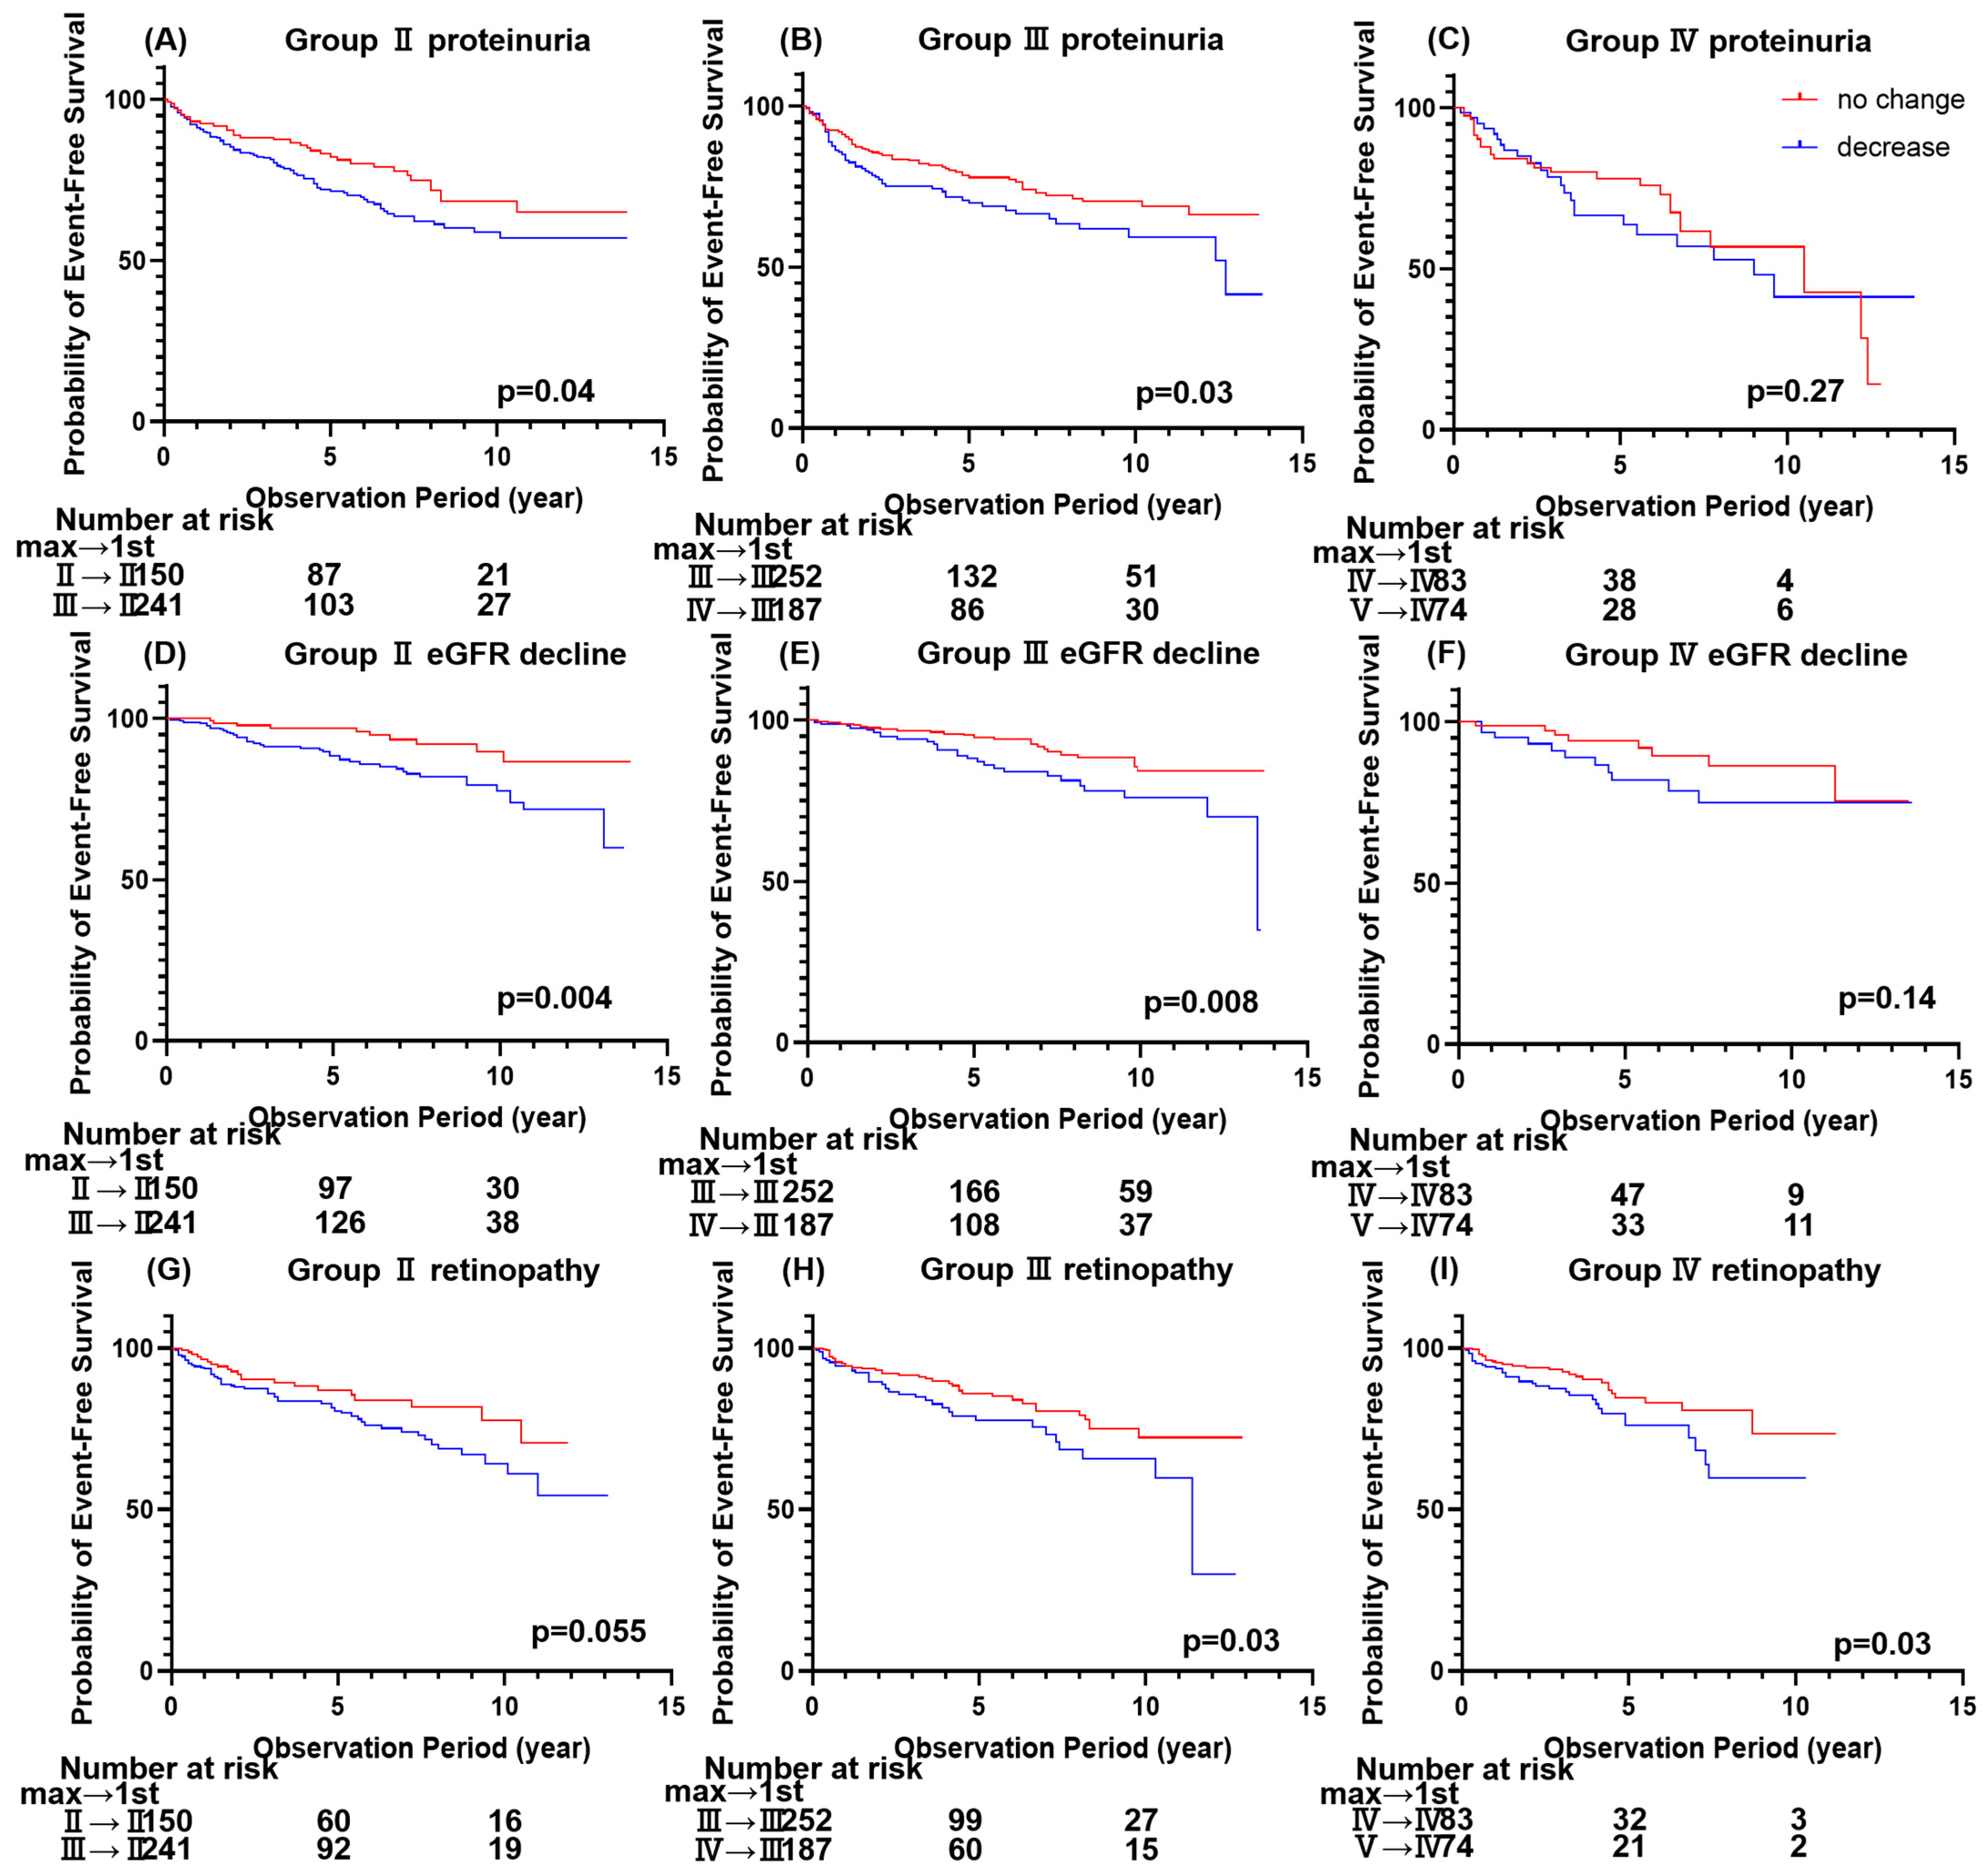
As demonstrated in Figure 6A–I, a sub-analysis stratified by historical BMI trajectory prior to the first clinical visit revealed a counterintuitive yet pathophysiologically profound trend. Across most baseline BMI categories, patients who experienced a pre-visit weight “decrease” (blue lines) exhibited significantly a higher incidence of microvascular complications compared to those whose weight remained “no change” (red lines).

4. Discussion

This retrospective cohort study demonstrated that a history of severe obesity, represented by the lifetime maximum BMI, is a robust predictor of proteinuria progression in Japanese patients with T2D. The association of maximum BMI was an independent predictor of proteinuria progression. Although past obesity was also correlated with eGFR decline and retinopathy, these associations were attenuated after multivariate adjustment. Crucially, our utilization of the five-tiered JASSO classification [22] revealed severity-dependent pathological dynamics, thereby demonstrating a clinical advancement over the previous benchmark Japanese cohort study [21].
Importantly, BMI at the first clinical visit was primarily associated with retinopathy, suggesting differential contributions of past and current obesity to renal versus retinal damage. This negative legacy effect suggests that the peak metabolic and physical stress of historical obesity leaves a durable pathological imprint on the microvasculature, which persists even after substantial weight loss. This is further supported by evidence that adiponectin levels remain chronically suppressed in individuals with a history of obesity, even after they return to a normal weight [26], indicating a persistent alteration in adipose tissue function and systemic metabolism. Our sub-analysis stratified by historical BMI trajectory further corroborates this phenomenon. It is important to note that weight loss prior to the first visit may reflect distinct phenomena: voluntary lifestyle improvements or weight loss secondary to uncontrolled diabetes (hyperglycemic catabolism). The ‘decrease’ group in our study exhibited a higher incidence of complications, this trajectory most likely represents historical exposure to severe, untreated hyperglycemia and metabolic dysregulation prior to clinical presentation, rather than protective weight loss.
The independent association between past obesity and proteinuria suggests that obesity induces irreversible structural kidney damage. The pathophysiological mechanism underpinning the strong association between past severe obesity and progressive proteinuria is possibly rooted in obesity-related glomerulopathy (ORG) [27]. Characterized by glomerular hypertrophy and focal segmental glomerulosclerosis (FSGS), ORG often causes treatment-refractory proteinuria [28,29]. Once podocyte loss exceeds a critical threshold, irreversible glomerular scarring and treatment-refractory proteinuria ensue, explaining why historical peak adiposity exerts a lasting deleterious effect on renal function. If pre-diabetic obesity incites ORG, vigilant renal monitoring and early intervention in obese individuals become imperative.
Interestingly, the association between lifetime maximum obesity and eGFR decline varied depending on the use of antihypertensive medication. In patients not receiving antihypertensive therapy, the deleterious effect of past severe obesity on GFR was clearly pronounced. In contrast, among patients taking antihypertensives, the event risk tended uniformly elevated across all BMI categories, including normal weight and Class I obesity. This suggests the presence of confounding by indication; patients with advanced underlying hypertensive stress or baseline renal vulnerability, regardless of their weight history, were appropriately channeled into receiving antihypertensive therapy, thereby elevating the risk of the entire treated sub-cohort. Interestingly, the severe obesity groups did not exhibit further renal deterioration. This lack of incremental risk in the severe obesity under treatment could point to a ceiling effect. Alternatively, the potential for a genuine renoprotective therapeutic effect remains; since renin-angiotensin system (RAS) blockers were highly prescribed in this cohort, these agents may have actively counteracted the intrarenal RAS pathway that drives obesity-induced glomerular hyperfiltration and subsequent renal injury [29,30].
The pathophysiology linking obesity to retinopathy appears to be distinct from its association with DKD. Both lifetime maximum and current BMI correlated with retinopathy, suggesting either a significant contribution of ongoing metabolic stress from obesity or the potential for risk mitigation through the resolution of obesity. The severely obese group was the most at risk for retinopathy, a finding potentially revealed for the first time in this analysis, given their previously lower prevalence in Japanese type 2 diabetes populations [8]. Obesity was identified as a risk factor for retinopathy only when severe obesity was included in the analysis. An earlier analysis [21], which dichotomized at a BMI of 25 kg/m2, likely overlooked this risk, partly because obesity has historically been less prevalent in Japan [8]; thus severe obesity may have been insufficiently risk evaluated in Japanese patients with type 2 diabetes. Severe obesity is strongly associated with conditions that cause intermittent hypoxia, such as obstructive sleep apnea, a known accelerator of retinal neovascularization. However, the direct causal relationship between OSA parameters and DR remains highly debated in the recent clinical literature [31,32,33,34,35]. Our finding that the retinopathy risk was most evident in patients already on antidiabetic medication suggests a “two-hit” mechanism: a history of sustained hyperglycemia initiates microvascular damage [36], which is then exacerbated by obesity-related factors such as hypoxia. Since diabetic retinopathy does not develop in the absence of diabetes, obesity-related factors likely play a promoting rather than an initiating role.
From a practical perspective, inquiring about a patient’s historical peak weight during routine clinical evaluations represents a simple, noninvasive, and cost-effective screening tool for risk stratification. Identifying patients with a history of severe obesity can serve as a vital trigger for closer clinical monitoring. While our study did not directly evaluate specific pharmacological interventions, modern guidelines, including the KDIGO and ADA Standards of Care, recommend considering next-generation cardiometabolic therapies such as SGLT2 inhibitors and GLP-1 receptor agonists for patients with T2D at high risk of renal and vascular complications [37,38].

Limitations

This study has several limitations. First, the lifetime maximum weight was self-reported, introducing potential recall bias. Second, out of 4207 initial patients, a significant portion was excluded due to missing historical weight data or insufficient follow-up intervals, which introduces a potential selection bias. For example, the final analyzed cohort may represent individuals with high health literacy or clinical adherence to remember the lifetime maximum body weight, which could limit the generalizability of our findings to the broader diabetic population. Third, the data were obtained from a single specialized center in Japan, which may limit the generalizability to other ethnicities or healthcare systems. Fourth, the proteinuria endpoint was semi-quantitative (dipstick test). Finally, although the exclusion of non-diabetic nephropathy was based on the clinical diagnosis, differentiating the coexistence of other nephropathies was challenging because renal biopsy was rarely performed. Furthermore, since no patients had been formally diagnosed with obesity-related nephropathy, such patients could not be excluded.

5. Conclusions

A history of severe obesity is a significant independent risk factor for the long-term development of proteinuria in patients with T2D, representing a durable legacy effect that persists even after weight loss. In clinical practice, physicians should look beyond a patient’s current BMI and inquire about their maximum lifetime weight. This simple, noninvasive metric can serve as a powerful tool for risk stratification, enabling earlier and more targeted interventions to prevent diabetic microvascular complications.

Author Contributions

Conceptualization, A.K. and T.K.; methodology, A.K., K.H. and T.K.; software, A.K. and H.O.; validation, M.K. and I.Y.; formal analysis, H.O., K.H., A.K. and T.K.; investigation, H.O. and A.K.; resources, A.K. and T.K.; data curation, H.O., K.H., M.K. and I.Y.; writing—original draft preparation, H.O. and A.K.; writing—review and editing, A.K. and T.K.; visualization, A.K.; supervision, A.K.; project administration, A.K. and T.K.; funding acquisition, A.K. All authors have read and agreed to the published version of the manuscript.

Funding

This research received no external funding.

Institutional Review Board Statement

This study was conducted in accordance with the Declaration of Helsinki and was approved by the Ethics Committee of the Institute for Medical Science, Asahi Life Foundation, and the Ethics Committee of Meiji Pharmaceutical University (Approval No (date): 14010 (26 July 2022) and 202441 (1 November 2024)).

Informed Consent Statement

Patient consent was waived due to the retrospective study design, and an opt-out consent procedure was adopted.

Data Availability Statement

The data supporting the findings of this study are available from the corresponding author upon reasonable request and subject to prior approval from the data-contributing institution.

Acknowledgments

The generative AI tool, Gemini 1.5 Pro (Large Language Model, developed by Google LLC, Mountain View, CA, USA) was used to assist with the English translation of the drafted Japanese text, refine the phrasing of academic and clinical arguments for clarity, and scan the complete manuscript to identify and correct typographical and minor grammatical errors. Reason for use: It was utilized exclusively to enhance the overall linguistic quality and stylistic fluency of the English text, ensuring that the manuscript meets the rigorous standards required for publication in international biomedical journals. Note: All AI-generated suggestions were critically reviewed, edited, and verified by the authors, who maintain full accountability for the accuracy and integrity of the final content.

Conflicts of Interest

The authors declare no conflicts of interest.

Abbreviations

The following abbreviations are used in this manuscript:
ADAAmerican Diabetes Association
ANOVAAnalysis of Variance
ANCAAnti-Neutrophil Cytoplasmic Antibody
BGBiguanide
BMIBody Mass Index
CIConfidence Interval
CKDChronic Kidney Disease
DKDDiabetic Kidney Disease
DPP-4Dipeptidyl Peptidase-4
DRDiabetic Retinopathy
eGFREstimated Glomerular Filtration Rate
ESRDEnd-Stage Renal Disease
FSGSFocal Segmental Glomerulosclerosis
GFRGlomerular Filtration Rate
GLP-1Glucagon-Like Peptide-1
HbA1cHemoglobin A1c
HRHazard Ratio
JDSJapan Diabetes Society
KDIGOKidney Disease: Improving Global Outcomes
MultiMultivariate (Model)
NDRNo Diabetic Retinopathy
NGSPNational Glycohemoglobin Standardization Program
ORGObesity-Related Glomerulopathy
OSAObstructive Sleep Apnea
PDRProliferative Diabetic Retinopathy
PPDRPre-Proliferative Diabetic Retinopathy
RASRenin-Angiotensin System
ScrSerum Creatinine
SDRSimple Diabetic Retinopathy
SGLT2Sodium-Glucose Cotransporter 2
SUSulfonylurea
T2DType 2 Diabetes
UniUnivariate (Model)

Appendix A

Table A1. Renal and ocular diseases before the observation period for patient exclusion.
Renal DiseasesOcular Diseases
Chronic GlomerulonephritisEpiretinal Membrane
Acute GlomerulonephritisMacular Hole
IgA Nephropathy Preretinal Membrane
Rapidly Progressive GlomerulonephritisVitreous Hemorrhage
Nephrotic Syndrome Retinal Break/Retinal Tear
Chronic PyelonephritisRetinal Detachment
Acute PyelonephritisVitreous Hemorrhage
Crescentic GlomerulonephritisRetinal Vein Occlusion
ANCA-Associated VasculitisRetinal Artery Occlusion
Acute Renal FailureBranch Retinal Artery Occlusion
Kidney TumorBranch Retinal Vein Occlusion
Renal Cancer Pit Maculopathy
HydronephrosisBehçet’s Disease
Kidney TuberculosisPost-vitrectomy
Renal Cyst Post-iridectomy
Renal InfarctionPhotocoagulation
Polycystic Kidney Disease
Renal Transplantation
Post-renal Surgery

References

  1. Kidney Disease: Improving Global Outcomes Anemia Work Group; Tonelli, M.; Berns, J.S.; Bozkurt, B.; Cheung, R.S.; Cuevas, Y.; Effa, E.E.; Eisenga, M.F.; Fishbane, S.; Ginzburg, Y.Z.; et al. KDIGO 2026 Clinical Practice Guideline for the Management of Anemia in Chronic Kidney Disease (CKD). Kidney Int. 2026, 109, S1–S99. [Google Scholar] [CrossRef] [PubMed]
  2. Perkins, B.A.; Ficociello, L.H.; Ostrander, B.E.; Silva, K.H.; Weinberg, J.; Warram, J.H.; Krolewski, A.S. Microalbuminuria and the risk for early progressive renal function decline in type 1 diabetes. J. Am. Soc. Nephrol. 2007, 18, 1353–1361. [Google Scholar] [CrossRef] [PubMed]
  3. Yokoyama, H.; Sone, H.; Oishi, M.; Kawai, K.; Fukumoto, Y.; Kobayashi, M.; Japan Diabetes Clinical Data Management Study, G. Prevalence of albuminuria and renal insufficiency and associated clinical factors in type 2 diabetes: The Japan Diabetes Clinical Data Management study (JDDM15). Nephrol. Dial. Transplant. 2009, 24, 1212–1219. [Google Scholar] [CrossRef] [PubMed]
  4. Japanese Society of Nephrology. Evidence-Based Clinical Practice Guideline for CKD 2023; Tokyo Igakusha: Tokyo, Japan, 2023. [Google Scholar]
  5. Fung, T.H.; Patel, B.; Wilmot, E.G.; Amoaku, W.M. Diabetic retinopathy for the non-ophthalmologist. Clin. Med. 2022, 22, 112–116. [Google Scholar] [CrossRef] [PubMed]
  6. Teo, Z.L.; Tham, Y.C.; Yu, M.; Chee, M.L.; Rim, T.H.; Cheung, N.; Bikbov, M.M.; Wang, Y.X.; Tang, Y.; Lu, Y.; et al. Global Prevalence of Diabetic Retinopathy and Projection of Burden through 2045: Systematic Review and Meta-analysis. Ophthalmology 2021, 128, 1580–1591. [Google Scholar] [CrossRef] [PubMed]
  7. Japan Diabetes Society Guidelines Committee. Clinical Practice Guidelines for Diabetic Retinopathy (1st Edition). Nippon. Ganka Gakkai Zasshi 2020, 124, 955–981. [Google Scholar]
  8. Kushiyama, A.; Yoshida, Y.; Kikuchi, T.; Suzawa, N.; Yamamoto, M.; Tanaka, K.; Okayasu, M.; Tahara, T.; Takao, T.; Onishi, Y.; et al. Twenty-year trend of increasing obesity in young patients with poorly controlled type 2 diabetes at first diagnosis in urban Japan. J. Diabetes Investig. 2013, 4, 540–545. [Google Scholar] [CrossRef] [PubMed][Green Version]
  9. Wakasugi, M.; Goto, S. An increasing trend of overweight and obesity in the Japanese incident end-stage kidney disease population. Nephrology 2024, 29, 884–894. [Google Scholar] [CrossRef] [PubMed]
  10. Huang, X.; Wu, Y.; Ni, Y.; Xu, H.; He, Y. Global, regional, and national burden of type 2 diabetes mellitus caused by high BMI from 1990 to 2021, and forecasts to 2045: Analysis from the global burden of disease study 2021. Front. Public Health 2025, 13, 1515797. [Google Scholar] [CrossRef] [PubMed]
  11. Radcliffe, N.J.; Seah, J.M.; Clarke, M.; MacIsaac, R.J.; Jerums, G.; Ekinci, E.I. Clinical predictive factors in diabetic kidney disease progression. J. Diabetes Investig. 2017, 8, 6–18. [Google Scholar] [CrossRef] [PubMed]
  12. Nakanishi, S.; Hirukawa, H.; Shimoda, M.; Tatsumi, F.; Kohara, K.; Obata, A.; Okauchi, S.; Katakura, Y.; Sanada, J.; Fushimi, Y.; et al. Comparison of HbA1c levels and body mass index for prevention of diabetic kidney disease: A retrospective longitudinal study using outpatient clinical data in Japanese patients with type 2 diabetes mellitus. Diabetes Res. Clin. Pract. 2019, 155, 107807. [Google Scholar] [CrossRef] [PubMed]
  13. Nguyen, S.; Hsu, C.Y. Excess weight as a risk factor for kidney failure. Curr. Opin. Nephrol. Hypertens. 2007, 16, 71–76. [Google Scholar] [CrossRef] [PubMed]
  14. Cai, X.; Chen, Y.; Yang, W.; Gao, X.; Han, X.; Ji, L. The association of smoking and risk of diabetic retinopathy in patients with type 1 and type 2 diabetes: A meta-analysis. Endocrine 2018, 62, 299–306. [Google Scholar] [CrossRef] [PubMed]
  15. Ozyuncu, N.; Erol, C. From Metabolic Syndrome to Cardiovascular-Kidney-Metabolic Syndrome and Systemic Metabolic Disorder: A Call to Recognize the Progressive Multisystemic Dysfunction. Anatol. J. Cardiol. 2025, 29, 384–393. [Google Scholar] [CrossRef] [PubMed]
  16. Wang, Z.; Lavikainen, P.; Wikstrom, K.; Laatikainen, T. Trajectories of Body Mass Index and Risk for Diabetes Complications and All-Cause Mortality in Finnish Type 2 Diabetes Patients. Clin. Epidemiol. 2024, 16, 203–212. [Google Scholar] [CrossRef] [PubMed]
  17. Looker, H.C.; Knowler, W.C.; Hanson, R.L. Changes in BMI and weight before and after the development of type 2 diabetes. Diabetes Care 2001, 24, 1917–1922. [Google Scholar] [CrossRef] [PubMed]
  18. Hu, J.; Hu, Y.; Hertzmark, E.; Yuan, C.; Liu, G.; Stampfer, M.J.; Rimm, E.B.; Hu, F.B.; Wang, M.; Sun, Q. Weight Change, Lifestyle, and Mortality in Patients with Type 2 Diabetes. J. Clin. Endocrinol. Metab. 2022, 107, 627–637. [Google Scholar] [CrossRef] [PubMed]
  19. Tanaka, S.; Tanaka, S.; Iimuro, S.; Akanuma, Y.; Ohashi, Y.; Yamada, N.; Araki, A.; Ito, H.; Sone, H.; Japan Diabetes Complications Study, G.; et al. Body mass index and mortality among Japanese patients with type 2 diabetes: Pooled analysis of the Japan diabetes complications study and the Japanese elderly diabetes intervention trial. J. Clin. Endocrinol. Metab. 2014, 99, E2692–E2696. [Google Scholar] [CrossRef] [PubMed][Green Version]
  20. Koufakis, T.; Kokkinos, A.; le Roux, C.W. Why Lifestyle Alone Is Insufficient in Obesity: Biological Evidence, Conceptual Analogies and a Legacy of Missed Opportunities in Patient Care. Diabetes Obes. Metab. 2026, 28, 5424–5434. [Google Scholar] [CrossRef] [PubMed]
  21. Tanaka, S.; Tanaka, S.; Iimuro, S.; Ishibashi, S.; Yamashita, H.; Moriya, T.; Katayama, S.; Akanuma, Y.; Ohashi, Y.; Yamada, N.; et al. Maximum BMI and microvascular complications in a cohort of Japanese patients with type 2 diabetes: The Japan Diabetes Complications Study. J. Diabetes Complicat. 2016, 30, 790–797. [Google Scholar] [CrossRef] [PubMed]
  22. Ogawa, W.; Hirota, Y.; Miyazaki, S.; Nakamura, T.; Ogawa, Y.; Shimomura, I.; Yamauchi, T.; Yokote, K.; on behalf of the Creation Committee for Guidelines for the Management of Obesity Disease 2022 by Japan Society for the Study of Obesity (JASSO). Definition, criteria, and core concepts of guidelines for the management of obesity disease in Japan. Endocr. J. 2024, 71, 223–231. [Google Scholar] [CrossRef] [PubMed]
  23. Corpodean, F.; Kachmar, M.; Yang, S.; Heymsfield, S.B.; Katzmarzyk, P.T.; Schauer, P.R.; Cook, M.W.; Albaugh, V.L. Association of Obesity Severity with Cardiometabolic and Renal Disease Burden in the United States. Obesity 2026, 34, 323–328. [Google Scholar] [CrossRef] [PubMed]
  24. Kashiwagi, A.; Kasuga, M.; Araki, E.; Oka, Y.; Hanafusa, T.; Ito, H.; Tominaga, M.; Oikawa, S.; Noda, M.; Kawamura, T.; et al. International clinical harmonization of glycated hemoglobin in Japan: From Japan Diabetes Society to National Glycohemoglobin Standardization Program values. J. Diabetes Investig. 2012, 3, 39–40. [Google Scholar] [CrossRef] [PubMed]
  25. Matsuo, S.; Imai, E.; Horio, M.; Yasuda, Y.; Tomita, K.; Nitta, K.; Yamagata, K.; Tomino, Y.; Yokoyama, H.; Hishida, A.; et al. Revised equations for estimated GFR from serum creatinine in Japan. Am. J. Kidney Dis. Off. J. Natl. Kidney Found. 2009, 53, 982–992. [Google Scholar] [CrossRef] [PubMed]
  26. Kim, M.-J.; Kim, S.-W.; Ha, B.; Kim, H.S.; Kwon, S.-H.; Jin, J.; Choi, Y.-K.; Park, K.-G.; Kim, J.G.; Lee, I.-K.; et al. Persistent influence of past obesity on current adiponectin levels and mortality in patients with type 2 diabetes. Korean J. Intern. Med. 2025, 40, 299–309. [Google Scholar] [CrossRef] [PubMed]
  27. Zbrzeźniak-Suszczewicz, J.; Winiarska, A.; Perkowska-Ptasińska, A.; Stompór, T. Obesity-Related Glomerulosclerosis—How Adiposity Damages the Kidneys. Int. J. Mol. Sci. 2025, 26, 6247. [Google Scholar] [CrossRef] [PubMed]
  28. Kramer, H.J.; Lavenburg, L.M.; Navaneethan, S.D. Obesity in CKD: Core Curriculum 2026. Am. J. Kidney Dis. 2026, 88, 142–153. [Google Scholar] [CrossRef] [PubMed]
  29. Martinez-Montoro, J.I.; Morales, E.; Cornejo-Pareja, I.; Tinahones, F.J.; Fernandez-Garcia, J.C. Obesity-related glomerulopathy: Current approaches and future perspectives. Obes. Rev. 2022, 23, e13450. [Google Scholar] [CrossRef] [PubMed]
  30. Kutyrina, I.M. [Obesity-related glomerulopathy: Mechanisms of development, clinical course]. Ter. Arkh. 2017, 89, 97–101. [Google Scholar] [CrossRef] [PubMed]
  31. Bhatnagar, K.R.; Yadav, K.; Jaisingh, K.; Meena, S.; Dutt, N. Obstructive Sleep Apnea in Patients with and Without Diabetic Retinopathy: An Observational Study and Comparative Analysis. Cureus 2026, 18, e103775. [Google Scholar] [CrossRef] [PubMed]
  32. Shobatake, R.; Ota, H.; Takahashi, N.; Ueno, S.; Sugie, K.; Takasawa, S. The Impact of Intermittent Hypoxia on Metabolism and Cognition. Int. J. Mol. Sci. 2022, 23, 12957. [Google Scholar] [CrossRef] [PubMed]
  33. Altaf, Q.A.; Dodson, P.; Ali, A.; Raymond, N.T.; Wharton, H.; Fellows, H.; Hampshire-Bancroft, R.; Shah, M.; Shepherd, E.; Miah, J.; et al. Obstructive Sleep Apnea and Retinopathy in Patients with Type 2 Diabetes. A Longitudinal Study. Am. J. Respir. Crit. Care Med. 2017, 196, 892–900. [Google Scholar] [CrossRef] [PubMed]
  34. Ba-Ali, S.; Jennum, P.J.; Brondsted, A.E.; Heegaard, S.; Lund-Andersen, H. The Role of Obstructive Sleep Apnea in Vision-Threatening Diabetic Retinopathy-A National Register-Based Study. J. Pers. Med. 2023, 13, 1529. [Google Scholar] [CrossRef] [PubMed]
  35. El Ouardighi, H.; Poppe, K.G.; Kleynen, P.; Grabzcan, L.; Veltri, F.; Bruyneel, A.V.; Nguyen, P.A.H.; Bruyneel, M. Obstructive sleep apnea is not associated with diabetic retinopathy in diabetes: A prospective case-control study. Sleep Breath. 2023, 27, 121–128. [Google Scholar] [CrossRef] [PubMed]
  36. Yang, J.; Liu, Z. Mechanistic Pathogenesis of Endothelial Dysfunction in Diabetic Nephropathy and Retinopathy. Front. Endocrinol. 2022, 13, 816400. [Google Scholar] [CrossRef] [PubMed]
  37. American Diabetes Association Professional Practice Committee for Diabetes. 8. Obesity and Weight Management for the Prevention and Treatment of Diabetes: Standards of Care in Diabetes-2026. Diabetes Care 2026, 49, S166–S182. [Google Scholar] [CrossRef] [PubMed]
  38. Piccoli, G.B.; Ahmed, S.B.; Fakhouri, F.; Garovic, V.D.; Hladunewich, M.A.; Jesudason, S.; Prakash, J.; Webster, A.C.; Zakharova, E.; Cheung, M.; et al. Women and kidney health: Conclusions from a Kidney Disease: Improving Global Outcomes (KDIGO) Controversies Conference. Kidney Int. 2025, 108, 355–379. [Google Scholar] [CrossRef] [PubMed]
Figure 1. Flow diagram of the study participants.
Diabetology 07 00146 g001
Figure 2. Kaplan–Meier plots illustrating event-free survival based on maximum historical BMI and BMI at first visit. The x-axis represents the time from the first visit to the occurrence of each event or the last examination, whichever occurred first. The y-axis represents the event-free survival rate. (A) Event-free survival rate for elevated urinary protein, (B) event-free survival rate for ≥40% decline in eGFR, and (C) event-free survival rate for worsening retinopathy according to the modified Davis classification. Group II, maximum BMI 18.5 to <25; Group III, maximum BMI 25 to <30; Group IV, maximum BMI 30 to <35; Group V, maximum BMI ≥ 35.
Diabetology 07 00146 g002
Figure 3. Kaplan–Meier plots illustrating event-free survival based on BMI at first visit. The x-axis represents the time from the first visit to the occurrence of each event or the last examination, whichever occurred first. The y-axis represents the event-free survival rate. Panels display event-free survival for (A) Event-free survival rate for elevated urinary protein, (B) ≥40% decline in eGFR from the first examination, and (C) worsening of one or more levels according to the modified Davis classification. The severely obese group based on BMI at the first visit had a higher risk of retinal events than the normal weight group (log-rank p = 0.01). No significant risk differences were observed for eGFR lowering events across the BMI classifications at the first visit. Group II, BMI 18.5 to <25; Group III, BMI 25 to <30; Group IV, BMI 30 to <35; Group V, BMI ≥ 35.
Diabetology 07 00146 g003
Figure 4. Kaplan–Meier plot of the survival rate of the observation period of eGFR decline stratified by hypertension medication use. (A) Without hypertension medications. (B) With hypertension medications. Group II, BMI 18.5 to <25; Group III, BMI 25 to <30; Group IV, BMI 30 to <35; Group V, BMI ≥ 35.
Diabetology 07 00146 g004
Figure 5. Kaplan–Meier plot of the survival rate of the observation period of worsening retinopathy stratified by diabetes medication use. (A) Without diabetes medications. (B) With diabetes medications Group II, BMI 18.5 to <25; Group III, BMI 25 to <30; Group IV, BMI 30 to <35; Group V, BMI ≥ 35.
Diabetology 07 00146 g005
Figure 6. Kaplan–Meier plots illustrating microvascular event-free survival stratified by historical BMI trajectory (no change vs. decrease) across different BMI categories. The x-axis represents the observation period from the first clinical visit (years), and the y-axis shows the probability of event-free survival. The red lines indicate patients with a stable or increased weight trajectory (“no change”), whereas the blue lines represent patients who experienced a pre-visit weight reduction (“decrease”). Panels display the event-free survival rates for proteinuria progression (AC), a ≥40% decline in eGFR (DF), and worsening of diabetic retinopathy (GI), sub-analyzed within Group II (normal weight), Group III (class I obesity), and Group IV (class II obesity) based on BMI at the first clinical visit. Here, “decrease” indicates a reduction in one or more BMI categories from the lifetime maximum BMI to the first clinical visit, while “no change” indicates no category change. p-values were determined using the log-rank test.
Diabetology 07 00146 g006
Table 1. Baseline characteristics.
Total
N = 1041
Group II
N = 163 (15.7)
Group III
N = 493
(47.4)
Group IV
N = 270
(25.9)
Group V
N = 114
(11.0)
p-Value
Male/female, N (%)832 (79.9)/209 (20.1)121 (74.2)/42 (25.8)404 (81.9)/89 (18.1)221 (81.9)/49 (18.1)86 (75.4)/28 (24.6)0.085
Age at first visit (years)54.9 ± 10.558.1 ± 10.556.8 ± 9.952.2 ± 10.348.4 ± 9.2<0.0001
Diabetes duration (years)2.4 <0.1–7.5>1.9 <0.1–8.9>2.4 <0.2–7.5>2.1 <0.1–6.5>3.8 <0.3–8.1>0.288
HbA1c (NGSP) (%)8.9 ± 2.18.4 ± 1.98.7 ± 2.19.1 ± 2.29.6 ± 2.2<0.0001
BMI at first visit (kg/m2)26.3 ± 4.321.5 ± 1.924.8 ± 2.228.4 ± 2.634.0 ± 4.0<0.0001
Number of patients by BMI category at first visit (N, Underweight/Normal/Class I/Class II/Severe)16/422/417/146/4013/148/2/0/02/239/252/0/00/33/154/83/00/2/9/63/40<0.0001
eGFR at first visit (mL/min/1.73 m2)85.1 ± 20.284.5 ± 17.482.9 ± 19.987.7 ± 20.889.7 ± 22.20.001
Maximum weight-weight at first (kg)8.2 ± 7.04.7 ± 4.17.2 ± 5.410.4 ± 7.512.7 ± 10.4<0.0001
Maximum weight-weight at age 20 (kg) N = 99118 ± 10.79.3 ± 5.115.6 ± 6.622.8 ± 10.129.8 ± 15.6<0.0001
Urine protein, N (%) <0.0001
799 (76.8)141 (86.5)402 (81.5)188 (69.6)67 (58.8)
±86 (8.3)14 (8.6)38 (7.7)22 (8.1)12 (10.5)
1+100 (9.6)6 (3.7)35 (7.1)36 (13.3)23 (20.2)
2+31 (3.0)1 (0.6)11 (2.2)14 (5.2)5 (4.4)
3+25 (2.4)1 (0.6)7 (1.4)10 (3.7)7 (6.1)
Diabetic retinopathy, N (%) 0.003
NDR858 (82.4)141 (86.5)412 (83.6)227 (84.1)78 (68.4)
SDR128 (12.3)15 (9.2)60 (12.2)27 (10)25 (21.9)
PPDR55 (5.3)7 (4.3)21 (4.3)16 (5.9)11 (9.6)
Smoking history, N (%) 0.035
No smoking390 (37.5)61 (37.4)164 (33.3)110 (40.7)54 (47.4)
Past smoking322 (30.9)52 (31.9)173 (35.1)70 (25.9)27 (23.7)
Currently smoking329 (31.6)50 (30.7)156 (31.6)90 (33.3)33 (28.9)
Drinking history, N (%) 0.009
No drinking186 (17.9)37 (22.7)76 (15.4)44 (16.3)28 (24.6)
Past drinking62 (6.0)8 (4.9)21 (4.3)23 (8.5)10 (8.8)
Currently drinking793 (76.2)118 (72.4)396 (80.3)203 (75.2)76 (66.7)
Family history of type 2 diabetes, N (%)
1st degree diabetics291 (28.0)/750 (72.0)32 (19.6)/131 (80.4)137 (27.8)/356 (72.2)81 (30)/189 (70)41 (36)/73 (64)0.020
2nd degree diabetics125 (12.0)/916 (88.0)26 (16)/137 (84)57 (11.6)/436 (88.4)30 (11.1)/240 (88.9)12 (10.5)/102 (89.5)0.402
3rd degree diabetics50 (4.8)/991 (95.2)12 (7.4)/151 (92.6)18 (3.7)/475 (96.3)11 (4.1)/259 (95.9)9 (7.9)/105 (92.1)0.091
Baseline use of medications, N (%)
SU, N (%)151 (14.5)/890 (85.5)24 (14.7)/139 (85.3)75 (15.2)/418 (84.8)35 (13)/235 (87)17 (14.9)/97 (85.1)0.864
BG, N (%)432 (41.5)/609 (58.5)52 (31.9)/111 (68.1)178 (36.1)/315 (63.9)128 (47.4)/142 (52.6)74 (64.9)/40 (35.1)<0.0001
DPP-4 inhibitor, N (%)300 (28.8)/741 (71.2)41 (25.2)/122 (74.8)146 (29.6)/347 (70.4)74 (27.4)/196 (72.6)38 (33.3)/76 (66.7)0.455
GLP-1, N (%)35 (3.4)/1006 (96.6)2 (1.2)/161 (98.8)13 (2.6)/480 (97.4)8 (3)/262 (97)12 (10.5)/102 (89.5)<0.0001
SGLT2 inhibitor, N (%)58 (5.6)/983 (94.4)2 (1.2)/161 (98.8)18 (3.7)/475 (96.3)22 (8.1)/248 (91.9)16 (14)/98 (86)<0.0001
Insulin, N (%)229 (22.0)/812 (78.0)41 (25.2)/122 (74.8)102 (20.7)/391 (79.3)60 (22.2)/210 (77.8)25 (21.9)/89 (78.1)0.695
Any of above antidiabetic drugs, N (%)713 (68.5)/328 (31.5)101 (62)/62 (38)325 (65.9)/168 (34.1)194 (71.9)/76 (28.1)92 (80.7)/22 (19.3)0.003
Calcium channel blocker, N (%)177 (17.0)/864 (83.0)15 (9.2)/148 (90.8)80 (16.2)/413 (83.8)46 (17)/224 (83)35 (30.7)/79 (69.3)<0.0001
RAS system blockers, N (%)286 (27.5)/755 (72.5)24 (14.7)/139 (85.3)133 (27)/360 (73)79 (29.3)/191 (70.7)49 (43)/65 (57)<0.0001
Diuretic, N (%)30 (2.9)/1011 (97.1)2 (1.2)/161 (98.8)18 (3.7)/475 (96.3)3 (1.1)/267 (98.9)7 (6.1)/107 (93.9)0.019
Beta-blocker, N (%)31 (3.0)/1010 (97.0)3 (1.8)/160 (98.2)13 (2.6)/480 (97.4)8 (3)/262 (97)7 (6.1)/107 (93.9)0.181
Alpha-blocker, N (%)7 (0.7)/1034 (99.3)0 (0)/163 (100)1 (0.2)/492 (99.8)4 (1.5)/266 (98.5)2 (1.8)/112 (98.2)0.061
Any of above antihypertensive drugs, N (%)333 (32.0)/708 (68.0)32 (19.6)/131 (80.4)150 (30.4)/343 (69.6)95 (35.2)/175 (64.8)55 (48.2)/59 (51.8)<0.0001
Group I (N = 1) was omitted from the table. Categorical variables were expressed as numbers (%). Continuous variables are expressed as the mean ± standard deviation for normal distributions and as the median <interquartile range> for non-normal distributions. BMI at the first visit was classified into five groups, similar to the groups for the maximum BMI: group I (<18.5), group II (18.5 to <25), group III (25 to <30), group IV (30 to <35), group V (≥35). Baseline tests were performed using an analysis of variance for continuous variables and the chi-squared test for categorical variables for groups II through V, excluding group I. Abbreviations: BMI, body mass index; eGFR, estimated glomerular filtration rate; NDR, no diabetic retinopathy; SDR, simple diabetic retinopathy; PPDR, pre-proliferative diabetic retinopathy; SU, sulfonylurea; BG, biguanide; RAS, Renin-Angiotensin System. Group I, maximum BMI < 18.5; Group II, maximum BMI 18.5 to <25; Group III, maximum BMI 25 to <30; Group IV, maximum BMI 30 to <35; Group V, maximum BMI ≥ 35.
Table 2. Results of univariate and multivariate Cox regression analysis.
EventModelBMI GroupHR[95% CI]
ProteinuriaUniIII vs. II1.29[0.90–1.85]
IV vs. II1.64[1.12–2.40]
V vs. II2.10[1.36–3.26]
MultiIII vs. II1.30[0.90–1.87]
IV vs. II1.77[1.19–2.62]
V vs. II1.98[1.24–3.17]
eGFR declineUniIII vs. II1.63[0.87–3.04]
IV vs. II2.42[1.28–4.60]
V vs. II2.59[1.23–5.42]
MultiIII vs. II1.60[0.85–3.00]
IV vs. II1.73[0.89–3.37]
V vs. II1.30[0.59–2.85]
RetinopathyUniIII vs. II1.16[0.74–1.80]
IV vs. II1.25[0.77–2.03]
V vs. II2.03[1.18–3.48]
MultiIII vs. II1.16[0.74–1.82]
IV vs. II1.09[0.65–1.81]
V vs. II1.60[0.89–2.88]
The results of the univariate and multiple regression analyses using the Cox proportional hazards model are expressed as HRs and 95% CIs. The Uni model was adjusted for maximum BMI only, while the Multi model was adjusted for age, sex, duration of diabetes, HbA1c (NGSP), urine protein at first visit, eGFR at first visit, retinopathy classification at first visit, 1st degree family history of diabetes, and use of diabetes and hypertension medications. BMI, body mass index; HR, hazard ratio; CI, confidence interval. Group II, BMI 18.5 to <25; Group III, BMI 25 to <30; Group IV, BMI 30 to <35; Group V, BMI ≥ 35.
Disclaimer/Publisher’s Note: The statements, opinions and data contained in all publications are solely those of the individual author(s) and contributor(s) and not of MDPI and/or the editor(s). MDPI and/or the editor(s) disclaim responsibility for any injury to people or property resulting from any ideas, methods, instructions or products referred to in the content.