1. Introduction
Diabetes mellitus, a chronic condition caused by uncontrolled blood sugar levels, represents a major public health concern with a rapidly increasing prevalence over the past decades, often leading to complications such as foot ulcers (approximately one-third of diabetic patients are likely to develop diabetic foot ulcers). The International Diabetes Federation (IDF) reports a continued global increase in diabetes prevalence and estimates that affects 589 million adults (20–79 years) worldwide [
1]. This estimate is expected to reach 853 million by 2050. Research shows that people with diabetes have an approximately 34% lifetime risk of acquiring diabetic foot ulcer (DFU) [
2], which leads to a risk of lower limb amputations up to 85%, mainly caused by poor diagnosis and treatment. Approximately 90% of annual amputations in the United Kingdom and 67% in the USA are estimated to be associated with diabetes [
3]. High-risk patients require regular medical evaluation, resulting in a strong economic impact, especially in developing countries [
4].
DFU, resulting from diabetes, is defined as an open wound commonly located on the bottom of the foot or around the toes [
5]. Ulcers are formed as a result of skin tissue breaking down and exposing the layers underneath. If left untreated, infection can progress continuously to severe stages and involve the deeper soft tissues and ultimately the bone, potentially leading to amputations of the lower limb [
6] and prolonged hospitalization [
7]. Globally, a diabetes-related amputation occurs every 20 seconds, highlighting the severe implications of this condition [
8]. Furthermore, amputations have a significant impact on mortality rates. While the 5-year survival rate for patients with DFU is 70%, this percentage drops significantly to 43% following a major amputation [
9]. Individuals with DFU are estimated to face a 5-year mortality risk 2.5 times higher than diabetic patients without DFUs [
10]. Early detection, together with accurate screening and appropriate management strategies, plays a crucial role in the treatment and prevention of further serious complications. Risk indicators include neuropathy, poor circulation, foot deformity, using inappropriate shoes, and uncontrolled blood sugar [
5]. These may lead to foot ulcers, with risk factors including neuropathy, peripheral artery disease, foot deformities, diabetes complications and obesity [
11].
Traditional detection methods rely mainly on visual inspections performed by specialists, and so there are some limitations to take into account. The first one is accessibility, as the availability of specialists may be limited, namely, in rural areas and remote regions. People with diabetes living in rural areas are more likely to develop complications of the disease compared to people who live in the suburbs and cities due to a lack of access to medical care [
12]. The second limitation is subjectivity, as visual assessment made by medical specialists depends on the opinion and experience of the specialists, which varies among professionals.
Furthermore, in-person assessment may be expensive, time-consuming, resource and labor-intensive, and require specialized expertise [
4,
13]. By using technology and computer-aided diagnosis methods, it is possible to automate the process of detection and prevention while minimizing costs and the amount of time spent on traditional methods. This is where the integration of machine learning and deep learning becomes useful as a method to prevent, detect and evaluate the progression of diabetic foot ulcers, offering a faster and more cost-effective approach, and so the advancements in artificial intelligence and generative AI help to address these challenges [
13]. Image-based diagnostic systems are non-invasive and can be used in remote or resource-constrained settings, empowering healthcare professionals and patients with accessible tools for early detection and improved treatment. The continuous monitoring of diabetic foot patients is crucial to monitor their healing process and provide adequate medication to prevent complications [
14], along with economic benefits.
This paper presents a diabetic foot risk assessment system that predicts the risk of ulcer progression and development from foot images of diabetic patients. Current diagnostic methods based on visual inspections tend to have a subjective degree, often depending on the level of experience of the healthcare professional. Automated methods have the potential to overcome these limitations by analyzing a large number of images, and generating a combined assessment, thus reducing the burden on healthcare professionals. Unlike traditional methods, which are limited by the availability of healthcare professionals, automated systems can operate continuously, reducing delays in care and enabling timely interventions.
In this work, foot images are individually labeled using a Generative AI model (GPT-4o-mini) to assign a risk label (Low Risk, Medium Risk or High Risk) based on features in the images, such as ulcers, dryness, discoloration, and others. These labels are then used to train and evaluate two pre-trained ResNet50 and VGG16 models. Multiple images of the same foot are used, and the system reports a risk prediction for each, combining them all through meaningful criteria. The results show the practical viability of using Generative AI to train common CNNs and contribute to automating, and potentially massify, DF analysis. The structure of this paper is as follows;
Section 2 reviews related work, followed by
Section 3 with the details on the methods,
Section 4 on results,
Section 5 on the Streamlit App developed, and
Section 6 with the conclusions.
2. Literature Review
Several recent studies have explored a wide range of approaches on diabetic foot ulcer detection and classification, including convolutional neural networks (CNNs), data augmentation strategies and optimization algorithms, and the integration of additional interpretation techniques such as Grad-CAM (Gradient-weighted Class Activation Mapping, see [
15]).
Additionally, deep learning-based systems have been developed to detect DFU from patient foot images, offering more reliable localization of ulcer points [
16].
An automated scoring system for DFU, named ScoreDFUNet, used to evaluate their severity by identifying ulceration, infection and other features in DFU images, was proposed in [
4]. The system combines deep learning with image analysis to classify ulcer images into four categories: ulcer, infection, normal and gangrene. U-Net was used for segmentation, and ResNet50 was used as the backbone network for stratification. The dataset initially included 1426 DFU images: 603 from the DFUC2020 dataset and 823 from Xiangya Hospital. To augment the dataset, 518 images from Kaggle were used. The model achieved 95.34% accuracy, along with high precision, recall and F1-scores across all categories. Grad-CAM was also used to generate visual heatmaps that highlight the regions of DFU images that contributed most to the model’s predictions. In addition, other contributions of this work include the comparison with dermatologists at different experience levels and the development of a web app to assist medical professionals, allowing them to upload patient images and receive scoring results.
A deep learning approach, DFU_MultiNet, was proposed in [
17] to classify healthy and ulcer skin images using a multi-scale transfer learning approach. The method integrates three pre-trained CNN models, VGG19, DenseNet201 and NasNetMobile, to extract features from diabetic foot images. These features are then merged through a summing layer and fine-tuned with additional layers, such as dense, dropout and batch normalization. The dataset was collected from a publicly accessible dataset, which includes both healthy and ulcerated skin samples. Data augmentation techniques were used to address the limited number of samples in the dataset, increasing the size of the dataset from 1055 images to 6963. The images were divided into training (70%), validation (10%) and test sets (20%). The proposed DFU_MultiNet achieved strong performance across all metrics, including 99.1% accuracy, 100% precision, 98.2% recall and 99.1% F1-score.
Multiple convolutional neural network (CNN) architectures for the classification of diabetic foot ulcers, specifically for infection and ischemia categorization, were proposed in [
6]. The DFU2020 dataset was used, containing 1459 images. Dataset imbalance was addressed through data augmentation techniques such as rotation, flipping, scaling, and others. Several pre-trained CNN models were tested, including AlexNet, VGG16, VGG19, ResNet50, ResNet101, GoogleNet, MobileNet, SqueezeNet and DenseNet. The performance of the models was evaluated using accuracy, sensitivity, specificity, precision, F1-score, AUC and MCC. Among all models, ResNet50 outperformed the other models, achieving the best overall results, reaching 99.49% accuracy for ischemia classification and 84.76% accuracy for infection classification. This study highlights that the performance for ischemia detection is higher than for infection detection, which can be explained by an imbalance, and so a larger and more representative dataset would likely improve infection classification. This work essentially demonstrates that fine-tuned deep learning models, namely, ResNet50, can achieve strong performance in the diabetic foot field. However, the authors emphasized that future work should focus on expanding the dataset to improve performance in infection classification.
A CNN and Grad-CAM-based approach to assess the evolution of ulcerations was described in [
18]. The methodology employed in this thesis involves a dataset with 1000 foot images sourced from Kaggle, consisting of 500 images of ulcerated feet and 500 of normal feet. These images were preprocessed using data augmentation techniques and divided into training, validation and testing subsets to ensure rigorous evaluation of the models. Pre-trained CNN architectures, including EfficientNet-B2, ResNet50, ResNet101 and DenseNet121, were tested. In addition to this methodology, Grad-CAM was used to interpret the model’s predictions, enabling visualization of regions influencing the detection of ulcers. Besides classification, the model was also designed to monitor the progression of ulcers over time, analyzing risk factors associated with the evolution of ulcers.
The fine-tuned EfficientNet-B2 model achieved the best performance, with an Area Under the Curve (AUC) of 0.96, along with a MAP of 0.88 and an F1-score of 0.91. The system’s outputs were validated by a podiatrist specializing in diabetic foot ulcers, confirming its clinical reliability and demonstrating its ability to track the evolution of ulcers and classify their severity.
The deep learning approach in [
19] used Faster R-CNN and Inception-ResNetV2 architectures on a dataset with 1775 DFU images and respective expert labels and a testing dataset with 203 images. This work targeted the evolution of ulcerations and not the risk assessment of the pre-ulceration phase. Moreover, ulcerations have distinctive visual signatures that simplify its detection by machine learning techniques. This can be easily confirmed in recent literature; see, for instance, the survey in [
20], where accuracies above 90% are reported, and [
21] for automatic ulcer detection from images, using CNN and LSTM, with accuracy above 94%.
3. Methodology and Methods
This study aims at developing a system that predicts the evolution of the diabetic foot in three risk categories, namely, Low Risk, Medium Risk and High Risk (this form of categorizing DF risk is commonly used in some Health Systems). The focus of this project is to estimate a risk metric for the expected evolution over time based on visual signs, such as skin condition, the severity of existing ulcers, and patches of rough and dry skin. No patient-reported information is used. The current developments in Generative AI (GenAI) define the methodology used. The methods include dataset preparation, training of pre-trained CNN models and the development of a Streamlit App that serves as a user interface, provides insight into the regions of the foot that are at risk of ulcer formation, and yields a risk label for each patient based on a set of foot images and the integration of Grad-CAM visualizations.
3.1. Methodology
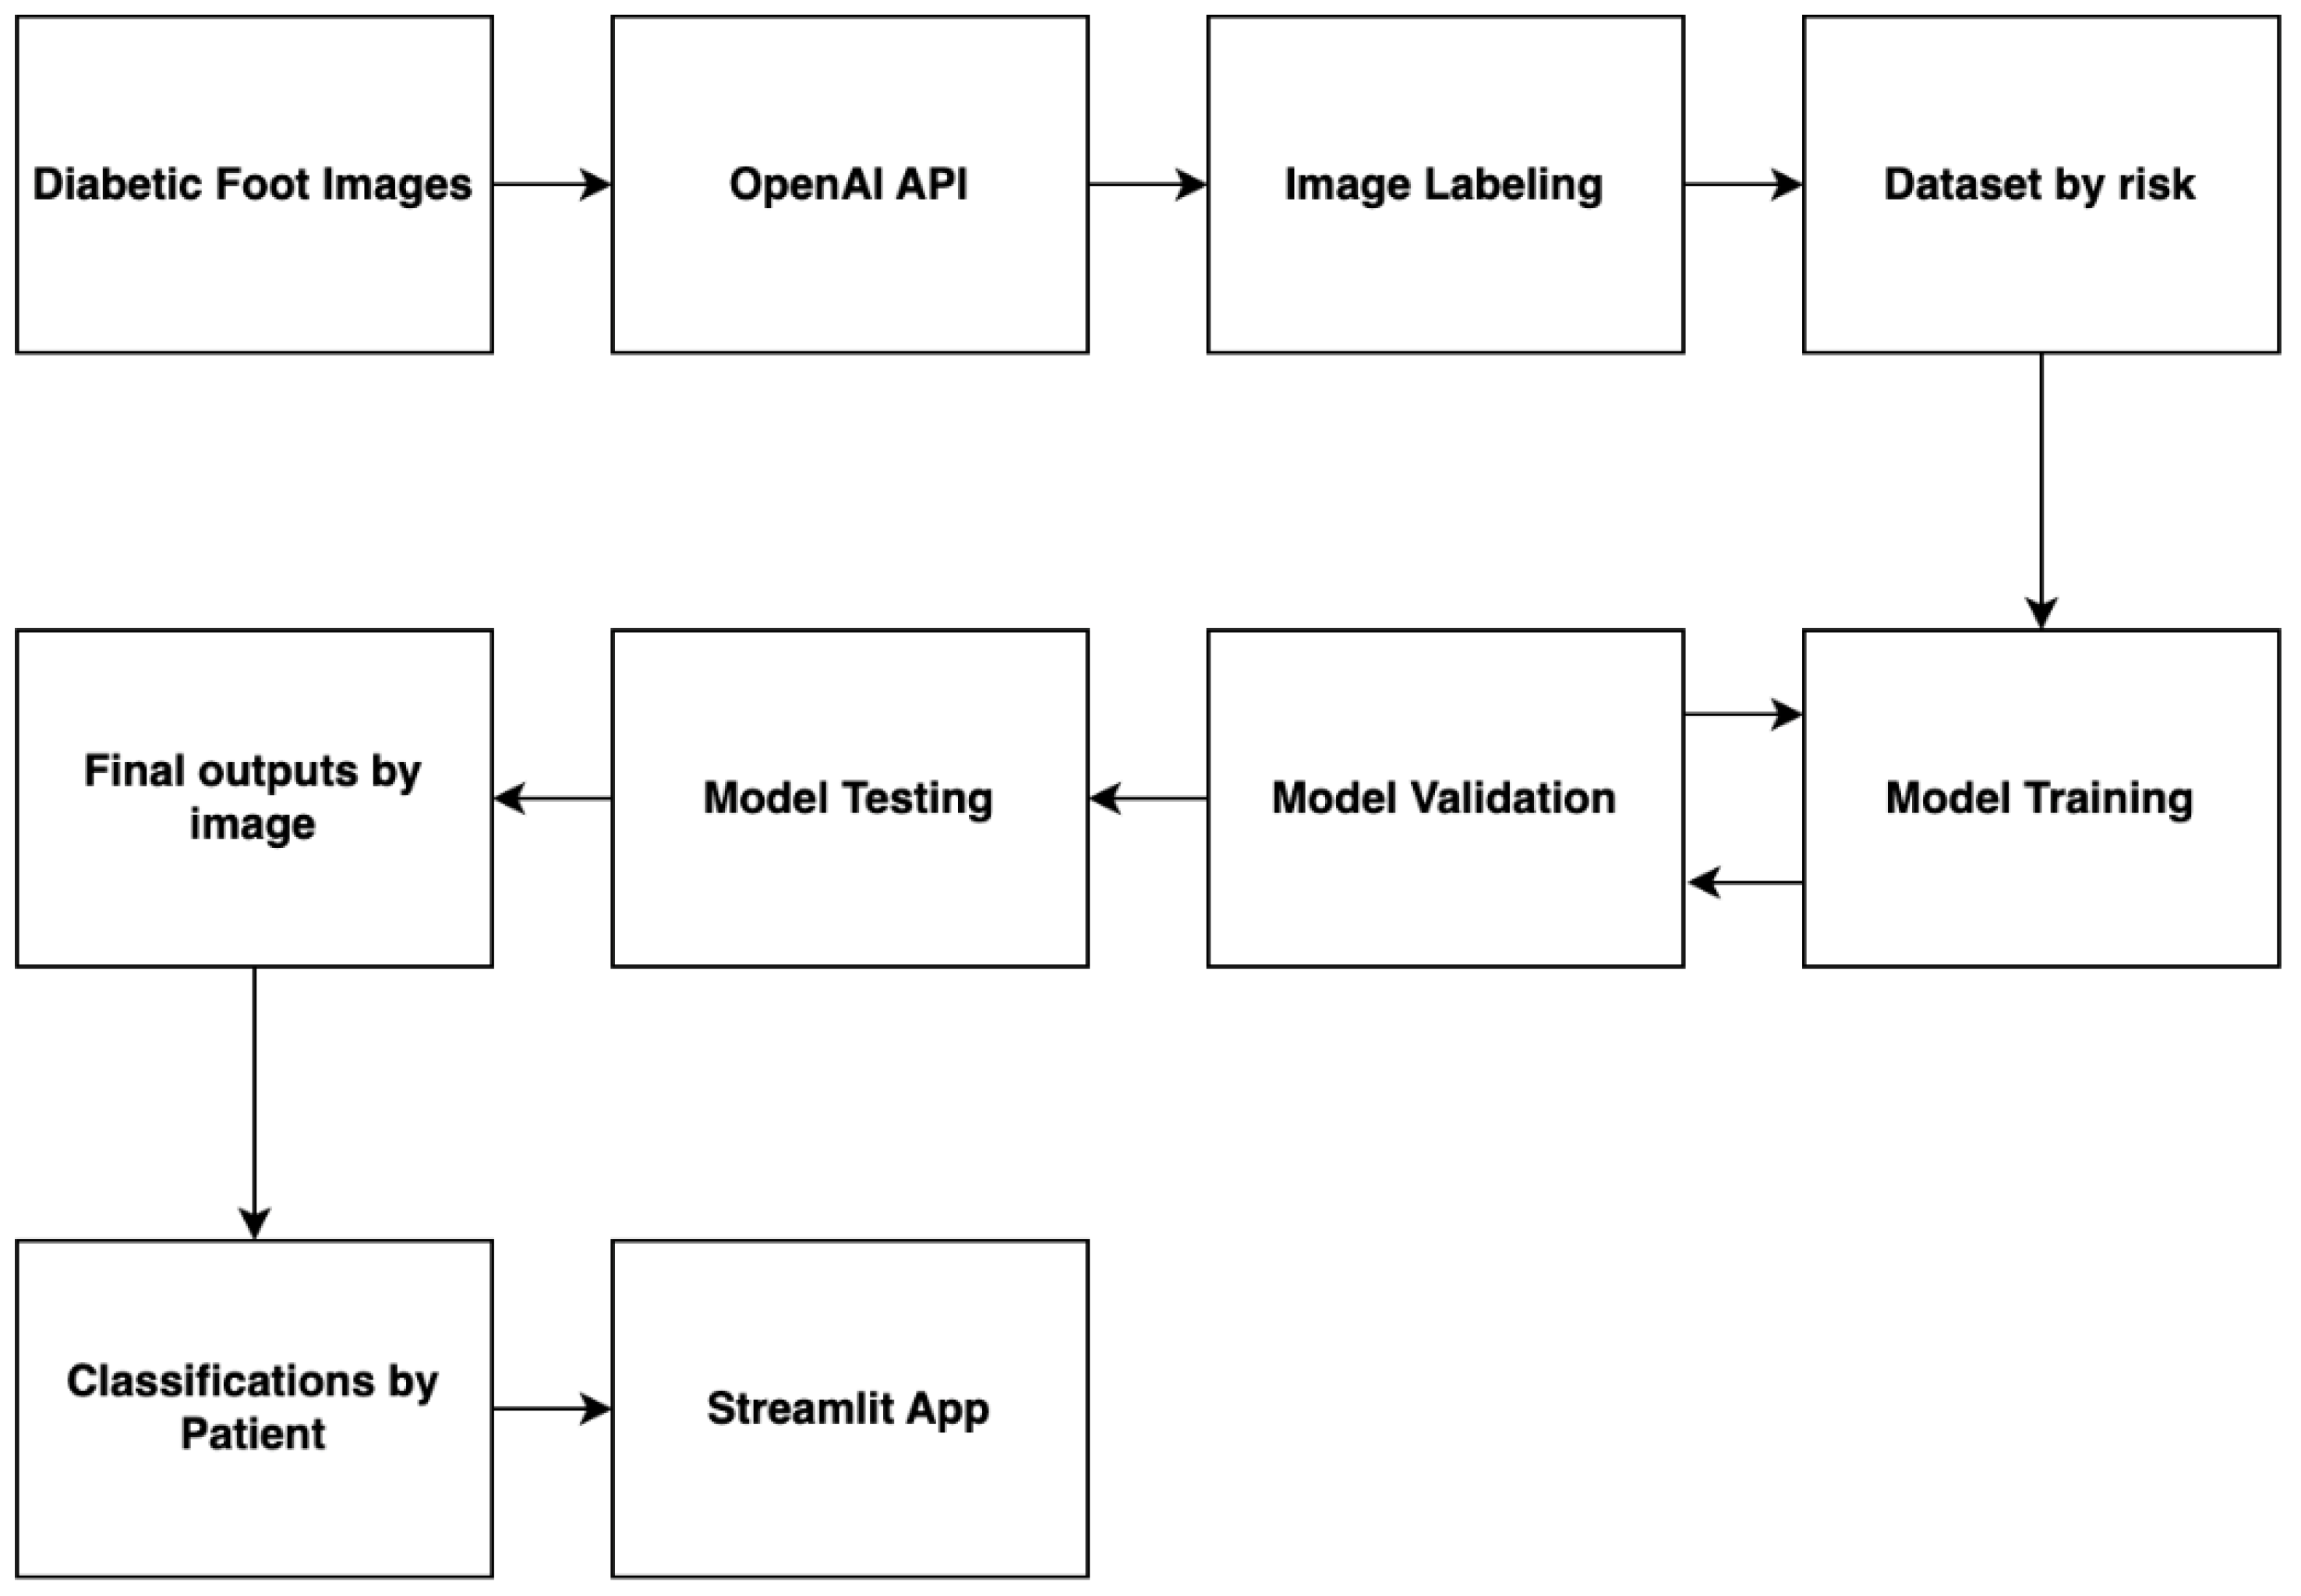
The procedure begins with the process of data collection for the creation of a dataset, followed by the dataset labeling process using GenAI, and finally the application of a methodology to predict the risk of evolution of the diabetic foot to a more severe stage, including evaluation for images and patients (by aggregating each patient’s image labels based on a criterion). This section also emphasizes the importance of data augmentation and oversampling techniques to address certain limitations and improve model generalization. The overall workflow is illustrated in
Figure 1.
The process starts with the collection of clinical images of diabetic feet. The dataset used for this study consisted of images of DF patients feet. The images used in this study were obtained using a system of cameras built for the DFAA project (Diabetic Foot Automated Assessment,
https://sites.google.com/view/dfaa-pex/home, accessed on 1 May 2026) at a ULS (acronym for Unidade Local de Saúde, or Local Health Unit, of the Portuguese Health System) hospital.
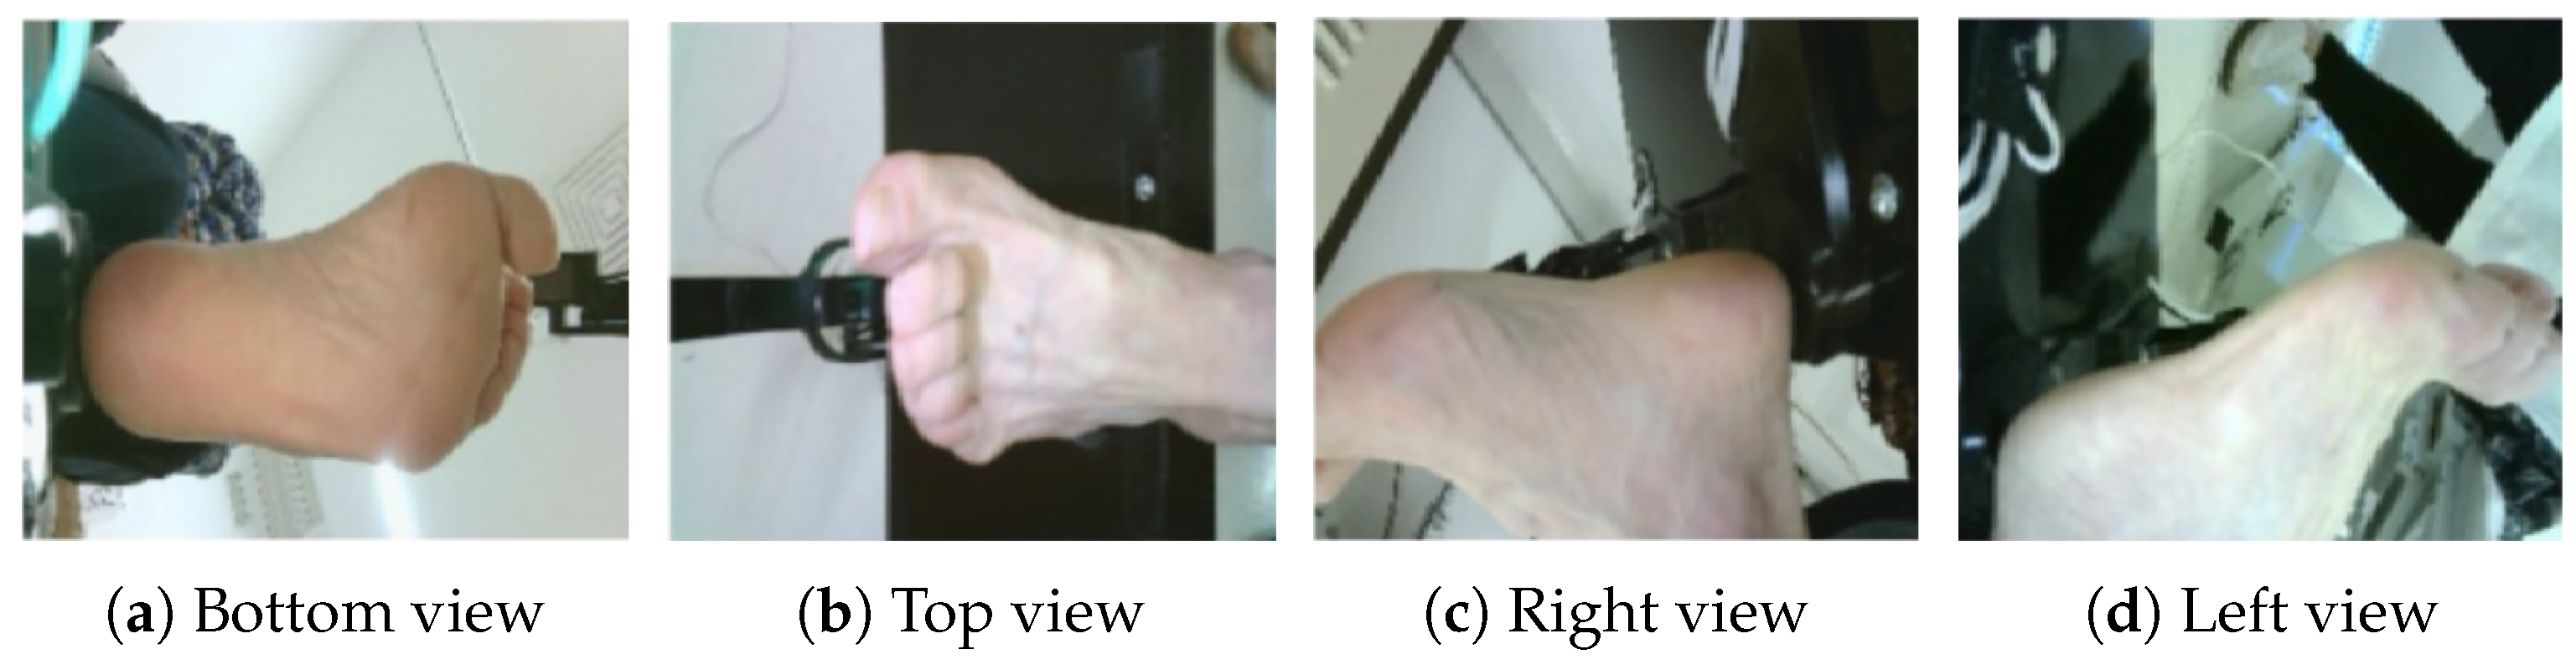
The original dataset was organized in subfolders, each corresponding to an individual patient, each containing images from the same foot was represented from four different views: top, bottom and both sides (see
Figure 2).
At this stage, each image was individually labeled using the OpenAI API, which assigned one of three risk categories (Low, Medium or High Risk) for each image in the dataset. Based on these labels, a new organized dataset was automatically generated. Images identified as High Risk were placed into a “High Risk” folder, those identified as Medium Risk into a “Medium Risk” folder, and finally, those identified as Low Risk into a “Low Risk” folder. This process transformed a patient-based dataset into a fully structured dataset divided by risk category, ready to be used as input to our models.
Although the dataset used to train and evaluate the models is no longer composed of individual patient subfolders, each file name retains a unique patient identifier (patientX_imageX), which ensures that, even after being processed individually, the images will later be regrouped to give a single risk class for the respective patient. The dataset used for the development of this study is available upon request, with open access granted for academic purposes under CC-BY or ODC-BY licensing.
The inclusion of multiple views of the same foot is essential, as certain risk signs, such as ulcers, discoloration and swelling, might only be visible from a particular angle, while other regions of the foot can look healthy without any risk signs.
3.2. Dataset Limitations
One of the main challenges in this process was class imbalance. As is common in medical datasets, the majority of the images fell into the Low Risk and Medium Risk categories, with a few samples being classified as High Risk.
To mitigate the imbalance, the dataset was supplemented with external images in the public domain, such as the Kaggle dataset [
22], which provided additional examples of severe High Risk cases, including open ulcers. This step is important to ensure that the model is exposed to the full spectrum of DF cases. Note that Kaggle images have, in general, different resolutions from the ones obtained at the hospital, requiring resizing, and lighting conditions will be different, a variety of cameras may have been used, and patient demographics may vary significantly.
Data augmentation and oversampling techniques are also applied during training to artificially increase the size and diversity of the dataset, particularly for the minority class (High Risk). The data augmentation strategy includes horizontal flipping, rotation, zoom variations, contrast adjustment, brightness modification and subtle translation. For minority classes, particularly High Risk samples, aggressive data augmentation is applied with enhanced rotation ranges and additional color jittering to increase sample diversity while preserving the essential features.
The High Risk samples were oversampled by a tenfold factor to ensure adequate representation during training. The oversampling is performed only on the training set to prevent data leakage into the validation and test sets.
Table 1 presents the number of images per risk category, comparing the dataset before and after the inclusion of additional images from Kaggle. While the Low Risk and Medium Risk categories remained unchanged, the High Risk category doubled in size, partially mitigating the imbalance highlighted earlier.
The final dataset consists of 3255 images, divided into risk classes: 1807 images for Low Risk, 1294 images for Medium Risk and 154 images for High Risk.
3.3. Patient Risk Labels and Dataset Split
The dataset splitting strategy is based on a stratified approach by patients to ensure that there is no data leakage between training, validation and test sets. For patient identification, a patient ID is present in each image filename, and all images sharing the same ID are treated as one patient sample. The patient stratification is based on a specific rule:
High Risk: A patient is classified as High Risk if they have at least one High Risk image.
Medium Risk: A patient is classified as Medium Risk if they have more Medium than Low Risk images (or equal).
Low Risk: A patient is classified as Low Risk if they have more Low Risk images than Medium.
Using this criterion to obtain the risk labels for each patient, we can compute the distribution of patients per risk class, taking into account the risk class of each of their images. The dataset is composed by 946 patients divided into risk classes: 428 Low Risk, 383 Medium Risk and 135 Low Risk.
Before splitting, each patient receives a single label based on this aggregation rule. Then, patients are divided into three different sets: 70% for the training set, 15% for the validation and 15% for the test set, with stratification performed by patient, which prevents the same patient’s images from appearing in multiple sets. After selecting the patient sets, all images from a given patient are assigned to that patient’s split.
3.4. Generative AI Data Labeling
The proposed methodology applies Generative AI for dataset labeling to improve the annotation process for diabetic foot images by developing a pipeline that automates this process. Automated labeling with large language models, like GPT, uses their pre-trained knowledge and their multi-modal capabilities, meaning their capacity to analyze both images and text, to interpret data and contextualize clinical features. GenAI enables the automation of the annotation process, offering a cost–benefit method and providing scalability [
23], as once the prompts are established, a large number of images can be annotated without the need for manual inspection.
An essential step to make GenAI effective for dataset annotation is to formulate the right prompt for our task, a practice known as prompt engineering [
24]. A well-designed prompt must provide clear and concise instructions that precisely describe the task [
23] and guide the model toward consistent responses and outputs. This can be seen as an iterative process, as the request can be refined if the output is not clear or consistent with the expectations. Over time, the goal is to build a complete and polished prompt that reliably generates high-quality and consistent labels, minimizing the risk for manual correction.
Using a multimodal GenAI model, specifically GPT, we are able to annotate a dataset with labels, indicating the risk of ulcer formation or evolution to a more severe state for a specific image. The labeled dataset is then used to train the models to predict the risk of progression into more severe stages. For this labeling process, an automated pipeline was developed to automatically label each image of the dataset using the OpenAI GPT-4o-mini model.
The pipeline is designed to emulate the reasoning process of a medical assistant specializing in diabetic foot risk assessment, assigning a risk label (Low Risk, Medium Risk or High Risk) to each individual image, along with explanatory evidence and key findings. Rather than labeling entire patients directly, the system processes images individually, as the patient labels are later attributed by aggregating the individual image risk labels and predictions according to predefined criteria.
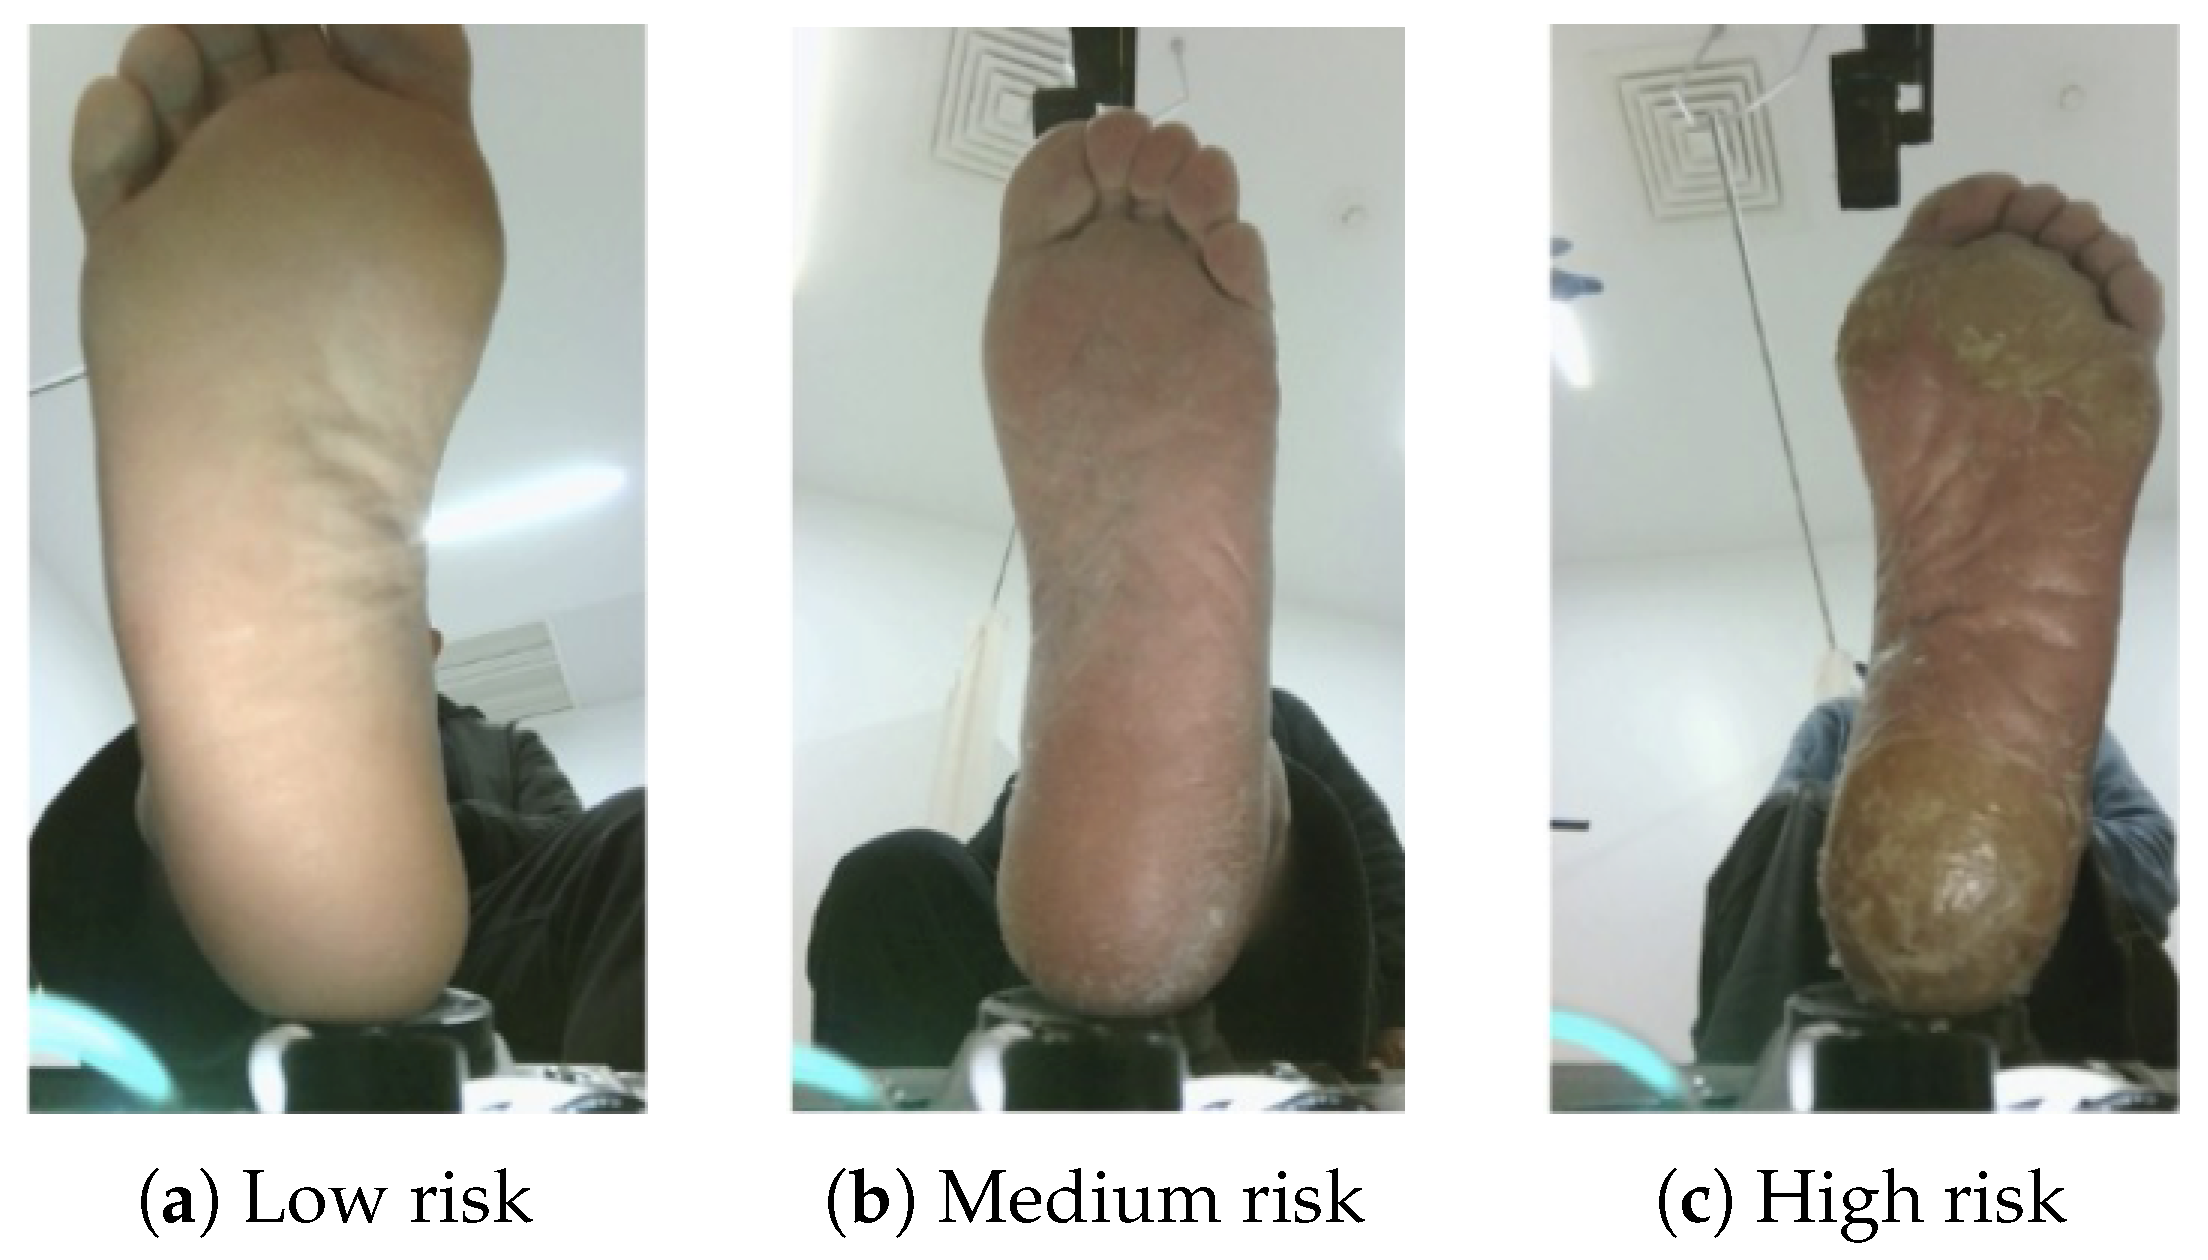
Figure 3 shows samples of each risk class, assigned by GPT according to the visual features observed and described in the prompt used in this work (see
Appendix A).
An important part of this task is building a prompt capable of guiding the AI model (GPT) to perform a specific task [
25]. Optimizing the prompt is essential to improve the performance of the model [
23,
26,
27], and, in general, will require multiple iterations. In the field of medical image classification, the use of large language models (LLMs), like GPT, has shown great promise [
26], because of their ability to learn from textual contexts and multi-modal abilities. The AI model assigns one of three labels: Low Risk, Medium Risk or High Risk, based on visible clinical features and characteristics of the patient’s foot. The images added from the Kaggle dataset were labeled with GPT.
GPT labeling can, occasionally, present inconsistencies as when interpreting subtle features in Low Risk and Medium Risk images similarly, leading to ambiguity between the two classes. In practice, this means that Low and Medium risk images show similar visual signs, and GPT can not be entirely accurate when labeling these types of images. While such misclassifications are difficult to eliminate completely, they highlight the importance of careful interpretation of the results and the need for expert-verified annotations in future work.
3.5. Comparison with Expert Annotations
The clinical impact of errors made by automated systems can be huge, and errors are, generally, unacceptable. Indicators such as sensitivity, i.e., true positive rate, and specificity, i.e., the true negative rate, are often used to compare the performance of human and machine learning systems. These, however, can be biased by the opinions of the human experts themselves, which can be wrong. This is particularly relevant for labeling systems like the one used in this work, with only three labels and non-rigid boundaries separating them.
Still, given the variability introduced by prompt modifications, it is important to compare automated labels with those provided by medical experts. To evaluate the reliability of GPT-generated annotations, we compared them against a subset of 87 patients annotated by medical experts. This subset represents a smaller portion of the dataset but provides a valuable reference to evaluate whether GPT can assign risk labels consistently.
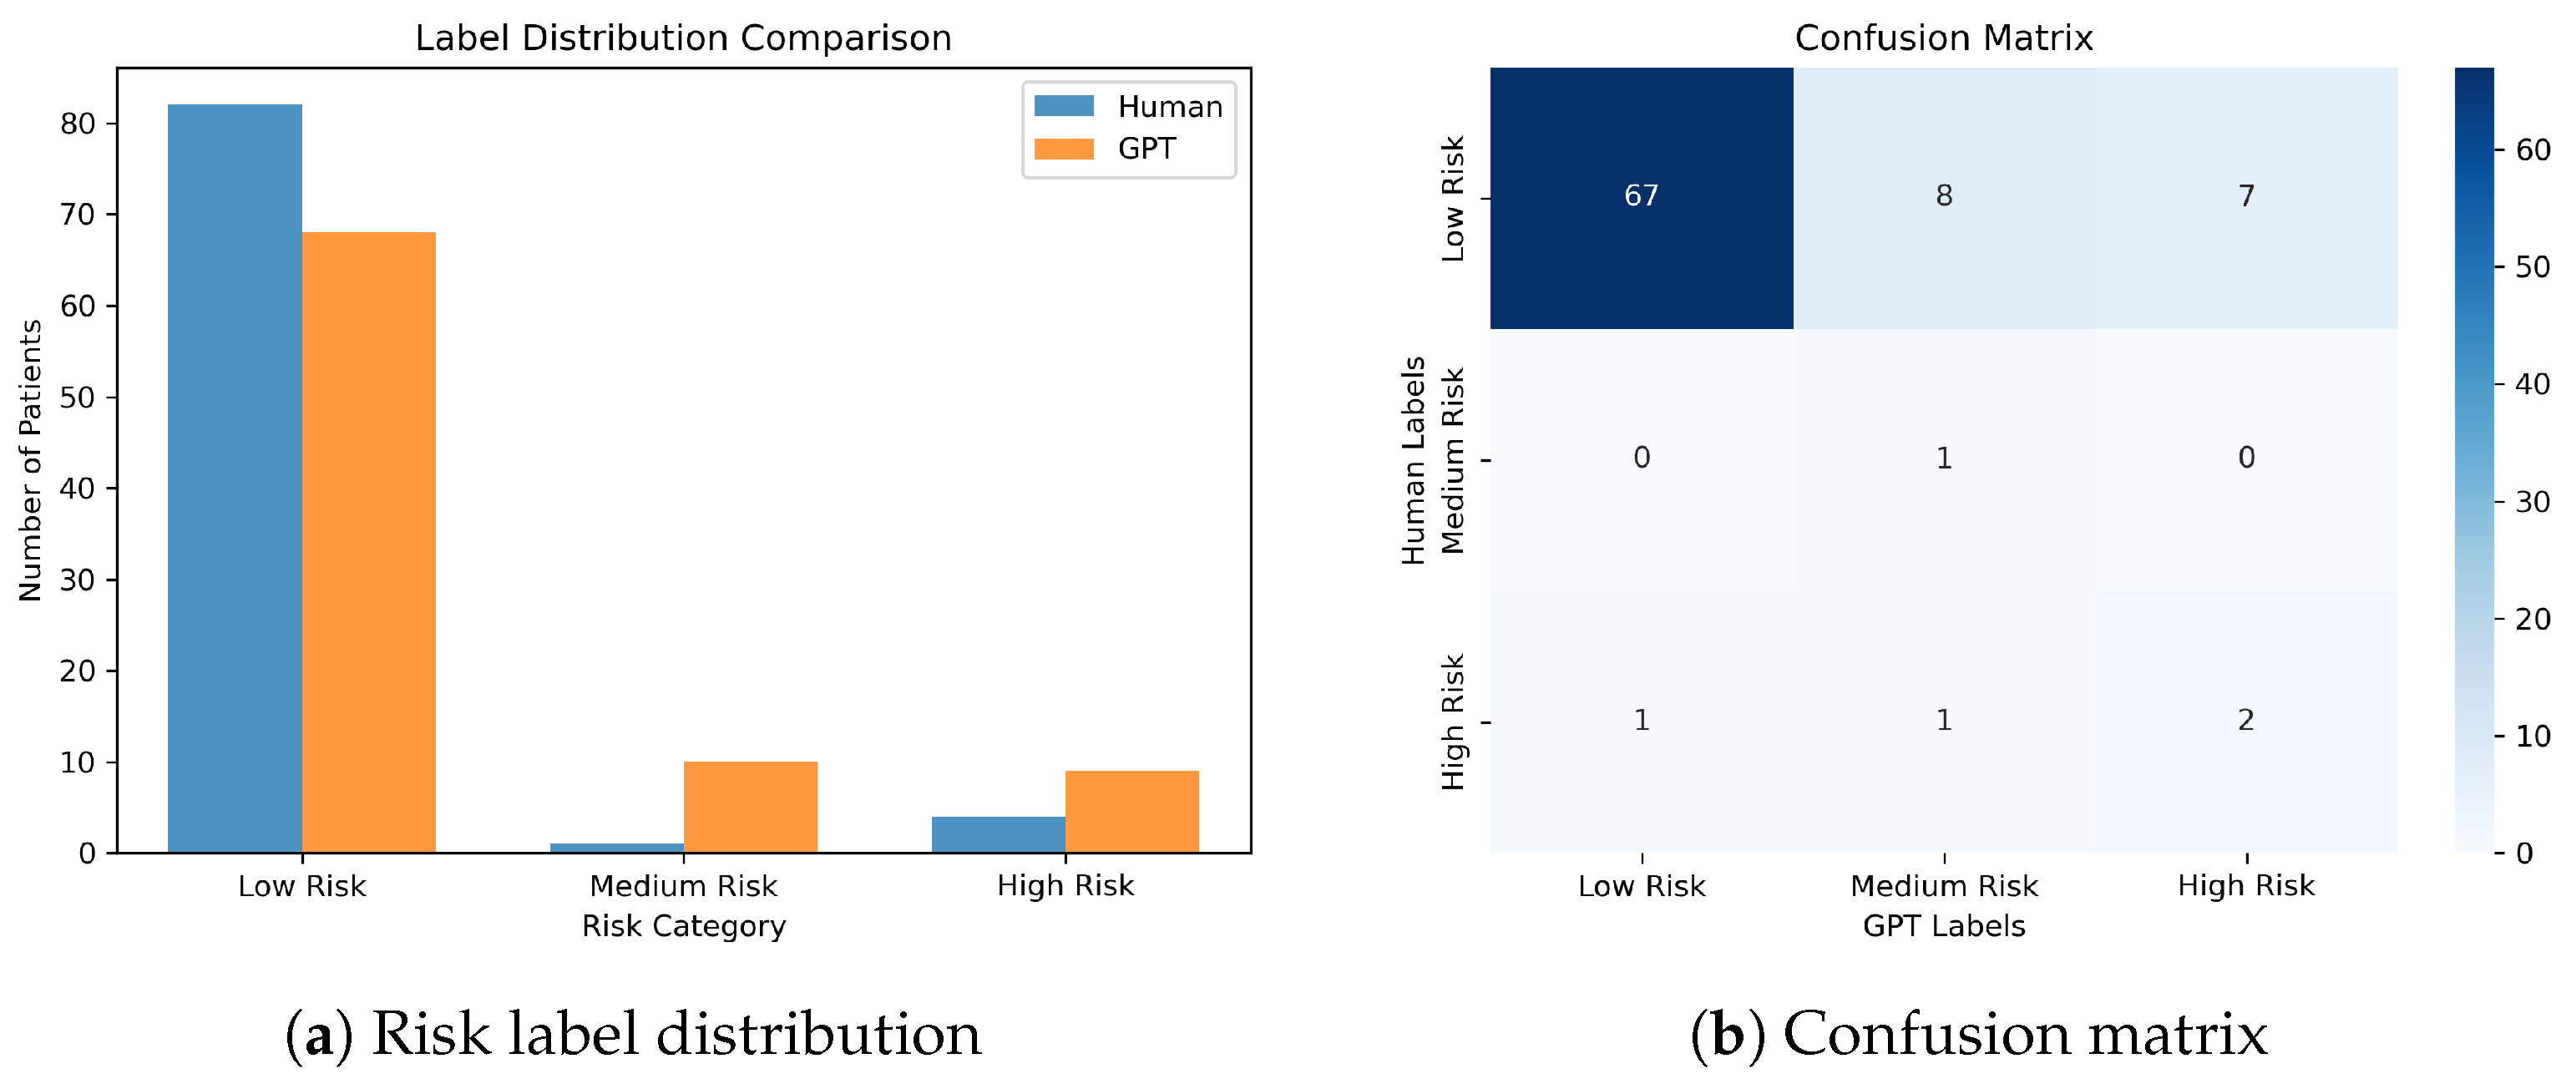
Figure 4 shows the comparison between GPT and human labels. It is important to note that the training of the networks was made exclusively using GPT-generated labels, i.e., all the images used for training were labeled using GPT. The distribution plot highlights that GPT produced more Medium Risk and High Risk classifications compared to medical annotations, which are more toward Low Risk. The confusion matrix shows how the GPT predictions mostly aligned with the human annotations.
Across the 87 patients that could be compared, GPT achieved an agreement rate of 80.5% with the medical labels, which corresponds to 70 patients matched, while 17 showed disagreements. These 87 patient records were defined by multiple annotators, i.e., each record was defined by a single annotator, but different records can be defined by different annotators.
A closer inspection of the disagreements shows two main types:
Moderate disagreements (9 cases): Occurred when GPT shifted a patient’s label by one class, for example, Low to Medium or Medium to High. Those errors can be explained by cases where visual features may be similar, like mild dryness being interpreted as either Low or Medium Risk.
Severe disagreements (8 cases): Involves contradictions, such as GPT labeling a patient as High Risk when experts considered Low Risk, or vice-versa. These errors are more critical and can impact the system’s performance. These cases can be linked to GPT misinterpretations of visual signs.
Despite these discrepancies, the results show that GPT can serve as a useful annotation tool, but its results have to be carefully interpreted and checked. Overall, while GPT annotations are not a replacement for human expert labeling, they provide a foundation for dataset preparation and model training, especially when medical resources are limited.
3.6. Models Structure
Two different pre-trained models, ResNet50 and VGG16, are used and trained to classify diabetic foot images into three risk categories: Low Risk, Medium Risk and High Risk. Both models are pre-trained on ImageNet and fine-tuned for the specific task of diabetic foot risk evaluation.
Pre-trained ResNet50 and VGG16 models from TensorFlow Keras, both initialized with ImageNet weights, were used. They are loaded with include_top=false, so we keep only the convolutional feature extractor and discard the original ImageNet classifier.
The original final classification layers of these pre-trained models are removed and replaced with a custom classification head designed for our task. This approach was chosen to achieve a balance between retaining the knowledge and feature detection learned from ImageNet and adapting it to specialized knowledge adapted to our dataset. The remaining backbone layers, which contain valuable feature extractors learned from ImageNet, are initially frozen to preserve their learned representations.
Training happens in two steps to carefully adapt to the medical images: Head Training (8 epochs), in which we freeze the backbone (its weights do not change) and train only the custom head. This lets the head learn our three classes quickly while preserving the useful features learned from ImageNet. Then, there is Fine-Tuning (15 epochs), in which the top 50% of the backbone layers are unfrozen, and training is continued using a smaller learning rate.
During the first stage, we froze the pre-trained backbone network (ResNet50 or VGG16) and trained only a custom head consisting of dense layers with dropout and batch normalization, allowing the model to learn task-specific representations while preserving the valuable low-level features learned on ImageNet. This initial phase enables the network to adapt its final decision making layers to the specific characteristics of our dataset without disrupting the feature extraction capabilities of the pre-trained weights [
28].
Following the head training phase, a fine-tuning phase is implemented by unfreezing the top 50% of the backbone layers and continuing training with a reduced learning rate to minimize the risk of overfitting [
28], which can potentially achieve improvements by adapting the pre-trained features to the new imaging data [
29].
The custom head architecture uses multiple dense layers with progressively decreasing dimensions (512, 256 and 128 neurons). A Global Average Pooling is first applied, reducing each feature map down to just one value. This is followed by a stack of fully connected dense layers with batch normalization and dropout to reduce overfitting, and finished with a softmax layer with three outputs.
3.7. Training Parameters
A sparse categorical cross-entropy is used as a loss function—see, for instance, [
30]. This function is designed for multi-class classification problems where we have more than two classes (in this case we have three), where each example belongs to one class, and the labels are integers (0,1,2) rather than one-hot encoded vectors. To deal with class imbalance, we computed class weights and then apply small boosts: Low × 1.1, Medium × 1.2, and High × 4.0, followed by normalization. This weighting was determined empirically with the underlying goal of ensuring that the model prioritizes High Risk detection, as it is the class with fewer samples. As the dataset imbalance is reduced, these weights can be adjusted.
The Adam optimizer is used with a learning rate of
during head training and
during fine-tuning. Validation loss is monitored with early stopping and uses ReduceLROnPlateau. The main parameters used in the development of this study are presented in the
Table 2.
5. A Streamlit App
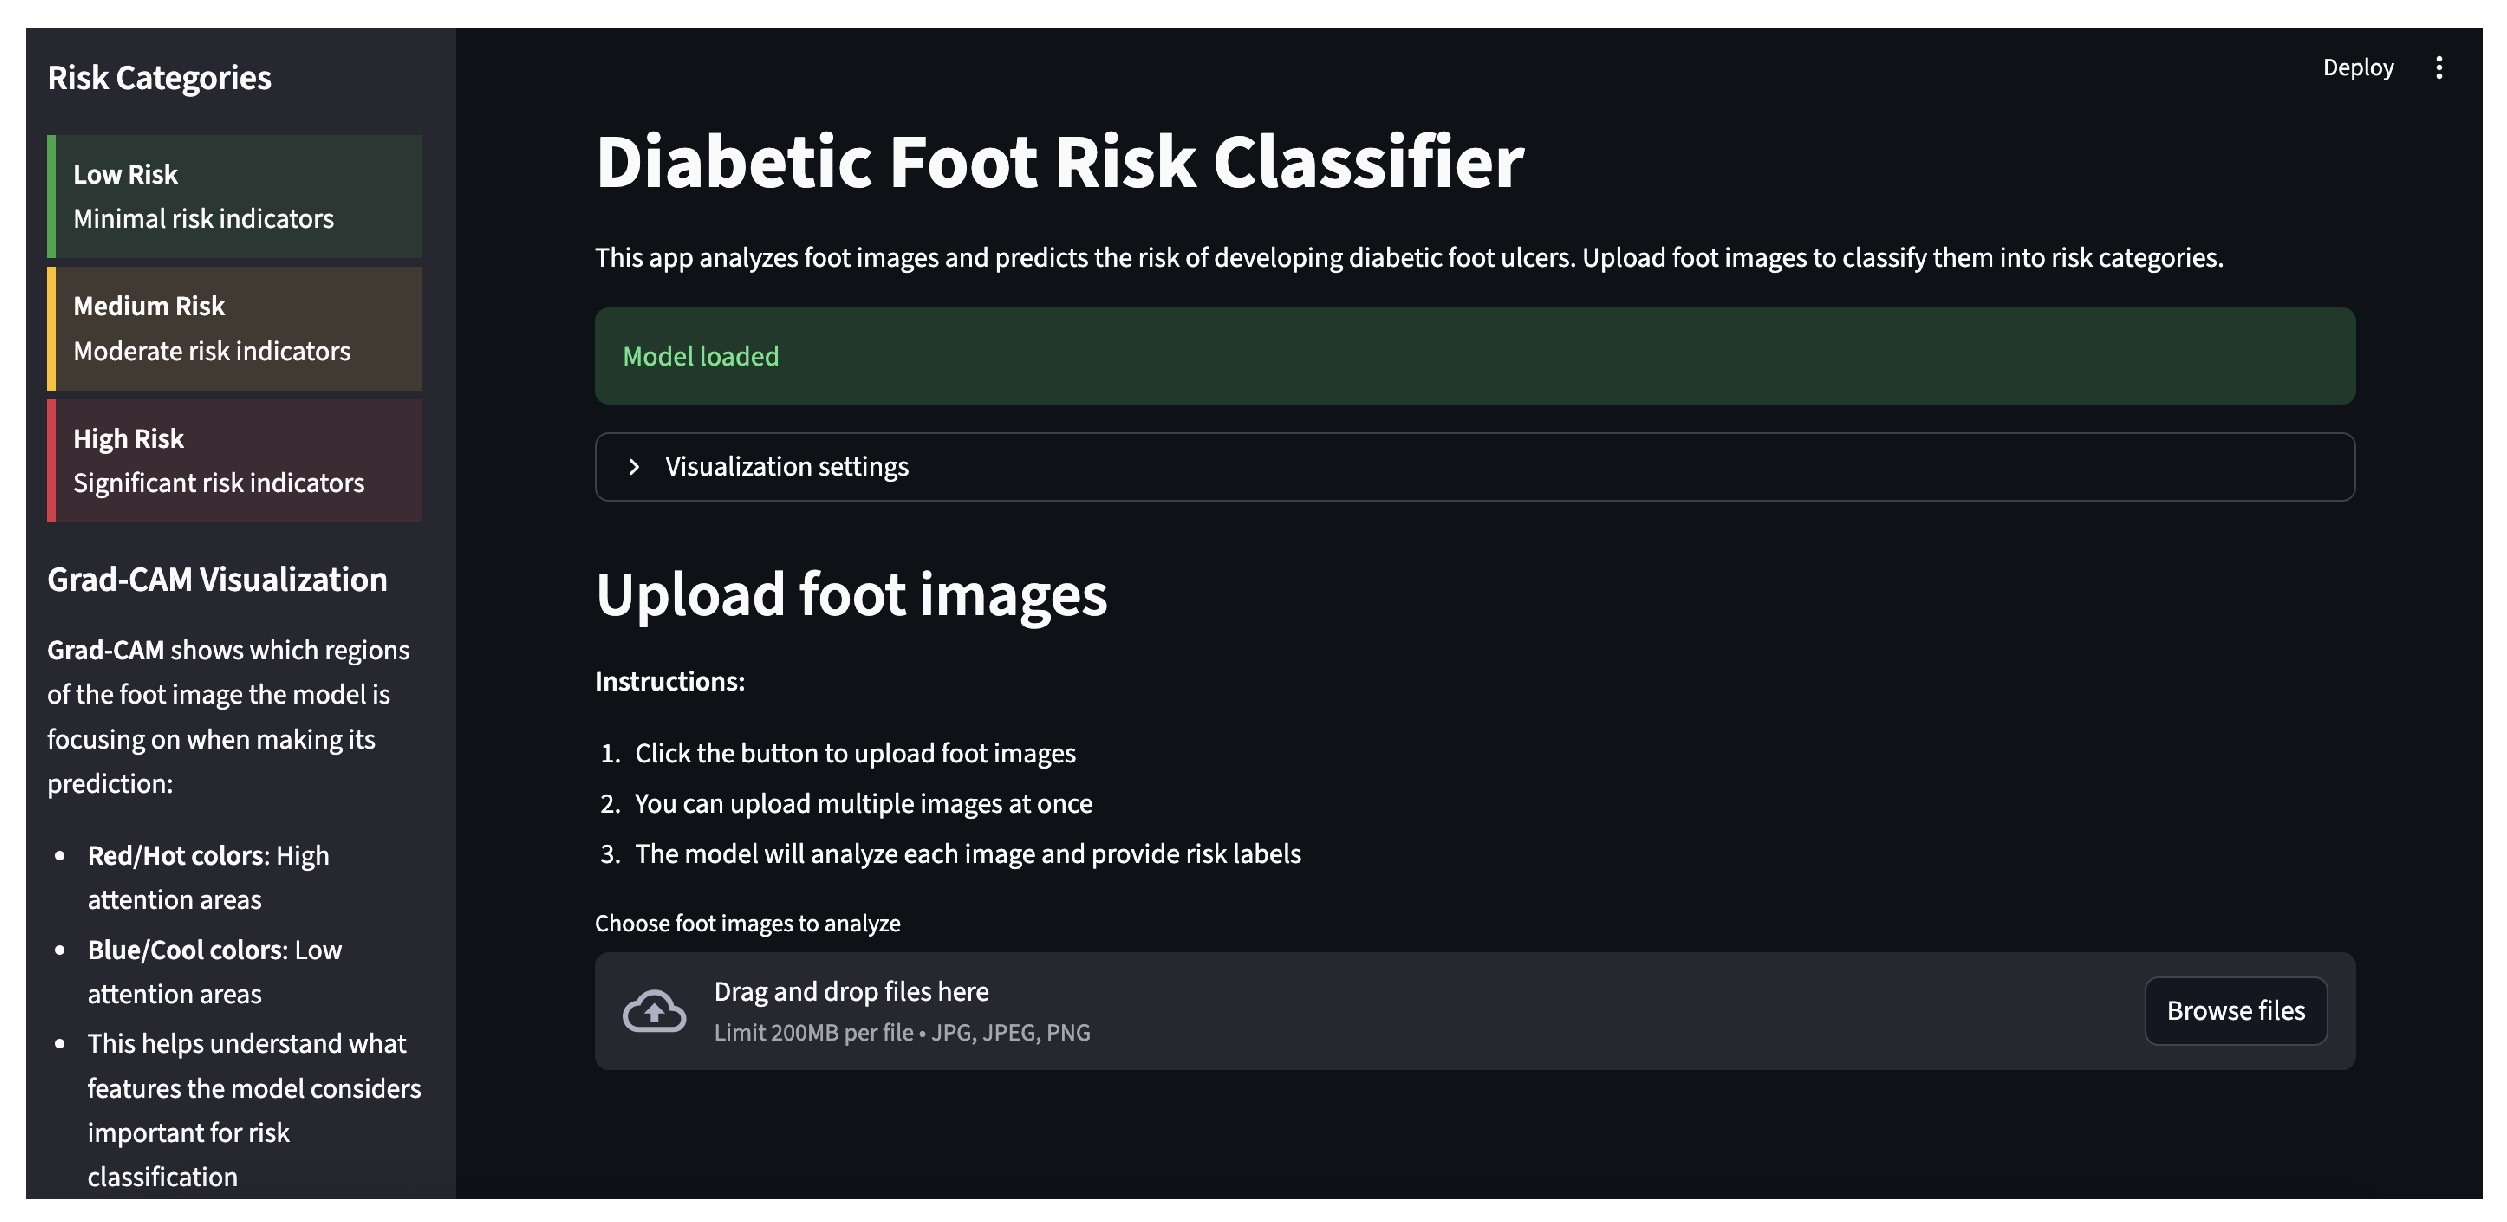
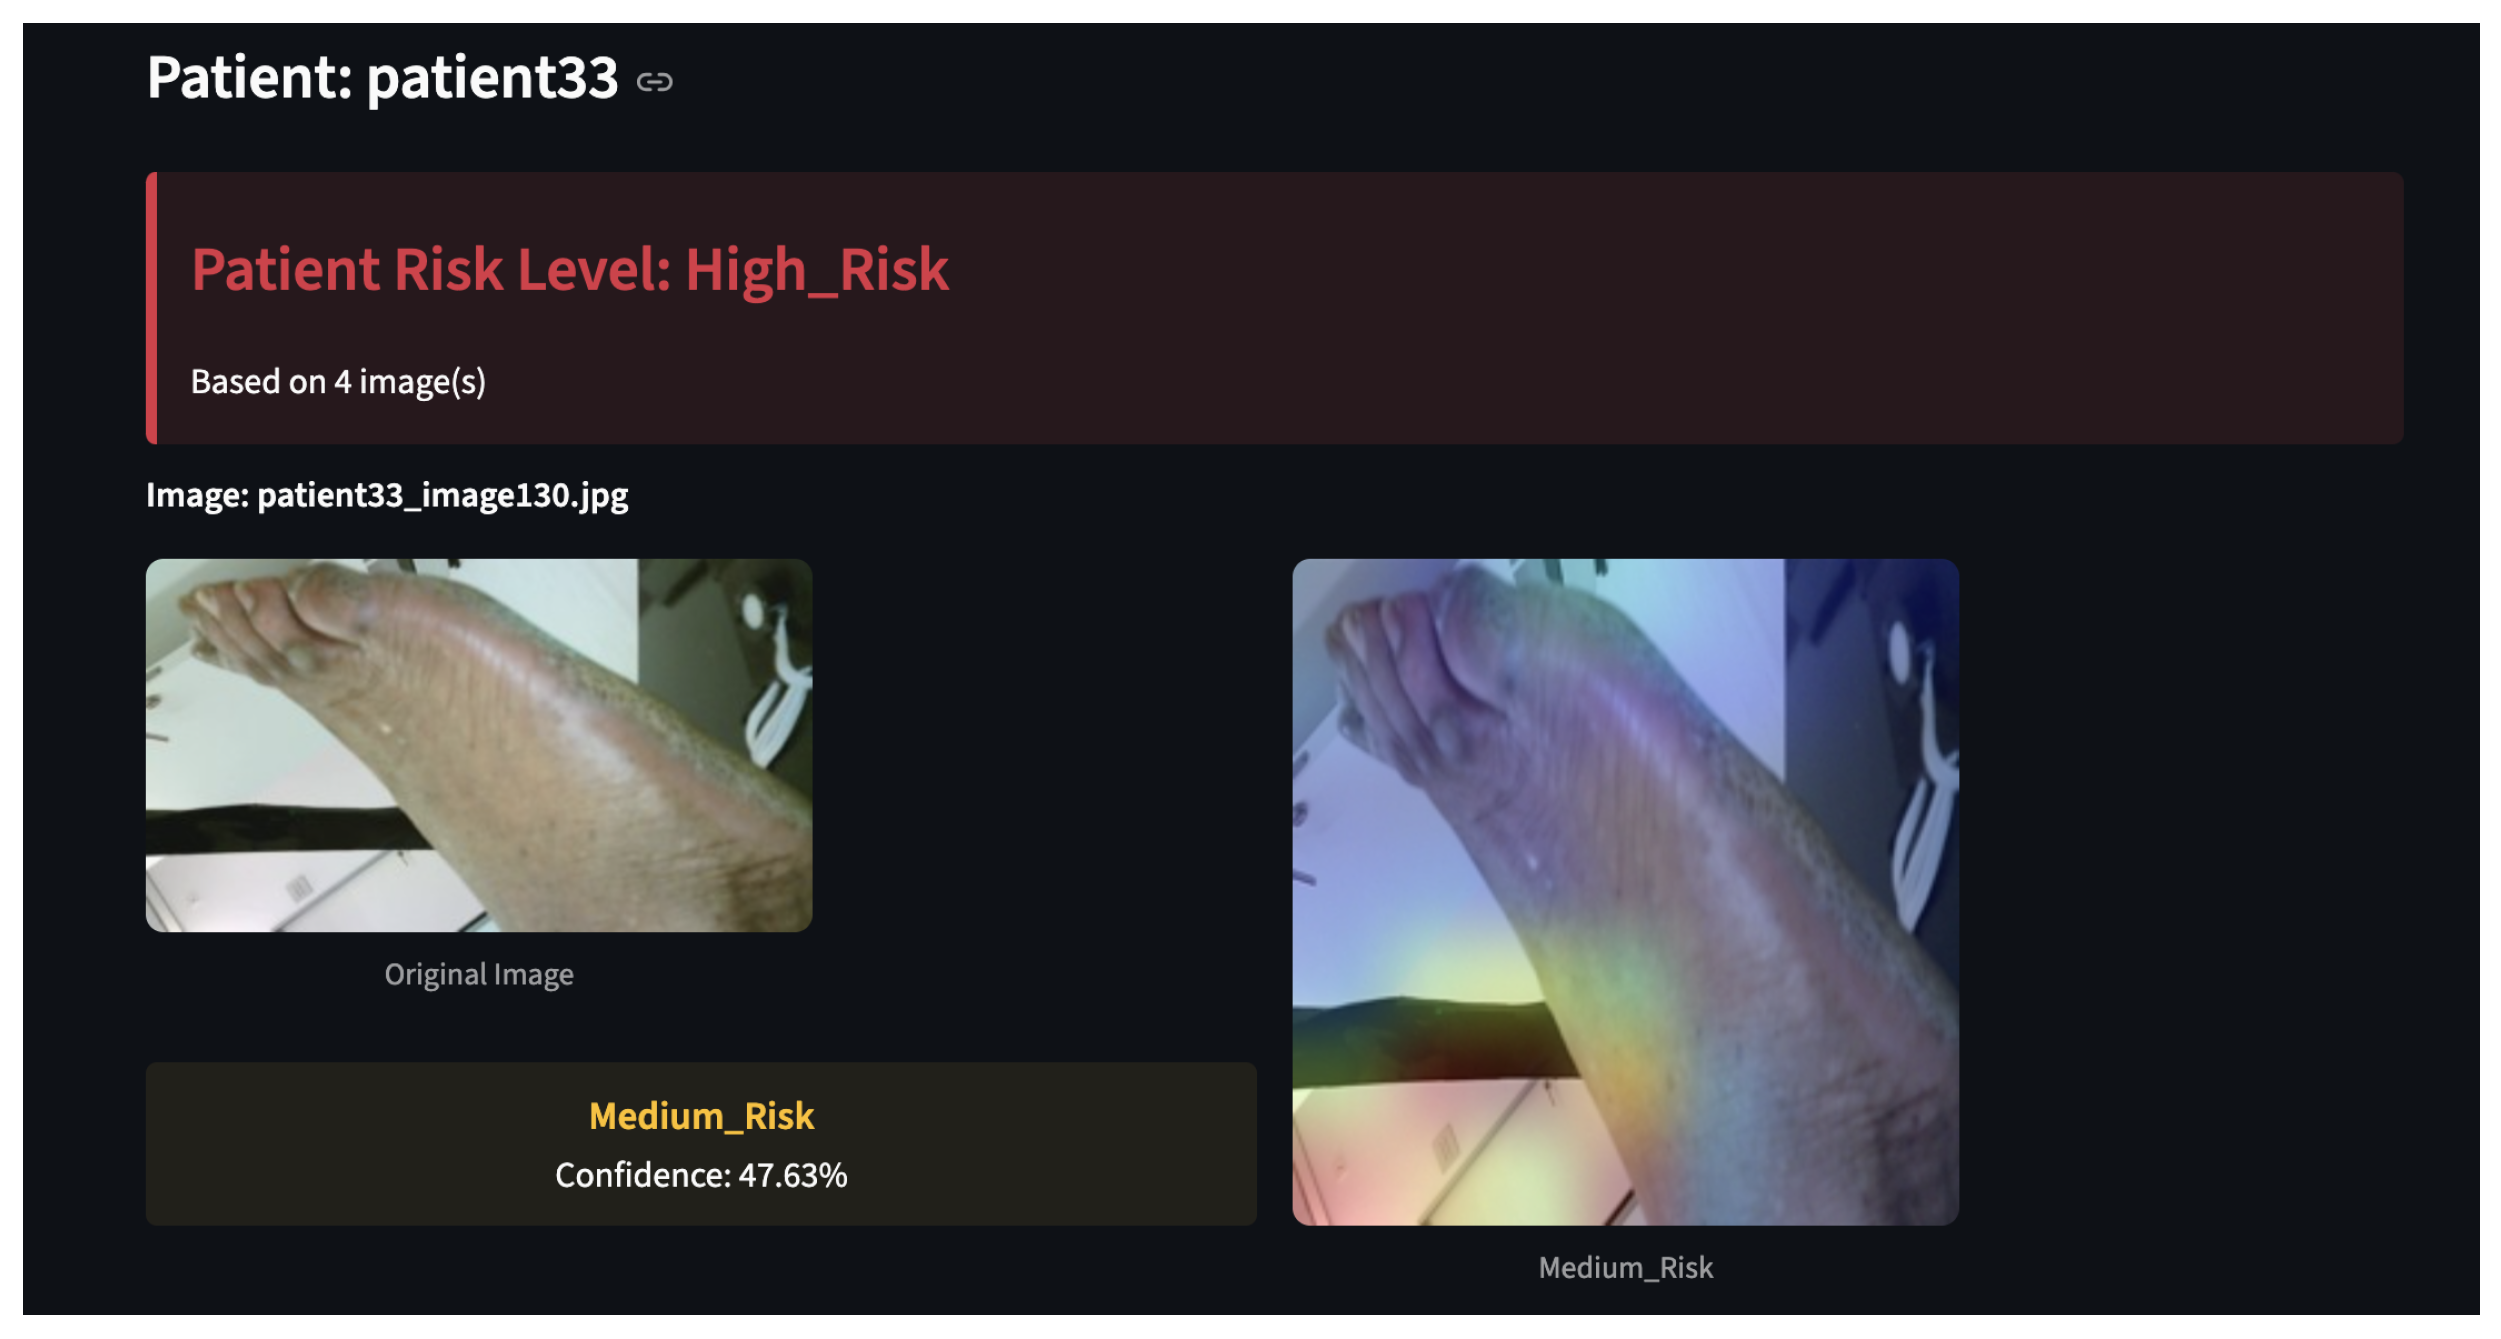
To demonstrate the practical applicability of the developed model, a prototype App was built in Python 3.13 using Streamlit framework (snapshots are shown in
Figure 5 and
Figure 6). The App provides an easy and user-friendly interface for medical professionals or researchers to upload foot images of diabetic patients and automatically obtain a risk classification (the App is still in R&D domain and has not yet been submitted to any regulatory/certification entity).
The App classifies individual images and also aggregates label predictions across multiple images from the same patient to provide a single-patient risk prediction, applying the logic presented in the previous sections.
To improve the interpretability of the results, the App integrates Grad-CAM visualizations that highlight the regions of the images that most influenced the model’s predictions, as illustrated in
Figure 6.
In this App, the user uploads images of diabetic foot patients, and it gives the risk label for each image, along with confidence scores for all the risk classes, for the user to understand how sure the model is about its predictions. Based on each individual image label, the patient is labeled, taking into account the criteria explained previously. Besides this, a Grad-CAM heatmap is shown next to the images, highlighting the areas of the image that the model primarily relied on for its decision. This addition makes it easier for the medical professionals to verify if the model is focusing on relevant areas such as ulcers and regions of dry skin. Also, it improves the trust in the model decision-making process, because we can validate the predictions and check if they make sense or not.
6. Conclusions
The results show that, despite limitations, labels generated by GPT provide a good baseline for model training, allowing an overall good performance in the predictions of the risk classes, particularly for the High Risk cases, and showing the potential of the generative AI approach. Moreover, a tool like the Streamlit App developed may work as an aid tool to challenge/tune the skills of healthcare professionals.
The presence of irrelevant or low-quality images and severe imbalance in the dataset, particularly for High Risk cases, is a consequence of the DF incidence in a real population. As the size of the dataset increases and the GenAI prompt is upgraded, re-training the models is likely to yield better results.
Automating DF risk assessment does not aim at replacing healthcare professionals. The currently employed DF tests have a degree of subjectivity, either intrinsic to each test or inherent to the human assessment (for example, the pedal pulse test using Eco Doppler sensors depends on the experience of the professional handling the sensor). As referred to in this paper, visual analysis can also be biased by subjective factors depending on the human experience. Automated systems, such as the one proposed in the paper, may play an important role as assistants to healthcare professionals or first-time diagnostic systems.